rological tests (ELISA and Rose Bengal) and the in- tradermal reaction test. A questionnaire was used to obtain information concerning the risk factors for.
European Journal of Epidemiology 15: 671±680, 1999. Ó 1999 Kluwer Academic Publishers. Printed in the Netherlands.
Epidemiological study of brucellosis in eight Greek villages using a Computerised Mapping Programme Ch. Hadjichristodoulou1, Ch. Papatheodorou1, E. Soteriades1, G. Panagakos1, I. Kastritis2, G. Goutziana1, E. Charvalos1 & Y. Tselentis1 1
Laboratory of Clinical Bacteriology, Parasitology, Zoonoses and Geographical Medicine, Faculty of Medicine, University of Crete, Heraklion; 2Itea Medical Centre, Itea, Fokida, Greece
Accepted in revised from 20 May 1999
Abstract. A Computerised Mapping Programme (CMP) was created step by step to cover all the needs of a cross sectional population survey conducted in eight villages of Fokida, a rural area of central Greece. The maps of Greece (boundary) and the topographical maps of the eight villages were created using the CMP. A volunteer sample of 1121 out of 2607 inhabitants of the study area participated in the population survey. The participants were tested for brucellosis using serological tests (ELISA and Rose Bengal) and the intradermal reaction test. A questionnaire was used to
obtain information concerning the risk factors for brucellosis. The risk factors found through statistical analysis were occupation (RR: 5.81, p < 0.00001), consumption of raw milk (RR: 1.98, p < 0.001) and unpasteurised fresh cheese (RR: 2.13, p < 0.01). The same factors were indicated by the CMP. The CMP also indicated manure-contaminated playgrounds in residential yards as a potential risk factor for children. The origin and dissemination were delineated using time±space association display. The CMP proved to be a useful tool in this epidemiological study.
Key words: Brucellosis, Computerised mapping, Geographical information system
Introduction Mapping Mapping has proven to be a powerful tool in epidemiological research. The initial use of mapping techniques was based on local distributions and classic infectious disease; examples of this are: 1. The study of a cholera epidemic in London (in 1854) in which the source of infection was located by using the distribution of residences. The cases identi®ed were clustered around the water supply system [3]. 2. The study of endemic typhus in Alabama (1922± 1926) in which the source of infection was identi®ed by using the distribution of residences and work-places. It was noted that the cases were clustered in a factory and the factory canteen was eventually identi®ed as the source of infection [4]. However, the methodology mentioned above has several shortcomings: 1. the maps do not take into consideration dierent population densities and, therefore, cannot identify real case clustering, 2. there is limited potential of mapping and comparative study, 3. the method is time consuming and not easily reproduced.
Recent advances in computer graphics have, however, simpli®ed the methodology and have led to the extensive use of mapping on a county-level such as the cancer mortality maps that were used together with correlation analysis to generate hypotheses on cancer aetiology [5±8]. Mapping techniques have also been used in the study of infectious diseases and injury research in public health surveillance [9±14]. All the above mentioned applications rely on the usage of administrative boundaries (county level maps) which are arti®cial, creating many problems in the way a clusters are de®ned. The problem is greater when the boundaries include a small population and the disease under study is rare. Thus a cluster of cases could be identi®ed by chance. Despite the extensive use of computerised mapping techniques for country and county-level maps, there is no experience in using these techniques for small areas (villages, municipalities, etc.). One of the published articles refers simply to charting and to studying the geographical incidence and prevalence of morbidity and mortality in the local area of a general practitioner [15]. The overall aim of this study was to develop an accessible, integrated mapping tool for ®eld epidemiologists using the study of brucellosis in Greece as an exemplar.
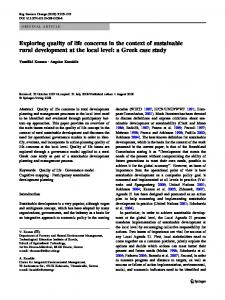
672 Brucellosis Brucellosis, a zoonosis distributed worldwide, is caused most commonly by Brucella melitensis. The control of brucellosis in animals, which is considered the only eective step in preventing the disease in humans, is a dicult and expensive task. Controlling human brucellosis in most countries has relied upon establishing reporting systems of both human and animal brucellosis cases [1]. Between 1980 and 1989, 5958 brucellosis cases were reported to the Ministry of Health, Greece, with high incidence rates in the rural areas. Since it is well known that brucellosis, like other infectious diseases, is underreported, the number of brucellosis cases in this decade is assumed to be much higher. Moreover, seroepidemiological studies support the fact that brucellosis is endemic and constitutes a serious health problem in certain rural areas of Greece [2]. Thus a control programme for the high incidence areas was designed. The main tools used in this programme were long-term surveillance, health education and the Computerised Mapping Programme (CMP). The study constitutes the ®rst phase of a pilot control programme for brucellosis (1989±1993) providing the necessary information concerning modes of brucellosis transmission in the selected area. Methods Preparation of the maps and selection of the study area Country and county boundaries were manually entered as coordinates into the CMP database. By means of a series of relational databases, the CMP produced a topographic map of a country which could be `zoomed' to county-level and further zoomed to small area topographical maps (e.g. municipalities, communities, villages, etc.). These maps were linked to a ¯exible database permitting detailed epidemiological studies. This software was developed to be able to visualize the time and space development of cases allowing for dynamic visualization of epidemiological events. Moreover, the system allowed analysis of data across administrative boundaries, mirroring the spread of disease, by using squares in which the incidence rate is calculated and compared with the expected (incidence rate of the whole country) by the v2 test. Eight villages in a rural area of Greece (Fokida), where the disease was known to be endemic, were chosen for the study. Evidence of endemicity was established by referring to records obtained from the Ministry of Health about brucellosis cases for the last 10 years in the whole country. These cases were mapped on a country level map and the rural area of Fokida was selected as having one of the highest prevalences (Figures 1 and 2).
The topographical data of the eight villages were entered manually as coordinates into the computer. Physical characteristics, for example buildings and stables, were included. These parameters were given 3-digit codes and each was given a dierent sign. Information on the inhabitants was obtained from the Greek National Statistical Service or local authorities and these data were entered into the CMP. The topographical and demographic data were then veri®ed and up-dated on site (Figure 3). Participants The total population of the eight villages comprised 2607 inhabitants. All those who agreed to participate in the study underwent a clinical examination. A standardized questionnaire was used to obtain information relevant to the disease in the past 30 years and for potential risk factors (occupation, consumption of milk products, etc.). The participants were further tested for brucellosis using an intradermal reaction test (IDR test Pasteur Merieux) [16] and/or serologically by the Rose Bengal and ELISA IgG tests [17]. Prevalence To estimate the prevalence, we used the term `brucellosis in the past'. Every individual with either a history of brucellosis (from questionnaire: compatible symptoms and positive serological test and treatment for brucellosis), positive IDR, positive Rose Bengal or positive ELISA was considered as `brucellosis in the past'. Identi®cation of risk factors Personal risk factors Questionnaires were used to obtain detailed information on each participant in the population survey (for example occupation, age, sex, domestic animals and animal abortion, consumption of the raw milk, consumption of milk products, brucellosis in the past). The information was entered into the database as a 4-digit code. These data were linked to the topographical map by using the house-person units as a 7-digit code (house: ®rst 3 digits, person: last 4 digits). Environmental risk factors Additional factors considered to be relevant to animal brucellosis were added to the initial map, for example the location of stables and abattoirs. Statistical analysis Representativeness of sample Once the topographical map of each village was produced displaying houses, stables, dairies and participants, in addition to the classic statistical analysis, the programme used 10 equidistant vertical
673
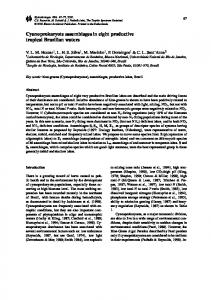
Figures 1 and 2. A computerised country level map in which the county bounders are depicted in colour according to the brucellosis cumulative incidence rate of each county calculated for the past 10 years (data from the Ministry of Health). The county of Fokida had one of the highest cumulative incidence rates and thus was selected as the study area. Zooming into the selected county, the villages are depicted in colour according to the brucellosis cumulative incidence rate. In this way, eight villages were selected for the study.
674 zones across the map to ensure that the sample represented the whole population with its geographical distribution. In each zone the number of participants and non-participants were calculated. A v2 test was used to test the possibility that any dierence in the two distributions was not statistically signi®cant. Moreover, the region was divided by squares in which the percentage of participants was calculated and compared with the expected (participation of the whole village) by v2 test. Other analyses Parametric methods (Student's t test) were used to test for dierences in quantitative measures. Relative risks were calculated and p values derived by means of the v2 test. An association was considered to be statistically signi®cant for p values of