CLIMATE RESEARCH Clim Res
Vol. 45: 179–192, 2010 doi: 10.3354/cr00899
Published online December 30
Contribution to CR Special 24 ‘Climate change and the British Uplands’
OPEN ACCESS
Estimating changes in Scottish soil carbon stocks using ECOSSE. I. Model description and uncertainties Jo Smith1,*, Pia Gottschalk1, Jessica Bellarby1, Stephen Chapman2, Allan Lilly2, Willie Towers2, John Bell2, Kevin Coleman3, Dali Nayak1, Mark Richards1, Jon Hillier1, Helen Flynn1, Martin Wattenbach1, Matt Aitkenhead1, 2, Jagadeesh Yeluripati1, Jenny Farmer1, Ronnie Milne4, Amanda Thomson4, Chris Evans5, Andy Whitmore3, Pete Falloon6, Pete Smith1 1
Institute of Biological & Environmental Sciences, School of Biological Science, University of Aberdeen, 23 St. Machar Drive, Aberdeen AB24 3UU, UK 2 Macaulay Land Use Research Institute, Craigiebuckler, Aberdeen AB15 8QH, UK 3 Rothamsted Research, Harpenden, Hertfordshire AL5 2JQ, UK 4 Centre for Ecology & Hydrology, Bush Estate, Penicuik, Midlothian EH26 0QB, UK 5 Centre for Ecology & Hydrology, Environment Centre Wales, Deiniol Road, Bangor, Gwynedd LL57 2UW, UK 6 Met Office Hadley Centre, FitzRoy Road, Exeter, Devon EX1 3PB, UK
ABSTRACT: To predict the response of C-rich soils to external change, models are needed that accurately reflect the conditions of these soils. Estimation of Carbon in Organic Soils — Sequestration and Emissions (ECOSSE) is a model that allows simulations of soil C and N turnover in both mineral and organic soils using only the limited meteorological, land-use and soil data that is available at the national scale. Because it is able to function at field as well as national scales if appropriate input data are used, field-scale evaluations can be used to determine uncertainty in national simulations. Here we present an evaluation of the uncertainty expected in national-scale simulations of Scotland, using data from the National Soil Inventory of Scotland. This data set provides measurements of C change for the range of soils, climates and land-use types found across Scotland. The simulated values show a high degree of association with the measurements in both total C and change in C content of the soil. Over all sites where land-use change occurred, the average deviation between the simulated and measured values of percentage change in soil C was less than the experimental error (11% simulation error, 53% measurement error). This suggests that the uncertainty in the national-scale simulations will be ~11%. Only a small bias in the simulations was observed compared to the measured values, suggesting that a small underestimate of the change in soil C should be expected at the national scale (–4%). KEY WORDS: Organic soils · Dynamics simulation modelling · Changes in soil C stocks · Land-use change · Uncertainty · National-scale simulations Resale or republication not permitted without written consent of the publisher
1. INTRODUCTION Climate change, held to be largely driven by increases in greenhouse gas (GHG) emissions, is one of the most serious threats facing our planet (IPCC 2007), and is of concern at international, UK and devolved administration levels (Scottish Government 2010, UK Government 2010, Welsh Assembly Govern-
ment 2010). Accurate predictions of the effects of changes in climate and land use on GHG emissions are vital for informing land use policy. Peatlands, characterized as carbon (C)-rich soils, cover approximately 4 million km2 globally, with a total C stock estimated in 2008 to be ~450 Pg C (Joosten 2009). This amounts to 18% of the 2500 Pg C stored in all soils (Lal 2004). Peat is found across the planet, with Russia,
*Email:
[email protected]
© Inter-Research 2010 · www.int-res.com
180
Clim Res 45: 179–192, 2010
Canada, Indonesia and the USA having the largest peatland areas, totaling just under 3 million km2 (Joosten 2009). Northern peatlands are the most important terrestrial C store, holding between 200 and 450 Pg C (Gorham 1991, Turunen et al. 2002). The rate of C accumulation over the last 6000 to 8000 yr has been estimated to be between 20 and 30 g C m–2 yr–1 (Gorham 1991, Vitt et al. 2000, Turunen et al. 2002, 2004), and over the Holocene, northern peatlands are estimated to have accumulated C at an average rate of 96 Mt C yr–1, making peatlands not only a substantial store of C, but also a large potential sink for atmospheric C (Gorham 1991). Highly organic soils can make a significant contribution to national GHG emissions. For example, ~15% of Scotland’s total emissions come from land-use changes on Scotland’s C-rich soils (Smith et al. 2007). To predict the response of organic soils to external change, models are needed that accurately reflect the conditions of C-rich soils, including peats and those soils with thin (< 50 cm) organic layers overlying mineral material (organo-mineral soils). Most models currently used to predict differences in soil C and nitrogen (N) caused by these changes have been derived from models originally developed for mineral soils (Smith 2001). None of these models is entirely satisfactory for describing what happens to organic soils following land-use change, due to the omission of processes that are important in organic soils (Smith et al. 2007). For example, national-scale simulations of GHG emissions using the RothC soil organic C model (Coleman & Jenkinson 1996) provide unrealistic results for the majority of soils in Scotland due to the large proportion of highly organic soils (Smith et al. 2007). Here we present an assessment of the uncertainty of simulations from an example application of a new model designed to provide more accurate simulation of net change to soil C and N in response to changes in land use and climate in highly organic as well as mineral soils. This new model assumes that similar processes can occur in mineral and organic soils, but the extent of these processes is modified by the soil conditions. The uncertainty was estimated for national simulations of changes in soil C stocks in Scotland. Scotland is a relatively small country (~78 000 km2), and has soils ranging from 22%, then: db = 1.772 − 0.413 ln PC
(12)
If PC is ≤ 22%, then: db = 1.536 − 0.0472 × PC
(13)
This was done for the original land use observed in the 1978–1988 sampling as well as for any new land use observed in the 2007–2009 sampling, thus allowing the impact of land-use change on SOM turnover to be simulated. Soil pH was used to calculate rate-modifying factors for aerobic and anaerobic decomposition as shown in Eqs. (3) and (6), and to determine the stable C:N ratio given in Eq. (8). The percentage clay (PK) was used to calculate the proportion of SOM retained in the soil on decomposition following the approach of Coleman & Jenkinson (1996) and, together with the bulk density (d b, g cm– 3) and percentage silt content (Ps), to estimate the water content between field capacity and permanent wilting point (θ f), using the following equation adapted from Hall et al. (1977): θf = (47 + 0.25K + 0.1Ps+
1.12Ctot,sim − db × 106
16.52db − (2.94 + 0.83PK − 0.0054PK2))
(14)
Eq. (14) was originally derived to determine field capacity in soils from England and Wales, and so will
introduce some error when applied to Scottish soils, especially peats. However, because the activity of SOM decomposition is initialized using the specified soil conditions as described in Section 2.4, the impact on changes in soil C of errors in estimated field capacity will be small. This was demonstrated by rerunning the model using alternative pedotransfer functions derived for organic soils in the UK as part of an update to the SEISMIC environmental information and scenario mapping system (http://randd.defra.gov.uk/ Document.aspx?Document=PS2225_7916_FRP.pdf). The most suitable equation for Scottish peat soils was: θf = 65.1 + (0.348 × PC ) − (30.751 × db )
(15)
The difference in the change in soil C was less than 0.01% of the total C change. If the focus of the simulations was the impact of changes in the soil water status on soil C, a more specific pedotransfer function might be required. The water content and temperature rate modifiers given in Eqs. (1, 4 & 5) were calculated using weather data, downloaded as a grid of 5 km2 cells from the climate monitoring service of the MetOffice UK. These data were also used to simulate leaching, denitrification and volatilization as described by Bradbury et al. (1993). Long-term average monthly data based on the period of 1961–1990 were used in the calculation of the amount of C in the SOM pools at the start of the simulation and the organic inputs for each land-use type. Actual monthly data were used to run the model forward to simulate any impacts of climate change between the 2 sampling times. Rock, iron pans and other layers with slow permeability to water were assumed to be the bottom of the profile for the purpose of simulation modelling. Soil C measurements for the top litter layers were frequently missing, and so the simulations could not be evaluated in these litter layers. The national simulations included all layers in the soil profile; this often includes litter layers. If the uncertainty in the simulation of litter layers is very different to that of other layers, this could introduce an error in the estimate of uncertainty in the national simulations; additional data are required to resolve this issue. Total C was calculated for each depth using bulk density and percent soil C. The amount of C was corrected for the percentage of stones in the soil. In some instances, the percentage of stones changed between the 2 sampling times. This is likely to be due to spatial variability at the site. To allow comparison between the soil C contents at the 2 sampling times, the C content of the soil at the second sampling time was adjusted assuming the percentage of stones to be equivalent to the percentage found at the first sampling time. Horizon depths were corrected similarly.
189
Smith et al.: ECOSSE model description
600
400
200
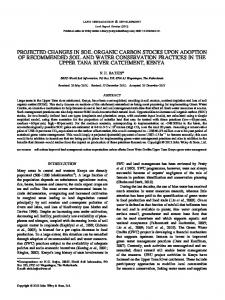
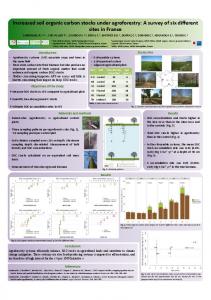
r2 = 0.94 p < 0.001 RMSE = 20%
0 0
200
400
600
800
1000
Measured (t C ha–1) Fig. 2. Simulated versus measured values of soil organic carbon in the 0–100 cm soil profile at the 2007 sampling. RSMSE: root mean squared error
3.5. Results of simulations of changes in soil C in the NSIS We plotted the simulated soil C against the measured data at 60 resampled sites (Fig. 2). The 1:1 line is given in the plot, and represents perfect agreement between the simulations and the measurements. The spread of points around the 1:1 line indicates that there are some errors in the simulation of changes in soil C with time since the first sampling date. However, over all sites, the correlation between the simulated and measured values is high and statistically significant (r2 = 0.94, p < 0.001) for all land uses (Table 4). Overall, the total error (RMSE) between the simulated and measured values of C is 20% of the average measurement. Larger errors between simulations and measurements occur at some sites. As discussed below, these are associated with inaccuracies in the measurement inputs, as well as being due to the model. However, because these errors are part of the uncertainties
Table 4. Evaluation of the degree of association and coincidence between values simulated by ECOSSE using the limited data input available at a national scale and measurements at the 62 NSIS sites. RMSE: root mean squared error Land use
Arable Grassland Forestry Semi-natural Overall land uses
Association r2 p 0.91 0.93 0.97 0.94 0.94
< 0.001 < 0.001 < 0.001 < 0.001 < 0.001
Lack of coincidence RMSE (%) 21 39 19 15 20
Arable→Grass Grass→Arable Natural→Forestry
ine
Simulated (t C ha–1)
800
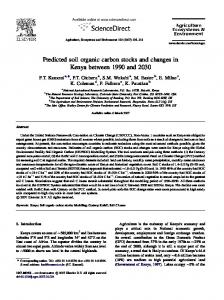
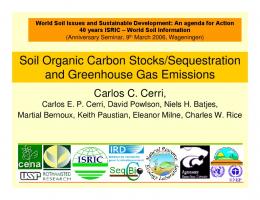
encountered in the simulations at a national scale, these values should be included in the potential uncertainty in the simulations. The simulated change in C content was compared to the measured C change. This is expressed as a percentage change to normalise the impact of C change at sites with large and small C content (Smith et al. 1996b). Unfortunately, the errors in the measurements with this type of re-sampling exercise can be extremely high. This is due to the inherent spatial variability, especially at unmanaged sites, as well as any unrecorded management between the first and second sampling dates and the difficulty in relocating sampling sites (Lilly et al. 2009). At sites where no land-use change has occurred, the uncertainties in the measurements are larger than the simulated change in soil C, and so no meaningful statistical analysis was possible. Simulated change in soil C at the sites where land-use change has occurred is shown in Fig. 3. Only these latter sites are included in the following analysis. Simulation of change in C content is a more stringent test of the model than the simulation of total C content. Over all sites where land-use change has occurred, the correlation between the simulated and the measured values is given by r2 = 0.25. This is not significant, suggesting the simulations and measurements are not highly associated. However, this changes when the experimental error is taken into account. For 4 sites, the 95% confidence intervals of the measurements are very high, > 35% (Table 5). If these sites are excluded from the analysis, the correlation coefficient increases to 0.80. Although the r2-value is high, this is still not 25
1:1 L
Arable Grass Forestry Semi-natural
Simulated change (%)
1000
20
All Sites r2 = 0.25 p > 0.05 RMSE = 11% Sites with 95% confidence interval < 35% r2 = 0.8 p > 0.05 RMSE = 7%
15 10 5 0 –100
–50
0
50
100
–5 –10 –15 –20 –25
Measured change (%) Fig. 3. ECOSSE-simulated values against measured values of change in carbon content for the 9 NSIS sites where land-use change has occurred. Error bars are 95% confidence intervals
190
Clim Res 45: 179–192, 2010
whereas a large increase is measured (+ 33 and + 79% respectively). It is unlikely that such a large increase in soil C would occur without some change in land 95% CI use or management, but there is no record of any such changes. This illus68 trates one type of error that occurs, not 35 69 due to the failure of the model, but rather due to the limited data available for 19 national-scale simulations. These errors 38 may have been attributable to the use of 13 improved crop varieties, changes in cropping practice (such as straw incorpora31 tion) or the inclusion of a short-term ley within the arable rotation resulting in a 21 temporary increase in soil C before the 180 land is used for crop production again. 53 Similarly, at 2 grassland and 2 semi-nat24 ural sites, a relatively large decline in soil C is measured (grass = –19 and –4%; semi-natural = –43 and –16%), whereas the model simulates a small increase (grass = + 2 and + 3%; semi-natural = + 2 and + 4%). This again could be due to an interim period of land-use change, resulting in the reduction in soil C, before the land is converted back to grassland or semi-natural use. At one forestry site, a moderate decline in soil C is observed (–12%), whereas an increase is simulated (+ 3%). This may be attributable to disease, drainage of a highly organic site or inaccurate assumptions about the age class of the forestry. At the remaining 44 sites, the simulated values have the same sign as the measurements, and are usually within or only slightly outside the reported experimental error.
Table 5. Estimated errors in measurement at the 9 NSIS sites where land-use change occurs. 95% CI: 95% CI in measurement of % change in soil C Land-use change
Soil association/Series/Type
Arable to grassland
Alluvial/Traquair Alluvial/Lochside Balrownie/Balrownie/Brown earth with gleying Tynet/Aulthash/Humus iron podzol Tarves/Thistlyhill/Brown earth with gleying North Mormond/North Mormond/ Brown earth with gleying Auchenblae/Auchenblae/ Humus iron podzol Arkaig/Kildonan/Peaty podzol Strichen/Strichen/Humus iron podzol and iron podzol
Grassland to arable
Semi-natural to forestry Average Average excluding sites with 95% CI > 35%
significant, due to the low number of measurements now included in the comparison (only 5). However, the simulated values are all within the measured 95% confidence interval of the 1:1 line between simulations and measurements, suggesting the association between simulations and measurements is within the range of experimental error. The average deviation between the simulations and the measurements is only 11% if all points are included, and 7% if the measurements with high experimental error are excluded. This is less than the average measured deviation at the 95% confidence interval (53% for all points and 24% when measurements with high experimental errors are excluded, see Table 5). Therefore, the coincidence between the simulations and the measurements is also well within the range of experimental error; the model cannot be improved further against this data (Smith & Smith 2007). The bias in the simulations, as indicated by the relative error (Loague & Green 1991, Smith et al. 1996b, 1997), is very low: –4% for all measurements. Therefore, only a small systematic underestimate (–4%) is expected in the national simulations. The simulations at the sites where land-use change has occurred are all within the range of experimental error, but at 25% of the sites without land-use change (22% of all sites) the simulated values show a greater deviation from the measurement than the recorded experimental error. The sites where the error between simulations and measurements exceeds the recorded experimental error include all land-use types, so no systematic error due to including a particular land-use type has been identified. At 2 arable sites, ECOSSE simulates a small decline in soil C (–2 and –6%),
4. IMPLICATIONS FOR NATIONAL SIMULATIONS The ECOSSE approach assumes similar processes can occur in mineral and organic soils, but the extent of the processes is modified by the soil conditions. This combined approach is in contrast to previous work, where mineral and organic soils have been treated differently, assuming that many of the processes occurring in mineral and organic soils are fundamentally different (e.g. Bradbury et al. 1993, Clymo 1992). This ability to use a combined approach is an important assumption for application of the model at national scale, as it avoids the need for an arbitrary differentiation between soils that are considered to be organic and those that are assumed to function as mineral soils, and allows the whole area to be simulated using the same model. Because ECOSSE is able to function at field as well as national scales, if appropriate input data are used,
191
Smith et al.: ECOSSE model description
field-scale evaluations can be used to determine uncertainty in national simulations. However, despite using a large survey of soils data in Scotland (Lilly et al. 2009), the evaluations were limited to only a few sites. This was due to the large uncertainty inherent in such measurements compared to the size of the changes in soil C observed; only at sites where land use had changed was the change in soil C significant. Therefore, only these sites could be included in the statistical analysis. Much of this measurement error is introduced by semi-natural upland sites; the inherent measurement error is greater in semi-natural upland sites where variations in vegetation and topography introduce greater spatial variation in soil characteristics than in arable or grassland sites (Lindsay et al. 1985). Improved estimates of uncertainty could be achieved by separating out analyses for semi-natural uplands and focusing research effort on improving measurements at these sites. Uncertainty in the simulations is also introduced by uncertainties in the input data, including uncertainties in timing of land-use change, actual management of arable land, grassland and forestry, and unrecorded land-use change before the start of and during the simulation. These factors are also likely to be unknown at a national scale, and so the erroneous results due to uncertainty in the input data are included in the estimate of uncertainty in the simulations. For a further discussion of uncertainty estimates, see Falloon et al. (2006). Despite the uncertainties in the input data and the measurements used to evaluate the model, the simulated values show a high degree of association with the measurements in both total C and change in C content of the soil. Over all sites where land-use change occurred, the average deviation between the simulated and measured values of percentage change in soil C was less than the experimental error (11% simulation error, 53% measurement error). This suggests that the uncertainty in using this model for the national-scale simulations will be ~11%. Note that this excludes any additional uncertainty due to uncertainty in the national database values used to drive the model. Only a small bias in the simulations was observed compared to the measured values, suggesting that a small underestimate of the change in soil C should be expected at a national scale (–4%). Acknowledgements. This work was funded by the Rural and Environment Research and Analysis Directorate of the Scottish Government, Science Policy and Co-ordination Division, and the Welsh Assembly Government. P.S. is a Royal SocietyWolfson Research Merit Award holder. Rothamsted Research is an institute of the Biological and Biological Sciences Research Council. A.W. and K.C. acknowledge support from the Institute Strategic Programme Grants on Bioenergy and
Climate Change and the Cross Institute Programme on Sustainable Soil function (SoilCIP). P.F. was supported by the Joint DECC and Defra Integrated Climate Programme (DECC/Defra GA01101), and the EU Sixth Framework Programme (Global Change and Ecosystems sub-programme) project CarboNorth (project no. 036993).
LITERATURE CITED
➤ Addiscott ➤ ➤
➤
➤ ➤
➤
➤ ➤
➤
➤ ➤
➤
TM, Whitmore AP (1991) Simulation of solute leaching in soils of differing permeabilities. Soil Use Manag 7:94–102 Aguilar L, Thibodeaux LJ (2005) Kinetics of peat soil dissolved organic carbon release from bed sediment to water. I. Laboratory simulation. Chemosphere 58:1309–1318 Bardgett RD, McAlister E (1999) The measurement of soil fungal: bacterial biomass ratios as an indicator of ecosystem self-regulation in temperate meadow grasslands. Biol Fertil Soils 29:282–290 Batjes NH (2009) Harmonized soil profile data for applications at global and continental scales: updates to the WISE database. Soil Use Manag 25:124–127 Beven K (2002) Towards a coherent philosophy for modelling the environment. Proc R Soc Lond A 458:2465–2484. Bradbury NJ, Whitmore AP, Hart PBS, Jenkinson DS (1993) Modelling the fate of nitrogen in crop and soil in the years following application of 15N-labelled fertilizer to winter wheat. J Agric Sci 121:363–379 Clymo RS (1992) Models of peat growth. Suo 43:127–136 Coleman K, Jenkinson DS (1996) RothC-26.3. A model for the turnover of carbon in soil. In: Powlson DS, Smith P, Smith JU (eds) Evaluation of soil organic matter models using existing long-term datasets. NATO ASI Series I, Vol 38. Springer, Berlin, p 237–246 Ejrnæs R, Liira J, Poulsen RS, Nygaard B (2008) When has an abandoned field become a semi-natural grassland or heathland? Environ Manag 42:707–716 Ellert BH, Janzen HH, McConkey BG (1995) Measuring and comparing soil carbon storage. In: Lal R, Kimble JM, Follet RF, Stewart BA (eds) Assessment methods for soil carbon. Lewis Publishers, Boca Raton, FL, p 131–146 Falloon P, Smith P, Coleman K, Marshall S (1998) Estimating the size of the inert organic matter pool for use in the Rothamsted carbon model. Soil Biol Biochem 30:1207–1211 Falloon P, Smith P, Bradley RI, Milne R and others (2006) RothCUK — a dynamic modelling system for estimating changes in soil C at 1-km scale in the UK. Soil Use Manag 22:274–288 Freeman C, Lock MA, Reynolds B (1993) Fluxes of CO2, CH4 and N2O from a Welsh peatland following simulation of water table draw-down: potential feedback to climatic change. Biogeochemistry 19:51–60 Garcia JL, Patel BKC, Ollivier B (2000) Taxonomic, phylogenetic, and ecological diversity of methanogenic Archae. Anaerobe 6:205–226 Gorham E (1991) Northern peatlands: role in the carbon budget and probable responses to global warming. Ecol Appl 1:182–195 Gottschalk P, Bellarby J, Chenu C, Foereid B and others (2009) Simulation of soil organic carbon response at forest cultivation sequences using 13C measurements. Org Geochem 41:41–54 Guo LB, Gifford RM (2002) Soil carbon stocks and land use change: a meta analysis. Glob Change Biol 8:345–360 Hall DG, Reeve MJ, Thomasson AJ, Wright VF (1977) Water retention, porosity and density of field soils. Technical
192
➤
➤
➤ ➤
➤ ➤
➤
Clim Res 45: 179–192, 2010
Monograph No. 9. Soil Survey of England and Wales, Harpenden, p 32–42 Hargreaves KJ, Milne R, Cannell MGR (2003) Carbon balance of afforested peatland in Scotland. Forestry 76: 299–317 IPCC (2007) Climate change 2007: the physical science basis. In: Solomon S, Qin D, Manning M, Chen Z and others (Eds) Contribution of Working Group I to the Fourth Assessment Report of the Intergovernmental Panel on Climate Change. Cambridge University Press, Cambridge Jenkinson DS, Rayner JH (1977) The turnover of organic matter in some of the Rothamsted classical experiments. Soil Sci 123:298–305 Jenkinson DS, Hart PBS, Rayner JH, Parry LC (1987) Modelling the turnover of organic matter in long-term experiments at Rothamsted. INTECOL Bull 15:1–8 Joosten H (2009) The IMCG global peatland database. International Mire Conservation Group, available at www. imcg.net/gpd/gpd.htm Kettunen A (2003) Connecting methane fluxes to vegetation cover and water table fluctuations at microsite level: a modelling study. Global Biogeochem Cycles 17:1051 doi: 10.1029/2002BG001958 Lal R (2004) Soil carbon sequestration impacts on global climate change and food security. Science 304:1623–1627 Leifeld J, Zimmermann M, Fuhre J (2008) Simulating decomposition of labile soil organic carbon: effects of pH. Soil Biol Biochem 40:2948–2951 Lilly A, Towers W, Malcolm A, Paterson E (2004) Report on a workshop on the development of a Scottish Soils Knowledge and Information Base (SSKIB). Proceedings of a Workshop, Macaulay Institute, 22 Sep 2004. Macaulay Land Use Research Institute, Aberdeen, available at www.macaulay.ac. uk/workshop/SSKIB/SSKIBWorkshop_Report.pdf Lilly A, Bell JS, Hudson G, Nolan AJ, Towers W (2009) National Soil Inventory of Scotland 1 (NSIS_1): site location, sampling and profile description protocols (1978– 1988). Technical Bulletin, Macaulay Land Use Research Institute, Aberdeen Lindsay RA, Riggall J, Burd F (1985) The use of small-scale surface patterns in the classification of British peatlands. Aquilo Ser Bot 21:69–79 Loague K, Green RE (1991) Statistical and graphical methods for evaluating solute transport models: overview and application. J Contam Hydrol 7:51–73 Parton WJ, Mosier AR, Ojima DS, Valentine DW, Schimel DS, Weier K, Kulmala AE (1996) Generalized model for N2 and N2O production from nitrification and denitrification. Global Biogeochem Cycles 10:401–412 Reynolds B (2007) Implications of changing from grazed or semi-natural vegetation to forestry for carbon stores and fluxes in upland organo-mineral soils in the UK. Hydrol Earth Syst Sci 11:61–76 Saffigna PG, Philips IR (2006) Fertilizers: leaching losses. In: Lal R (ed) Encyclopaedia of soil science, 2nd edn, Vol 1. CRC Press, Boca Raton, FL, p 688–690 Scottish Government (2010) Scotland’s Action to tackle climate change. Available at www.scotland.gov.uk/Topics/ Environment/climatechange Smith J, Gottschalk P, Bellarby J, Richards M and others (2010) Model to Estimate Carbon in Organic Soils — Sequestration and Emissions (ECOSSE). User manual. Scottish Executive, Edinburgh, available at https://www. abdn.ac.uk/staffpages/uploads/soi450/ECOSSE%20User% Submitted: February 3, 2010; Accepted: June 30, 2010
➤
➤
➤
➤
➤
➤
➤
➤
20manual%20310810.pdf Smith JU, Smith P (2007) Environmental modelling. An introduction. Oxford University Press, Oxford Smith JU, Bradbury NJ, Addiscott TM (1996a) SUNDIAL: a PC-based system for simulating nitrogen dynamics in arable land. Agron J 88:38–43 Smith JU, Smith P, Addiscott TM (1996b) Quantitative methods to evalutate and compare soil organic matter (SOM) models. In: Powlson DS, Smith P, Smith JU (eds) Evaluation of soil organic matter models using existing long-term datasets. NATO ASI Series I, Vol 38. Springer-Verlag, Heidelberg, p 181–200 Smith JU, Smith P, Wattenbach M, Zaehle S and others (2005) Projected changes in mineral soil carbon of European croplands and grasslands, 1990–2080. Glob Change Biol 11:2141–2152 Smith P (2001) Soil organic matter modeling. In: Lal R (ed) Encyclopedia of soil science. Marcel Dekker, New York, NY, p 1–8 Smith P, Smith JU, Powlson DS, McGill WB and others (1997) A comparison of the performance of nine soil organic matter models using seven long-term experimental datasets. In: Smith P, Powlson DS, Smith JU, Elliott ET (eds) Evaluation and comparison of soil organic matter models using datasets from seven long-term experiments. Geoderma 81:153–225 Smith P, Smith J, Flynn H, Killham K and others (2007) ECOSSE: Estimating Carbon in Organic Soils — Sequestration and Emissions. Scottish Executive, Edinburgh Turunen J, Tomppo E, Tolonen K, Reinikainen A (2002) Estimating carbon accumulation rates of undrained mires in Finland: application to boreal and subarctic regions. Holocene 12:69–80 Turunen J, Roulet NT, Moore TR, Richard PJH (2004) Nitrogen deposition and increased carbon accumulation in ombrotrophic peatlands in eastern Canada. Global Biogeochem Cycles 18:GB3002 doi:10.1029/2003GB002154 UK Government (2010) Climate change. Available at www.direct.gov.uk/en/Environmentandgreenerliving/The widerenvironment/Climatechange/index.htm Vitt DH, Halsey LA, Bauer IE, Campbell C (2000) Spatial and temporal trends in carbon storage of peatlands of continental western Canada through the Holocene. Can J Earth Sci 37:683–693 Walse C, Berg B, Svedrup H (1998) Review and synthesis of experimental data on organic matter decomposition with respect to the effects of temperature, moisture, and acidity. Environ Rev 6:25–40 Wang ZP, Lindau CW, Delaune RD, Patrick WH (1993) Methane emissions and entrapment in flooded rice soils as affected by soil properties. Biol Fertil Soils 16:163–168 Welsh Assembly Government (2010) Climate change strategy for Wales. http://wales.gov.uk/topics/environmentcountry side/climatechange/tacklingchange/strategy/walesstrategy/ ?lang=en West TO, Post WM (2002) Soil organic carbon sequestration rates by tillage and crop rotation: a global data analysis. Soil Sci Soc Am J 66:1930–1946 Whitmore AP (1991) A method for assessing goodness of computer simulations of soil processes. J Soil Sci 42:289–299 Zerva A, Ball T, Smith KA, Mencuccini M (2005) Soil carbon dynamics in a Sitka sprice (Picea sitchensis (Bong.) Carr.) chronosequence on a peaty gley. For Ecol Manag 205: 227–240 Proofs received from author(s): November 1, 2010