Jul 27, 2011 - DELIVERED TO. 151 COUNTRIES. AUTHORS AMONG. TOP 1%. MOST CITED ..... Canadian Journal of Remote Sensing 19: 152-. 159.
17 Estimating Nonharvested Crop Residue Cover Dynamics Using Remote Sensing V.P. Obade1, D.E. Clay1, C.G. Carlson1, K. Dalsted1, B. Wylie2, C. Ren1 and S.A. Clay1 2United
1South Dakota State University States Geological Survey (EROS), Sioux Falls United States of America
1. Introduction Non harvested above and below ground carbon must be continuously replaced to maintain the soil resilience and adaptability. The soil organic carbon (SOC) maintenance requirement is the amount of non-harvested carbon (NHC) that must be added to maintain the SOC content at the current level (NHCm) (Mamani-Pati et al., 2010; Mamani-Pati et al., 2009). To understand the maintenance concept a basic understanding of the carbon cycle is needed (Mamani-Pati et al., 2009). The carbon cycle is driven by photosynthesis that produces organic biomass which when returned to soil can either be respired by the soil biota or contribute to the SOC. The rates that non-harvested biomass is converted from fresh biomass to SOC and SOC is converted to CO2 are functions of many factors including, management, climate, and biomass composition. First order rate mineralization constants for nonharvested carbon (kNHC) and SOC (kSOC) can be used to calculate half lives and residence times. Carbon turnover calculations are based on two equations, dSOC = k NHC [NHC a − NHC m ] dt
(1)
kSOC × SOCe = kNHC × NHCm
(2)
In these equations, SOC is soil organic C, NHCa is the non-harvested carbon returned to soil, NHCm is the nonharvested carbon maintenance requirement, ksoc is the first order rate constant for the conversion of SOC to CO2, and kNHC is the first order rate constant for the conversion of NHC to SOC (Clay et al., 2006). These equations state that the temporal change in SOC (dSOC/dt) is equal to the non-harvested carbon mineralization rate constant (kNHC) times the difference between the amounts of carbon added to the soil (NHCa) and the maintenance requirement (NHCm) and that at the SOC equilibrium point (SOCe), the rate that non-harvested C (NHC) is converted into SOC (kNHC × NHCm) is equal to the rate that SOC is mineralized into CO2 (kSOC × SOCe). Through algebraic manipulation, these equations can be combined to produce the equation, NHC a k SOC dSOC 1 = + SOC e k NHC dt k NHC × SOC e
www.intechopen.com
(3)
326
Progress in Biomass and Bioenergy Production
When fit to a zero order equation, the y-intercept and slopes are
k SOC 1 , and k NHC × SOCe k NHC
respectively. Based on this equation, NHCm, kNHC, and kSOC can be calculated using the equations, NHCm = b × SOCe; kNHC = 1/ (m × SOCe); and kSOC = b/(m × SOCe). This approach assumed that above and below ground biomass make equal contributions to SOC; that the amount of below ground biomass is known; and NHC is known and that initial (SOCe) and final (SOCfinal) SOC values are near the equilibrium point. Advantages with this approach are that kSOC and kNHC are calculated directly from the data and the assumptions needed for these calculations can be tested. A disadvantage with this solution is that surface and subsurface NHC must be measured or estimated. Remote sensing may provide the information needed to calculate surface NHC, through estimating the spatial variation of crop residues which are a major source of NHC. Traditionally crop residue cover estimates have relied on visual estimation through road side surveys, line-point transect or photographic methods (CTIC, 2004; McNairn and Protz, 1993; Serbin et al., 2009 a). However, such ground-based survey methods tend to be timeconsuming and expensive and therefore are inadequate for crop residue quantification over large areas (Daughtry et al., 2005; Daughtry et al., 2006). The need to improve these estimates has prompted much research on the extraction of surface residue information from aerial and satellite remote sensing (Bannari et al., 2006; Daughtry et al., 2005; Gelder et al., 2009; Serbin et al., 2009 a & b; Thoma et al., 2004). Previous research has shown crop residues may lack the unique spectral signature of actively growing green vegetation making the discrimination between crop residues and soils difficult (Daughtry et al., 2005). Daughtry and Hunt (2008) reported that dry plant materials have their greatest effect in the short wave infra-red (SWIR) region between 2000 and 2400 nm related to the concentration of ligno-cellulose in dry plant residue. Other studies have proposed the Cellulose Absorption Index (CAI), the Lignin Cellulose Absorption index (LCA) and the Shortwave Infrared Normalized Difference Residue Index (SINDRI) for estimating field residue coverage (Daughtry et al., 2005; Daughtry et al., 2006; Thoma et al., 2004; Serbin et al., 2009 c). However, neither CAI, LCA nor SINDRI are currently practical for use in spaceborne platforms (Serbin et al., 2009 a). For example, EO-1 Hyperion which was sensitive to the spectral ranges of CAI and LCA (2100 and 2300 nm wavelengths), is past its planned operational lifetime and suffers bad detector lines (USGS, 2007), while the shortwave infrared (SWIR) detector for ASTER satellite failed in April, 2008 (NASA, 2010; Serbin et al., 2009 c). Therefore, indices that utilize the multispectral wavelength ranges (450-1750 nm) appear to be the most viable economical alternative. The objective of this research was to assess if remote sensing can be used to evaluate surface crop residue cover, and the amount of nonharvested biomass returned to soil.
2. Materials and methods 2.1 Study area A randomized block field experiment was conducted in South Dakota (SD) in the years 2009 and 2010. The coordinates at the site were 44˚ 32'07"North and 97˚ 22' 08"West. Soil at the site was a fine-loamy, mixed, superactive, frigid typic calciudoll (Buse). The treatments considered were residue removed (baled) or returned (not baled) with each treatment
www.intechopen.com
Estimating Nonharvested Crop Residue Cover Dynamics Using Remote Sensing
327
replicated 36 times. The field was chisel plowed and corn was seeded at the site during the first week of May in 2009 and 2010. The row spacing was 76 cm and the population was 80,000 plants per hectare. Following physiological maturity in October, grain and stover yields were measured. In all plots corn residue was chopped after harvesting. In residue removal plots, stover was baled, and removed. The amount of residue remaining after baling was measured in at 16 locations that were 0.5806 m2 in size. For these measurements, the stover was collected, dried, and weighed. Approximately 56% (±0.08) of the corn residue was removed by this process. Following residue removal, soil surface coverage was measured using the approach by Wallenhaupt (1993) on 27th November 2009 and 13th November 2010. 2.2 Field measurements and model development Spectral reflectance measurements of corn residues were collected with a Cropscan handheld multispectral radiometer (Cropscan Inc., Rochester, Minnesota) under clear sky conditions between 10 a.m. and 3 p.m. for all the field sites on 28th November 2009 and 13th November 2010. The Cropscan radiometer measures incoming and reflected light simultaneously. It measures within the following band widths, 440-530 (blue), 520-600 (green), 630-690 (red), 760-900 (near infra red, NIR), 1550-1750 (mid infra red, MIR), for wide (W) bands, and 506-514, 563-573, 505-515, 654-666, 704-716, 755-765, 804-816, 834-846, 867-876, 900-910, 1043-4053 nanometer (nm) for narrow wavelength bands. The Cropscan radiometer was set at a height of 2 m above ground, so as to approximate a 1 m2 spatial resolution on the ground. The Cropscan was calibrated by taking five spectral radiance readings on a standard reflectance, white polyester tarp, before beginning the scanning and after the whole field had been scanned. Scanning errors were minimized by following the protocols as reported by Chang et al. (2005). For calculations it is assumed that the irradiance flux density at the top of the radiometer is identical to the target. Reflectance data were corrected for temperature and incident light angles, relative to top of the sensor. Based on measured reflectance information, four wide reflectance bands and four indices derived from the wide spectral bands were calculated (Table 1). Vegetation Index
Equation (modified)
Reference
Normalized Difference Vegetation Index (NDVIw)
NDVIw= (R830-R660)/(R830+R660)
Rouse et al. 1974
Green Normalized Difference Vegetation Indexw (GNDVIw)
GNDVIw = (R830-R560)/(R830+R560)
Daughtry et al. 2000 Gitelson and Merzlyak 1996
Normalized Difference Water Index (NDWIw)
NDWIw= (R830-R1650/(R830+R1650)
Gao 1996
Blue Normalized Difference Vegetation Index (BNDVIw)
BNDVIw= (R830-R485)/(R830+R485)
Hancock and Dougherty 2007
Table 1. Spectral band combinations (indices)
www.intechopen.com
328
Progress in Biomass and Bioenergy Production
2.3 Statistical analysis Proc Mixed available within the Statistical Analysis System (SAS Institute, North Carolina) software, was used to determine reflectance differences in the residue removed and returned plots. Correlation (r) coefficients between reflectance values and weights of stover returned and % surface residue cover were determined. Finally, graphs of percent residue cover versus spectral band and index for the models with the highest correlations were compared.
3. Results and discussion In 2009, 28.8 % of the soil was covered with residue in the removed (baled) plots, while in 2010, 54% of the soil was covered with residue (Table 2). In the residue returned (not baled) plots, the surface cover was 100 and 70%, in 2009 and 2010, respectively. The residue removal plots (28.8% cover) in 2009 had the lowest reflectance in the green, red, and NIR bands, while the residue returned plots in 2010 had the highest reflectance in the green, red, NIR, and MIR bands. These results imply that corn residues have a relative high albedo, compared to soil. Slightly different results would be expected in soybean (Glycine max) where Chang et al. (2004) did not detect reflectance differences between bare and soybean residue covered soil. Year
Residue
2009 2009 2010 2010 p-value
Removed Returned Removed Returned
2009 2010 p-value
Percent Weight Blue W. Green W. Red W. NIR W. MIR W. NDVIw GNDVIw BNDVIw NDWIw Cover Mg/ha 28.8 d 100 a 54.2 c 70.0 b 0.0001
3.7a 7.1b 2.7c 5.5d 0.001
4.60 c 7.72 a 6.60 b 7.18 a 0.0001
6.50 c 11.10 ab 11.22 b 12.28 a 0.0001
64.4 62.1 0.464
10.9 7.1 0.001
6.2 6.9 0.14
8.77 11.75 0.0010
8.84 c 13.75 d 15.60 b 23.05 c 16.53 b 26.6 b 18.16 a 28.91 a 0.0001 0.0001
19.50 b 24.02 a 26.61 a 27.30 a 0.0005
0.22b 0.20c 0.24a 0.23ab 0.0001
0.36b 0.35c 0.41a 0.41a 0.0047
0.50b 0.50b 0.60a 0.60a 0.1691
-0.0035b 0.026a -0.15c 0.02ab 0.0001
12.2 17.3 0.0002
21.76 26.96 0.0368
0.21b 0.23a 0.013
0.36 0.41 0.0001
0.50 0.60 0.0001
-0.08 0.011 0.0003
18.4 27.74 0.0001
*Values within a column that have different letters are significantly different at the 0.05 probability level.
Table 2. Variation in residue cover over several wavelengths reflected from corn residues on the ground near Badger site, SD in the years 2009 and 2010. Blue Residue returned (ton/ha) 0.39 % residue cover 0.61 NDVIw Residue returned (ton/ha) -0.35 % residue cover -0.34
Green 0.30 0.56 GNDVIw -0.24 -0.15
Red r 0.27 0.53 NDWIw 0.35 0.47
NIR
MIR
0.22 0.48 BNDVIw -0.19 0.01
0.002 0.24
Table 3. The correlation between the amounts of residue returned in 2009 and 2010 to the soil and the ground cover with surface reflectance. r values greater than 0.174 are significant at the 0.05 level.
www.intechopen.com
Estimating Nonharvested Crop Residue Cover Dynamics Using Remote Sensing
329
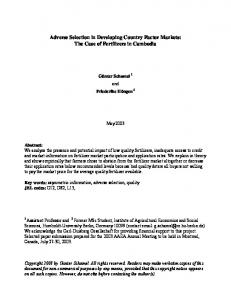
The correlation coefficient between the residue returned in ton/ha and percent residue cover with surface reflectance are shown in Table 3. The correlation coefficients between residue returned and reflectance ranged from 0.002 in the MIR band to 0.39 in the blue band. For the % surface residue cover, higher r values were observed. These results suggest that surface reflectance measurements were better at predicting the crop residue coverage than residue amount. The highest r value between % ground cover and reflectance was observed for the blue band. The different bands previously have been reported for different uses (http://landsat.usgs.gov/best_spectral_bands_to_use.php). The blue band is useful for distinguishing soil from vegetation, while green is useful for assessing plant vigor. The NIR (770-900 nm) and short-wave infrared (1550 – 1750 nm) discriminates biomass content from soil moisture content. Although blue has a high correlation with surface residue cover, atmospheric scattering may reduce its suitability for space-based sensors (Lillesand and Kiefer, 2000; Wang et al., 2010). The amount of residue retained on the soil was correlated to NDVI, GNDVI, and NDWI, while the percent coverage was correlated to NDVI and NDWI. Of the indices determined, NDWIw had the highest r value with percent residue cover followed by NDVIw, GNDVIw, and BNDVIw respectively. It is important to note, that the results are limited by the boundary conditions of the experiment. Although only the percent residue cover and residue weights versus the reflectance were analyzed, other factors such as soil cover, color or moisture could have impacted the reflectance values (Barnes et al. 2003; Daughtry et al., 2005; Daughtry et al., 2006; Pacheco and McNairn, 2010; Thoma et al., 2004). A comparison of the reflectance data across years for the blue band suggests that a zero order equation (y = 4.31 + 0.036x; r2 = 0.38) could explain the relationship between reflectance and surface coverage (Fig. 1). Slightly different results were observed for the NDWIw indices where a second order quadratic equation (y = -0.22 + 0.005x – 0.0000263 x2; R2 = 0.26) was used to describe the relationship with surface coverage. The graph of % residue cover versus NDWIw flattens after the 60 % residue cover which implies that NDWIw may saturate with increasing coverage. A limitation of this study is that only one site was analyzed, therefore any models generated would be suitable for the specific site and only after fall harvest. Other errors can occur when extrapolating plot measurements data to the whole field coverage. In future, research that confirms the finding for other sites and harvesting approach needs to be conducted.
4. Conclusion The main objective of this study was to investigate the potential of remote sensing to assess residue coverage. The research showed that surface reflectance was more closely correlated with percent cover than the amount of residue returned. Of the spectral band widths measured, reflectance in the blue range provided the most consistent results across the two years. NDWIw had a higher correlation with residue returned and % cover than NDVIw, GNDVIw, or BNDVIw. Future studies should not only consider more field sites, but incorporate factors such as the decomposition rates of residues on spectral reflectance and harvesting approaches (see Daughtry et al. 2010), so as to develop an accurate and standard approach for mapping residue cover in real time over large geographic areas.
www.intechopen.com
330
Progress in Biomass and Bioenergy Production
% Blue reflectance
14 2009 2010
12 10 8 6 4 2 0
20
40
60
80
100
120
80
100
120
% cover 0.3 0.2
NDWI
0.1 0.0 -0.1 -0.2 -0.3 -0.4 0
20
40
60
% cover Fig. 1. Percent residue cover versus spectral bands (top) and NDWIw index (below)
5. Acknowledgements Funding for this project was provided by NASA, South Dakota Corn Utilization Council, SD 2010 initiative, SD Soybean Research and Promotion Council.
6. References Bannari, A., Pacheco A., Staenz, K., McNairn, H., Omari, K. 2006. Estimating and mapping crop residue cover on agricultural lands using hyperspectral and IKONOS data. Remote Sensing of Environment 104: 447-459. Barnes, E. M., Sudduth, K.A., Hummel, J. W., Lesch, S. M., Corwin, D. L., Yang, C., Daughtry, C.T. and Bausch, W. C. 2003. Remote- and ground-based sensor techniques to map soil properties. Photogrammetric Engineering & Remote Sensing. Vol. 69, No. 6: 619–630. Chang J., Clay S., Clay D., Aaron D., Helder D., Dalsted K. 2005. 'Clouds influence precision and accuracy of ground-based spectroradiometers'. Communications in Soil Science and Plant Analysis 36: 1799-1807.
www.intechopen.com
Estimating Nonharvested Crop Residue Cover Dynamics Using Remote Sensing
331
Chang, J., Clay, S.A.and Clay, D.E. 2004. Detecting weed free and weed infested areas of a soybean (Glycine max) field using NIR reflectance data. Weed Sci. 52:642-648. Clay, D.E., C.G. Carlson, S.A. Clay, C. Reese, Z. Liu, and M.M. Ellsbury. 2006. Theoretical Derivation of New Stable and Non-isotopic Approaches for Assessing Soil Organic C Turnover. Agron. J. 98:443-450. CTIC. 2004. National survey of conservation tillage practices. Conservation Technology Information Center, CTIC, West Lafayette, IN. http://ctic.purdue.edu/ctic.html (accessed on 26th September 2009). Daughtry, C. T., Doraiswamy, P. C., Hunt Jr., E. R., Stern, A.J., McMurtrey, J. E., Prueger, J.H. 2006. Remote Sensing of crop residue cover and soil tillage intensity. Soil and Tillage Research 91: 101-108. Daughtry, C. T., Hunt Jr., E. R, Doraiswamy, P. C., McMurtrey, J. E. 2005. Remote sensing the spatial distribution of crop residues. Agronomy Journal 97: 864–871. Daughtry, C. T., Hunt Jr., E.R. 2008. Mitigating the effects of soil and residue water contents on remotely sensed estimates of crop residue cover. Remote Sensing of Environment 112: 1647-1657. Daughtry, C. T., Serbin, G., Reeves III, J. B., Doraiswamy, P. C., Hunt Jr., E.R. 2010. Spectral reflectance of wheat residue during decomposition and remotely sensed estimates of residue cover. Remote Sensing 2: 416-431. Daughtry, C. T., Walthall, C.L., Kim, M.S., Brown de Colstoun, E., McMurtrey, J.E. 2000. Estimating corn leaf chlorophyll concentration from leaf and canopy reflectance. Remote Sensing of Environment 74: 229–239. Gao, B.C. 1996. NDWI—a normalized difference water index for remote sensing of vegetation liquid water from space. Remote Sensing of Environment 58: 257–266. Gelder, B. K., Kaleita, A. L., Cruse, R. M. 2009. Estimating mean field residue cover on midwestern soils using satellite imagery. Agronomy Journal 101: 635–643. Gitelson, A., Merzlyak, M. 1996. Signature analysis of leaf reflectance spectra: algorithm development for remote sensing of chlorophyll. J. Plant Physiol. 148: 494-500. Hancock, D.W., Dougherty, C.T. 2007. Relationships between blue- and red-based vegetation indices and leaf area and yield of alfalfa. Crop Science 47: 2547-2556. Lillesand, T., and Kiefer, R. 2000. Remote Sensing and Image Interpretation. New York: John Wiley and Sons, Inc. ISBN 0-471-25515-7. Mamani-Pati, F., D.E. Clay, C.G. Carlson, S.A. Clay, G. Reicks, and K. Kim. 2010. Nitrogen Rate, Landscape Position, and Harvest Corn Stover Impacts on Energy Gains and carbon budgets of Corn Grown in South Dakota. Agron. J. 102:1535-1541. Mamani Pati, E.M., D.E. Clay, C.G. Carlson, and S.A. Clay. 2009. Calculating soil organic carbon maintenance using stable and isotopic approaches: A review. P. 189-216. In E. Lichtfouse (ed.). Sustainable Agricultural Reviews: Sociology, Organic Farming, Climate Change and Soil Science, Springer. McNairn, H., Protz, R. 1993. Mapping corn residue cover on agricultural fields in Oxford county, Ontario, using thematic mapper. Canadian Journal of Remote Sensing 19: 152159. NASA 2010. NASA jet propulsion laboratory SWIR-ASTER user advisory. http://asterweb.jpl.nasa.gov/swir-alert.asp (accessed online 14th August, 2010)
www.intechopen.com
332
Progress in Biomass and Bioenergy Production
Pacheco, A. and McNairn, H. 2010. Evaluating multispectral remote sensing and spectral unmixing analysis for crop residue mapping, Remote Sensing of Environment, 114: 2219-2228. Rouse, J., Haas, R., Schell, J., Deering, D., and Harlan, J.C. 1974. Monitoring the vernal advancements and retrogradation of natural vegetation. NASA/GSFC, Greenbelt, MD. Serbin G., Craig T., Daughtry C.S.T., Hunt Jr., E. R., Brown, D.I., McCarty, G.W. 2009a. Effect of soil spectral properties on remote sensing of crop residue cover. Soil Science of America Journal 73: 1545-1558. Serbin G., Daughtry, C.S.T., Hunt Jr., R., Reeves J., Brown D.I. 2009b. Effect of soil composition and mineralogy on remote sensing of crop residue cover. Remote Sensing of Environment 113: 224-238. Serbin, G., Hunt Jr., E. R., Daughtry, C.S.T., McCarty, G. W., Doraiswamy P. C. 2009c. An improved ASTER index for remote sensing of crop residue. Remote Sensing 2009 1: 971-991. Thoma, D., Gupta, C., Bauer, E. 2004. Evaluation of optical remote sensing models for crop residue cover assessment. Journal of Soil and Water Conservation 59: 224-233. USGS. 2007. Earth Observing 1 (EO-1), Sensors-Hyperion. eo1.usgs.gov/hyperion.php (Accessed 30th May, 2010). EROS data center, USGS, Sioux Falls, SD. Wang Y., Lyapustin, A. I., Privette, J. L., Cook, R. B., SanthanaVannan, S. K., Vermote, E. F., Schaaf, C.L. 2010. Assessment of biases in MODIS surface reflectance due to Lambertian approximation. Remote Sensing of Environment 114: 2791–2801. Wollenhaupt, N. 1993. Estimating residue : line transect method. G1570. MU Extension. Available at http://extension.missouri.edu/publications/DisplayPub.aspx?P=G1570
www.intechopen.com
Progress in Biomass and Bioenergy Production Edited by Dr. Shahid Shaukat
ISBN 978-953-307-491-7 Hard cover, 444 pages Publisher InTech
Published online 27, July, 2011
Published in print edition July, 2011 Alternative energy sources have become a hot topic in recent years. The supply of fossil fuel, which provides about 95 percent of total energy demand today, will eventually run out in a few decades. By contrast, biomass and biofuel have the potential to become one of the major global primary energy source along with other alternate energy sources in the years to come. A wide variety of biomass conversion options with different performance characteristics exists. The goal of this book is to provide the readers with current state of art about biomass and bioenergy production and some other environmental technologies such as Wastewater treatment, Biosorption and Bio-economics. Organized around providing recent methodology, current state of modelling and techniques of parameter estimation in gasification process are presented at length. As such, this volume can be used by undergraduate and graduate students as a reference book and by the researchers and environmental engineers for reviewing the current state of knowledge on biomass and bioenergy production, biosorption and wastewater treatment.
How to reference
In order to correctly reference this scholarly work, feel free to copy and paste the following: David Clay (2011). The Principles and Applications of Using Remote Sensing for Assessing Biomass and Carbon Sequestration, Progress in Biomass and Bioenergy Production, Dr. Shahid Shaukat (Ed.), ISBN: 978953-307-491-7, InTech, Available from: http://www.intechopen.com/books/progress-in-biomass-andbioenergy-production/estimating-nonharvested-crop-residue-cover-dynamics-using-remote-sensing
InTech Europe
University Campus STeP Ri Slavka Krautzeka 83/A 51000 Rijeka, Croatia Phone: +385 (51) 770 447 Fax: +385 (51) 686 166 www.intechopen.com
InTech China
Unit 405, Office Block, Hotel Equatorial Shanghai No.65, Yan An Road (West), Shanghai, 200040, China Phone: +86-21-62489820 Fax: +86-21-62489821