Abstract A model describing the respiration curves of glucose-amended soils was applied to the characteriza- tion of microbial biomass. Both lag and ...
Biol Fertil Soils (2000) 32 : 73–81
Q Springer-Verlag 2000
ORIGINAL PAPER
Sergey A. Blagodatsky 7 Otto Heinemeyer Jörg Richter
Estimating the active and total soil microbial biomass by kinetic respiration analysis
Received: 19 July 1999
Abstract A model describing the respiration curves of glucose-amended soils was applied to the characterization of microbial biomass. Both lag and exponential growth phases were simulated. Fitted parameters were used for the determination of the growing and sustaining fractions of the microbial biomass as well as its specific growth rate (mmax). These microbial biomass characteristics were measured periodically in a loamy silt and a sandy loam soil incubated under laboratory conditions. Less than 1% of the biomass oxidizing glucose was able to grow immediately due to the chronic starvation of the microbial populations in situ. Glucose applied at a rate of 0.5 mg C g –1 increased that portion to 4–10%. Both soils showed similar dynamics with a peak in the growing biomass at day 3 after initial glucose amendment, while the total (sustaining plus growing) biomass was maximum at day 7. The microorganisms in the loamy silt soil showed a larger growth potential, with the growing biomass increasing 16-fold after glucose application compared to a sevenfold increase in the sandy loam soil. The results gained by the applied kinetic approach were compared to those obtained by the substrate-induced respiration (SIR) technique for soil microbial biomass estimation, and with results from a simple exponential model used to describe the growth response. SIR proved to be only suitable for soils that contain a sustaining microbial biomass and no growing
S.A. Blagodatsky (Y) Institute of Physico-chemical and Biological Problems in Soil Science, Russian Academy of Sciences, 142290 Pushchino, Russia e-mail: blag6issp.serpukhov.su O. Heinemeyer Institut für Agrarökologie, Bundesforschungsanstalt für Landwirtschaft, Bundesallee 50, 38116 Braunschweig, Germany J. Richter Institut für Geographie and Geoökologie, Technische Universität Carolo-Wilhelmina, Langer Kamp 19c, Postfach 3329, 38023 Braunschweig, Germany
microbial biomass. The exponential model was unsuitable for situations where a growing microbial biomass was associated with a sustaining biomass. The kinetic model tested in this study (Panikov and Sizova 1996) proved to describe all situations in a meaningful, quantitative and statistically reliable way. Key words Active microbial biomass 7 Substrate-induced respiration 7 Sustaining microbial biomass 7 Growth-response description
Introduction Only a small part of the total soil microbial biomass is recognized to be active under natural conditions (Gray 1976; van de Werf and Verstraete 1987a; Paul and Clark 1989). The most widely used methods for estimating microbial biomass in soils, such as chloroform fumigation incubation (CFI) (Jenkinson and Powlson 1976), chloroform fumigation extraction (Vance et al. 1987) or the substrate-induced respiration (SIR) technique (Anderson and Domsch 1978) determine the total soil biomass without distinguishing between active and inactive (“sustaining” according to Smith et al. 1986) components. The rate of ecologically important processes like organic matter decomposition and transformations of nutrient elements depends to a large extent on the active fraction of the microbial biomass. So, its quantification is desirable. Additionally, the active part of the total microbial biomass can be a good predictor for early changes in soil homeostasis, and can be used as an indicator of soil pollution (Nordgren et al. 1988). More then 10 years ago a method to determine the active soil microbial biomass based on the mathematical analysis of respiration curves (O2 consumption kinetics in glucose-amended soils) was suggested by van de Werf and Verstraete (1987a). The amount of viable (i.e. directly metabolizing a given substrate) microbial biomass (X0) was derived from best-fitted parameters
74
of a mathematical model (Monod 1942; Pirt 1975) that simulates microbial growth and O2 uptake. Two independent sets of experiments were needed for reliable assessment of all the model parameters. For the sake of simplicity, it was suggested that the average O2 consumption or CO2 production during a 10-h incubation (y¯10) should be measured for the routine determination of the active biomass (van de Werf and Verstraete 1987b). The active biomass can then readily be assessed from the linear relationship between X0 and y¯10 obtained with a regression equation. Unfortunately, due to this simplification the valuable information gained from other growth parameters (i.e. specific growth rate of microorganisms, mmax) is neglected. Schmidt and coauthors (Schmidt 1992; Colores et al. 1996) proposed a substrate-induced growth response method for the estimation of microbial biomass in soil, which is derived from the same basic principles as the approach by van der Werf and Verstraete (1987a). The model applied by Schmidt is simpler and describes the product formation (CO2 evolution) during the exponential phase of microbial growth in soil. Maintenance respiration was not considered in his model in any form (Schmidt 1992). Since their equation only works with growing populations, it was necessary to remove data points from the lag period and data points after the rate ceased to increase exponentially. Another model approach for estimating the biomass of functional microbial groups in soil was proposed recently by Panikov and Sizova (1996). Their model simulates both transition process of soil microorganisms from sustaining to the active state, i.e. lag phase and exponential phase of growth, due to the inclusion of the physiological state concept (Panikov 1995). With this model it is also possible to derive the amount of total microbial biomass from model parameters. This is in contrast to the approach of van de Werf and Verstraete (1987a) that requires an additional measurement for the estimation of total biomass. There is a lack of experimental data concerning the physiological state of microorganisms in soil. Most studies use direct microscopy or plate techniques (e.g. Söderström 1977), or indirect methods recording the rate of microbiological processes but not the biomass of active microorganisms. The kinetic method (Panikov and Sizova 1996) may give additional information about the dynamics of biomass and microbial activity in situ. However, this method has not been proven for soils with different amounts of biomass and for different environmental conditions. This paper presents data from laboratory experiments with two soils differing mainly in clay content and pH level. Microbial biomass and activity were estimated periodically by the kinetic approach (analysis of CO2 production curves) during 2-week incubations following initial glucose amendments. The objective of the present study was to verify the validity of the kinetic approach by comparing soils with different microbial activity due to glucose amendment. An additional aim
was refinement of the experimental procedure. Different substrate application techniques (dry/wet) were studied, and the effects of soil-storage duration and storage temperature, as well as the effects of the supplemental addition of mineral nutrients were investigated.
Materials and methods Soil sampling and storage Two soils, Timmerlah and FAL Schlag 1, were taken from the upper horizon (0–10 cm) of experimental plots within the BFAL (Federal Agriculture Research Center) near Braunschweig, Lower Saxony, Germany. Within 1 day of collection the samples were brought to the laboratory, sieved (~2 mm), and stored at 4 7C in aerated polyethylene bags or used immediately. The Timmerlah (loamy silt) and the FAL Schlag 1 (sandy loam) soil had the following, respective, characteristics: 6.3% and 42% sand, 83.5% and 52.6% silt, 10.2% and 5.4% clay, pHKCl 7.1 and 5.5, 0.94% and 0.85% total organic C content. A more detailed soil description can be found in Kaiser et al. (1992). Before the incubation experiments, the soils were conditioned by a 5 days’ storage at 22 7C. The kinetic method for biomass determination Theoretical background The amounts of growing and sustaining microbial biomass, which were capable of immediately metabolising added glucose, were determined by a kinetic method (Panikov and Sizova 1996). According to a synthetic chemostat model (SCM) (Panikov 1995) all macromolecular cell constituents can be divided into two groups: primary cell constituents absolutely necessary for growth (P-components) and components needed for cell survival under restricted growth (U-components). The characteristic examples of P-components are ribosomes, rRNA, ribosomal proteins, other RNA fractions and enzymes of the primary metabolic pathways. Their intracellular contents increase parallel to an increase in the growth rate. Contrary to P-components, the contribution of Ucomponents to the biomass decreases with an acceleration in growth. Examples are enzymes of secondary metabolism, protective pigments, reserve substances, transport systems of high substrate affinity etc. It is stated then (rule no. 1) that an increase in one individual P-component is accompanied by an increase in other P-components. The index of the physiological state, r, is defined by the ratio between the instantaneous quantity of any particular P-component and its total changeable part. r varies from 0 (when all P-components show minimal values) to 1.0 (when they attain maximal values). The second rule states that P- and Ucomponents complement each other, and the content of any Ucomponent should be proportional to 1–r. The adaptive variation of the cell composition and metabolic activity, which is determined by the intracellular content of particular enzymes, can now be expressed by one single “master” variable, r. It is possible to say that r indicates the ratio between the active and sustaining biomass. According to this concept, respiratory enzymes are divided into two groups with respect to both functional role and sensitivity to cyanides (Akimenko et al. 1983). Cyanide-sensitive oxidases carry out productive substrate oxidation coupled with ATP generation and cell growth, their activity being positively correlated with the growth rate and r value (P-components). Cyanideresistant alternative oxidases are constitutive cell components and carry out energy-spilling oxidative reactions uncoupled from ATP generation. Their probable physiological functions being the maintenance of the adenylate pool and the protection of cells from stresses caused by abrupt “famine-to-feast” transitions (Tempest and Neijssel 1984).
75 According to Panikov’s notation (Panikov and Sizova 1996), the specific respiration activity measured under excess of substrate is denoted as Q, and the cyanide-resistant fraction as Qb; then the productive fraction of the total respiration is equal to QPQb. Microbial growth in amended soil is described by the following set of differential equations (Eqs. 1, 2 and 3) based on postulated assumptions. Detailed descriptions of how these equations are derived can be found in original works (Panikov 1996; Panikov and Sizova 1996) and in our recent publication (Blagodatsky and Richter 1998). The change of CO2 production (p) with time is: dp p r (QPQb) xcQb x dt
(1),
where x is the concentration of microbial biomass per gram of soil. The first term on the right-hand side is respiration coupled with growth, and the second term is respiration uncoupled from growth. The dynamics of the biomass is described by: dx p YCO 2r (QPQb) xpmmax r x dt
(2),
where mmax is the specific growth rate of soil microorganisms, YCO 2 is biomass yield per unit CO2 respired. The dynamics of the r variable is: dr p mmax r (1Pr) dt
(3).
Equations 2 and 3 are integrated for initial conditions, i.e. xpx0 (microbial biomass in soil just before amendment) and rpr0 (index of microbial physiological state in situ) at tp0: xpx0 (1Pr0cr0 e m maxt) rpr0 [(1Pr0) e
Pm maxt
cr0]
(4), P1
(5).
The CO2 production rate, n (t), is derived as an explicit function of t after substitution of Eqs. 4 and 5 into Eq. 1: v (t)pAcBexp (mmax t)
(6)
where A (uncoupled respiration)p(1Pr0) Qb x0, B (coupled respiration)pr0!Q!x0, and mmaxpYCO 2 (QPQb). It is this equation which is used to fit the experimental data of CO2 production. From the ratio between A and B, r0, the so-called “physiological state index” at tp0 (before substrate addition) can be derived: r0 p
B (1Pl) AcB (1Pl)
(7),
where lp(Q-Qb)/Q and varies in a rather narrow range, as was shown after an extensive examination of diverse microbial isolates ( 1 100 species) (Akimenko et al 1983). So lp0.9 may be accepted as a basic stoichiometric constant. The total glucose metabolizing microbial biomass (sustaining plus growing) is given by: B x0 p r0 Q
(8),
where the total specific respiration activity Q is: Qp
mmax l YCO 2
Moist soil samples were amended with a glucose-talcum powder mixture and solutions of (NH4)2SO4 and KH2PO4. For the soils examined, 1.2 mg C g –1 soil, 0.04 mg N g –1 soil and 0.01125 mg P g –1 soil were added, respectively. Details of the substrate-application procedures are described in the section “Experimental design”. Preliminary experiments had shown that for the soils under study the amendments supply a suitable excess of substrate necessary for unlimited microbial growth, at least during the monitored lag and exponential phases. After substrate amendment, the soil samples were placed in triplicate into plastic tubes to measure the rate of CO2 production. Each sample was continuously purged with air (300 ml min –1) and evolved CO2 was measured every half hour using an infrared detector and a mass flow-meter (Heinemeyer et al. 1989). The data including air-flow rate, CO2 concentration, and SE of each measurement were stored by computer. Curve fitting and statistics The time course of CO2 production rate was approximated by the mathematical model (Eq. 6). Optimized parameter values were used to assess the physiological state of the microbial biomass (Eq. 7), to calculate the amounts of growing (Eq. 10) and total microbial biomass (Eq. 8). The parameters of Eq. 6, A, B, and mmax, as well as the parameters of the second model applied in this work (van de Werf and Verstraete 1987a) were identified using an optimization procedure of the commercially available ModelMaker program (Version 2.0c; SB Technology, Cherwell Scientific Publishing). By this procedure, the models were fitted to the measured CO2 production rate data and the SEs of the parameters of best fit were calculated. As criteria for goodnessof-fit we used the r 2 value, i.e. the fraction of the total variation explained by the model. To provide further evidence that the resultant differences between a model and data occurred by chance, we used the probability variable, Q. Low values of Q indicate that the model fails to describe the real process. Experimental design Determination of the influence of added nutrients on microbial growth Moist soil samples (Timmerlah) equivalent to 25 g oven-dry soil were amended with a powder mixture containing 75 mg glucose and 250 mg talcum (Anderson and Domsch 1978) to give a concentration of 1.2 mg C g –1 soil. One half of the samples were amended additionally with a solution of mineral salts containing 0.04 mg N g –1 soil as (NH4)2SO4, and 0.01125 mg P g –1 soil as KH2PO4. Determination of the optimal substrate application technique Three treatments were compared: (1) glucose-talcum mixture addition followed by mixing with a common handheld kitchen blender; (2) application of glucose and nutrient solution (as described above) added dropwise to the fine soil layer; and (3) injection of the substrate solution by syringe into the middle of the soil sample placed into a plastic tube ready for CO2 estimation.
(9), Estimation of microbial biomass at different states of activity
Biomass yield per unit CO2 (YCO 2) is assumed to be constant during the experiment and equals 1.5, corresponding to a mean value of 0.6 for the microbial C yield per unit of glucose-C consumed (Payne 1970). The growing microbial biomass at tp0 (less than the total biomass), is given by: x0px07r0
Experimental procedures
(10).
To achieve different states of microbial activity, samples from both soils (25 g, oven-dry basis) were initially amended with glucose-talcum powder at a rate of 0.5 mg C g –1 soil and incubated for either 3, 7, or 10 days. Immediately after these preincubations, the microbial biomass status achieved was measured by the kinetic method using a second glucose amendment (1.2 mg C g –1 soil)
76 and an NPK amendment. Samples receiving no initial glucose amendment were used as controls. The soil moisture level was kept at 60% of water-holding capacity in all experiments by the addition of suitable quantities of glucose-nutrient solution or distilled water.
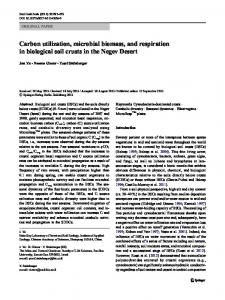
Results Influence of NPK amendment and substrate-application technique Addition of the glucose-nutrient solution with a C : N : P ratio of 1 : 30 : 108 resulted in a larger increase in respiration as compared with the glucose-only amendment. The mmax of microorganisms was higher for glucose plus NPK amended soil (0.23 h –1) than for glucose amended soil (0.19 h –1). Two of the three model parameters (mmax and B in Eq. 6) were statistically different in these treatments. This means that for the soil tested, microbial growth is limited by available nutrients besides glucose-C, i.e. by N, P, S, or K (Stotzky and Norman 1961a, 1961b) and that for a correct estimation of the microbial biomass to be made by the kinetic method these elements need to be added. The addition of the dry glucose-talcum mixture or dropwise application of glucose solution to soil led to the same respiration rates, while the application of the glucose solution with a syringe at a local injection point resulted in a lower initial respiration response. As the first two methods gave the same results, this can be taken as evidence that glucose applied dry and dropwise reached all the microorganisms present, while glucose injected locally did not. It can also be concluded that stirring the soil with a handheld blender did not affect the respiratory activity of the soil microorganisms. Probably the application of glucose solution with a syringe at a local injection point was insufficient for the even distribution of substrate. Influence of preliminary glucose amendment on the microbial biomass and its activity The model used (Eq. 6) gave curves with a good fit (Fig. 1, Table 1), indicating an increase in microbial acFig. 1 A,B Dynamics of substrate-induced growth response in two soils amended with 0.5 mg glucose-C for preliminary biomass activation. A Timmerlah soil, B FAL Schlag 1 soil. The curves were calculated according to Eq. 6. Parameter values are presented in Table 1
tivity after substrate amendment for both soils. The optimized parameters (A, B, and mmax) allowed us to describe the microbial respiration activity quantitatively and to follow the changes in the ratios between the growing and sustaining microbial fractions (Eq. 7) and the total amount of microbial biomass (Eq. 10, Table 2). Both soils demonstrated similar dynamics with a maximum growing biomass at day 3. The total biomass was maximum at day 7, and was still higher at the end of incubation (day 14) than at day 0. The initial level of SIR at day 0 was almost twice as high in the loamy soil (Timmerlah) as in the sandy soil (FAL Schlag 1). A similar difference was found for respiration uncoupled from growth (parameter A, Table 1). The relative increase in the growing biomass at day 3 was also larger for Timmerlah soil. The amount of biomass able to grow immediately reached 16 times the amount present at tp0 in Timmerlah soil and only 7 times this amount in sandy soil (FAL Schlag 1). The larger growth potential can be explained by the higher level of sustaining biomass in the Timmerlah soil (Table 2). The mean mmax induced by glucose was higher for sandy soil at the beginning of the experiment, indicating differences in the composition of the microbial communities in the two soils. Storage time and temperature Soil storage at 4 7C and incubation at 22 7C markedly affected the initial SIR and the amount of sustaining and growing microbial biomass (Table 3). A 10-day incubation at 22 7C lead to a twofold decrease in the active biomass that was greater than the decrease following 4 months’ storage at 4 7C. A consecutive period of 4 months’ storage at 4 7C and a 60-day incubation at 22 7C reduced the biomass to 14 mg C g –1 soil, 40 times less than the amount found in freshly sampled soil. At the same time, the mmax was nearly constant during incubation and storage. The 4-month storage period did not distinctly influence the ratio between the sustaining and growing microbial biomass, while, depending on the duration of the incubation at 22 7C, the growing biomass increased by a factor of 2–3.
Respiration rate µgCg soil h -1
50
-1
50
Respiration rate µgCg -1 soil h-1
A
B
40
40
30
30
20
20 Day0 Day3 Day7 Day10
10
0 0
5
Time,hours
10
10
15
0 0
5
Time,hours
10
15
77 Table 1 Dynamics of model parameters optimized for respiration curves of two soils amended with glucose at a rate 0.5 mg C g –1 soil Time after initial amendment (days)
Goodness of fit (r 2)
Timmerlah
0 (Control) a 0 (Control) 0 (Control) 3a 3 3 7a 7 10 a 10
FAL Schlag1
0 (Control) a 0 (Control) 0 (Control) 3a 3 3 7a 7 10 a 10
Soil
a
Degrees of freedom (n)
Parameter valueBSE Uncoupled respiration (A) (mg C g –1 soil h –1)
Coupled respiration (B) (mg C g –1 soil h –1)
Specific growth rate (mmax) (h –1)
0.997 0.997 0.995 0.995 0.994 0.996 0.999 0.996 0.997 0.993
25 25 22 13 10 11 11 12 12 8
7.29B0.61 7.34B0.63 7.76B0.92 7.30B4.77 6.83B7.48 6.12B9.14 10.39B4.65 11.64B3.30 13.66B2.51 13.30B4.38
0.40B0.16 0.43B0.17 0.59B0.31 6.52B3.86 7.30B6.52 8.32B8.22 4.50B3.67 3.50B2.38 2.00B1.50 1.67B3.22
0.30B0.028 0.30B0.028 0.28B0.040 0.28B0.080 0.29B0.140 0.26B0.148 0.34B0.128 0.37B0.106 0.43B0.116 0.46B0.386
0.997 0.997 0.998 0.970 0.991 0.995 0.996 0.986 0.981 0.969
24 25 23 17 22 17 21 25 15 17
3.96B0.27 4.03B0.26 3.94B0.28 3.03B0.52 3.14B0.91 3.83B1.09 3.88B0.75 3.96B0.55 4.02B1.04 4.36B0.76
0.20B0.07 0.20B0.06 0.20B0.07 0.49B0.30 1.51B0.58 1.92B0.69 1.42B0.48 0.73B0.31 0.70B0.62 0.63B0.49
0.36B0.030 0.38B0.024 0.37B0.031 0.31B0.065 0.22B0.032 0.31B0.041 0.27B0.033 0.25B0.036 0.29B0.094 0.29B0.086
Respiration curve presented in Fig. 3
Table 2 Dynamics of microbial biomass and activity in two soils amended with glucose at a rate of 0.5 mg C g –1 soil Soil
Time after initial amendment (days)
Activity (%) (r0p100)
Growing biomass (mg C g –1 soil)
Total biomass (sustaining plus growing) (mg C g –1 soil)
Timmerlah
0 (Control) 3 7 10
0.6B0.1 a 9.9B1.9 3.5B0.87 1.3B0.14
2.2B0.56 36.3B6.19 15.4B3.75 5.6B0.90
347B25.86 366B15.33 436B1.14 415B23.67
FAL Schlag1
0 (Control) 3 7 10
0.5B0.01 3.7B1.78 2.7B1.02 1.6B0.2
0.7B0.03 6.6B3.85 5.5B2.26 3.1B0.25
146B2.8 169B33.95 208B10.39 200B10.40
a
Mean value for three replicatesBSD
Table 3 Microbial biomass and activity in Timmerlah soil as influenced by duration and temperature of soil storage and incubation Storage time and temperature
Incubation time and temperature
mmax (h –1)
Activity (%)
Growing biomass (mg C g –1 soil)
Total biomass (sustaining plus growing) (mg C g –1 soil)
Non stored
5 Days’ preincubation at 22 7C 5 Days’ preincubation c10 days at 22 7C 5 Days’ preincubation at 22 7C 2 Months at 22 7C
0.26B0.01 a
0.8B0.2
4.9B1.12
631B41.9
0.23B0.04
1.7B1.0
4.5B2.7
270B15.0
0.29B0.011
0.6B0.1
2.2B0.56
347B25.9
0.22B0.004
2.7B0.17
0.37B0.02
14B0.25
Non stored 4 Months at 4 7C 4 Months at 4 7C a
Mean value for three replicatesBSD
78
Discussion Comparison of the respiration-based techniques
Biomass (kinetic method) µg C (g soil)-1
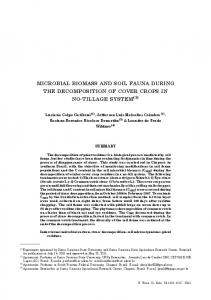
The physiological method for determining microbial biomass with SIR devised by Anderson and Domsch (1978) is based on the primary assumption that the maximum initial respiratory response of glucose-saturated soil is proportional to the amount of microbial biomass present. This assumption holds true for soil conditions when microbial growth commences only after a 4–10 h lag phase following glucose addition. Though SIR is a useful tool it does not allow for a more detailed description of the physiological state of microorganisms in soil. A kinetic analysis of the respiration curve can, however, be used to gain further qualitative and quantitative information regarding the soil microbial community. This approach is based on a mathematical description of microbial growth in soil, whose determinants can easily be estimated from the shape of the respiration curves (length of lag phase and slope), that is usually not carried out in the procedure originally proposed by Anderson and Domsch (1978). In general, the estimates of microbial biomass given by both the kinetic approach and the SIR method should coincide. We compared the biomass data obtained by the SIR technique, i.e. by multiplying the maximum initial respiration rate by a factor of 30 (Kaiser et al. 1992), and that obtained using a kinetic approach (Panikov and Sizova 1996), calculated according to Eq. 8. Our results (Fig. 2) demonstrate the close linear correlation between the estimates given by the two
800
2
r =0.986 0.84x-39.1
600
400
200
0 0
200
400
600
800
1000
Biomass (SIR) µg C (g soil)
-1
Fig. 2 The relationship between the microbial biomass measured by the kinetic method and by the substrate-induced respiration (SIR) method (1 mg biomass-Cp30 mg CO2). We excluded data on SIR (non-filled squares) when no lag-phase occurred and exponential growth started immediately after glucose amendment
methods, except for the data from the Timmerlah soil at 3, 7 and 10 days, where an immediate exponential increase in the respiration rate was observed. In contrast to the kinetic method, the SIR technique fails for cases where there is no plateau (lag phase) in the respiration curve. For such activated microbial communities, the calculation of biomass by the SIR procedure leads to an overestimate. Sparling et al. (1981) concluded the same for microbial biomass estimates of glucose-amended soils. This effect can be further shown by a simple calculation: during a 3-day incubation with a 500 mg glucose-C amendment, 300 mg CO2–C was respired, allowing for a maximum increase of 200 mg biomass-C (i.e. 500–300 mg biomass-C). In contrast, the apparent increase in the biomass measured by SIR-method during a 3-day incubation period was 412 mg biomass-C (i.e. 880–468 mg biomass-C). Thus the SIR method clearly gave an overestimate of the biomass in this case by a factor of 2. Actually, an actively growing microbial biomass respires more CO2–C per mass unit than a sustaining biomass (Anderson and Domsch 1978). In contrast, the kinetic approach underestimates the total soil biomass. An examination of the respiration curve only gives us information concerning glucose-oxidizing soil microorganisms, not about the complete soil population. According to van de Werf and Verstraete, (1987a) and Panikov and Sizova (1996), microorganisms responding to glucose addition represent 16–50% of the total viable biomass. Another reason for uncertainties in the kinetic approach may be the application of a mean theoretical value for the yield factor, YCO 2 (Eq. 9), rather than the estimated value from measured data for the microbial community under study. For instance, an increase in the yield factor from 0.6 to 0.7, which has been reported for soil microorganisms growing on glucose (Bremer and van Kessel 1990; Blagodatsky et al. 1992; Bremer and Kuikman 1994), can result in a 50% increase in the calculated total microbial biomass. For this reason data obtained with the SIR technique, calibrated against those of the CFI method (Anderson and Domsch 1978; Kaiser et al. 1992) results in values 30–50% higher than those derived by the methods calibrated by means of microbial growth response data (van de Werf and Verstraete 1987b; Colores et al. 1996). Both methods for estimating the active soil microbial biomass suggested by van de Werf and Verstraete, (1987a) (model 1, Table 4) and used by Colores et al. (1996) are based on equations originally derived for chemostat pure cultures (Monod 1942; Pirt 1975). By using this approach unrealistic results can be obtained as soil generally is extremely low in available energy sources. Application of the maintenance coefficient according to Pirt’s (1975) concept is helpful only when describing the dynamics of a soil microbial community under steady-state conditions (Smith et al. 1986; Chapman and Gray 1986). Substrate amendment is expected to bring about a dramatic change in the physiological state of a starving soil population. In soil, the transition
79
50
Respiration rate µg Cg -1 soil h-1
Soil Microbial Biomass
40
Model 1 Model 2 CO2
dormant
sustaining
growing
spores and other resting structures
metabolizing glucose, not proliferating
immediatedly proliferating on glucose with exponential growth
CFI, JenkinsonandPowlson(1976); CFE, Vance etal.(1984); (SIR), AndersonandDomsch(1978)
30 Active Biomass, Van de Werf and Verstraete (1987)
20 Kinetic Approach, Panikov and Sizova (1996)
10 0
5
Time, hours
10
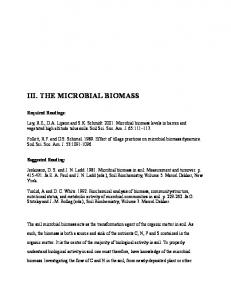
Fig. 4 Classification of soil microbial biomass and available methods to quantify these classes
15
Fig. 3 Comparison of models fitted to the SIR data. Model 1 (van de Werf and Verstraete 1987a) considers growth and maintenance respiration; model 2 (Panikov and Sizova 1996) considers coupled and uncoupled respiration. Parameter values are presented in Table 4
of microorganisms from a sustaining to a growing state is associated with long lag phases (Nordgren et al. 1988; Blagodatsky et al. 1994; Marstrop 1996). The kinetic method for estimating the microbial biomass in soil (model 2, Table 4) proposed by Panikov and Sizova, (1996) is based on a SCM which is able to describe transient dynamics of sustaining microorganisms after substrate amendment (Panikov 1995). We compared two models using the data from our second experiment with two soils. Our results (Fig. 3, Table 4) demonstrate the advantage of model 2 compared to model 1. The Q values as well as r 2 were higher for model 2 for all tested respiration curves measured during experiment 2 with two soils (19 curves, figures not shown). The r 2 values and Q values were always 1 0.97 and 1 0.98, respectively. Both models gave similar confidence intervals only for the Timmerlah soil measured 3 days after glucose amendment. At this time, the growing biomass responded with an immediate exponential increase in the respiration rate (Fig. 1A), and the physiological state parameter, r0, showed the highest values (Ta-
ble 1). The reason for this result is that model 2 follows the same equation as model 1 for the special case of r0p1 (when all the biomass is growing). While SIR proved to be only suitable for soils that contain sustaining microbial biomass and no growing microbial biomass, and model 1 was unsuitable for situations where the growing microbial biomass was associated with the sustaining microbial biomass, model 2 was able to describe all situations in a meaningful, quantitative and statistically reliable way (Fig. 4). Changes in microbial biomass and activity caused by glucose addition Our experiments reflected the well-known fact that glucose amendment increases the microbial “activity” in soil (Stotzky and Norman 1961a; Sparling et al. 1981). The application of simulation model 2 revealed additional peculiarities of the behaviour of the microbial biomass in soil. The measured kinetic parameters characterized the dynamics of the physiological state of soil microorganisms. According to our data, only 0.5–0.8% of the soil microbial biomass was “growing” in unamended soil. Glucose application at a rate 0.5 mg C g –1 soil increased that portion to 4–10% after 3 days.
Table 4 Comparison of models for substrate-induced respiration of glucose-amended soil. n (t) CO2 production rate, X0 viable microbial biomass, m maintenance coefficient; for other abbreviations, see Table 1 Model
Equation
Model 1 (van de Werf and Verstraete 1987a)
n (t)p
Model 2 (Panikov and Sizova 1996)
mmax
1 1.5 cm2 7 X 7exp (m 0
n (t)pAcB7exp (mmax t)
max
t)
Parameter valuesBSE
Goodness of fit
mmaxp0.125B0.02 h –1 mp0.125B15.42 h –1 X0p5.36B2.87 mg C g –1 soil mmaxp0.28B0.04 h –1 Ap7.76B0.92 mg C g –1 soil h –1 Bp0.59B0.31 mg C g –1 soil h –1
r 2p0.9401 Qp0.648 r 2p0.9955 Qp1.0
80
Amendments as high as 1.2 mg C g –1 soil (data not shown) resulted in a growing portion of about 90–100% after 2 days. It is interesting that the changes in the sustaining biomass due to glucose amendment showed a time pattern different from the changes of the “active” microbial biomass (Table 2). We explain the delay in the increase in the total biomass by the following: after glucose application starving microorganisms enhance their respiration activity. However, most of the C consumed is used as an energy source for the synthesis of inducible enzymes and other components responsible for growth, yet no C is incorporated into structural cell components. We can see the start of growth as evidenced by respiration well before the biomass begins to increase. C is then incorporated into structural cell components, the cells divide and the biomass increases. Immediately thereafter, respiration activity coupled with growth (parameter B in Eq. 6) ceases, due to exhaustion of the glucose supply. The results of growth can then be observed as an increase in the sustaining biomass, while the growing biomass has already started to decrease. Similar explanations of glucose uptake dynamics and its metabolism by microorganisms in soil were presented by Bremer and co-authors (Bremer and van Kessel 1990; Bremer and Kuikman 1994) based on cell biochemistry investigations (Könings and Veldkamp 1983). Our experiments showed a rather low fraction of actively growing microorganisms to be present in the nonamended soil. To avoid uncertainties we need to discuss differences in the meaning of the phrase “active biomass” used in the literature. Partitioning of the microbial biomass by kinetic analysis of respiration curves (Blagodatsky et al. 1994; Panikov and Sizova 1996) reflects the biomass responding to substrate amendment with immediate growth (“growing”) on the one hand, and the biomass responding to substrate amendment without growth (“sustaining”) on the other. Van de Werf and Verstraete (1987b) considered the microbial biomass responding to glucose addition as “active”, as opposed to the “total” chloroform-sensitive biomass. Another definition for “active” biomass can be found in Smith et al. (1985). In their experiments with 14Cglucose amendments, they considered the labelled fraction of evolved CO2 as a measure of the active biomass. However, as can be seen from their data (Fig. 6 in Smith et al. 1985), the 14CO2 respiration rate also showed a lag phase, and thus cannot be attributed to growing microorganisms only. With these discrepancies in mind, it is difficult to directly compare our data on the biomass partitioned into growing and sustaining fractions with those on active and total biomass made by other authors (Fig. 4). From our point of view it would be inadequate to directly associate the two derived fractions of the microbial biomass in terms of their initial respiration response to substrate addition (A and B in Eq. 6) with autochtonous and zymogenous populations, as was done by Stenström et al. (1998). These authors believe
that autochtonous populations will never grow in response to substrate addition, even under an excess of substrate, but will instead change their rate of respiration to a high and constant one. However, it is improbable assumption. We state that each microorganism has its individual respiration response. The total response of a microbial community then can be described by the responses of only two assumed ideal fractions: K and r strategists; fungi and bacteria (Anderson and Domsch 1973); allochtonous and autochtonous populations (Stenström et al. 1998), whose quantitative relations can be derived from a measured respiration curve. A more fundamental assumption based on cell physiology is a good background for such a basic mathematical expression as Eq. 6. We associate the constants A and B in Eq. 6 with two groups of respiratory enzymes. Those carrying out the energy-spilling oxidative reactions uncoupled from ATP generation (A), and those responsible for productive substrate oxidation (B) (Panikov and Sizova 1996). The theory provided by Panikov (1995) seems to be sound for the description of respiration curves observed with real data. In contrast to Stenström et al. (1998), who only derived values for the initial respiration response and a mmax, Panikov and Sizovas’ (1996) approach allows for the estimation of the total biomass present and its growing and sustaining fractions. Clearly, further investigations dealing with the activity status of microorganisms under different soil conditions, such as moisture content or nutritional status, are needed. Nevertheless, the approach applied in this work provides unambiguous, operational and quantitative information derived from respiration curves. The physiological state of soil microorganisms that can be deduced as parameter r0 from the model applied here is clearly related to a microbial population’s lag phase (Nordgren et al. 1988). An approach which includes the use of simulations gives the possibility of separating this information from other kinetic parameters (mmax; A plus B, i.e. the initial respiration rate) which together define the shape of the respiration curve. Acknowledgements We are grateful to T.-H. Anderson, BFAL Brunswick, for valuable discussion, and appreciated the suggestions of two anonymous reviewers. This work was completed due to a research fellowship granted to S. Blagodatsky from the Alexander von Humboldt Foundation, Germany, and supported in part by the Russian Foundation of Basic Researches (grant nos. 98-04-48906 and 99-04-48698).
References Akimenko VK, Trutko SM, Medentsev AG, Korobov VP (1983) Distribution of cyanide-resistant respiration among yeasts and bacteria and its relation to oversynthesis of metabolites. Arch Microbiol 136 : 234–241 Anderson JPE, Domsch KH (1973) Quantification of bacterial and fungal contributions to soil respiration. Arch Microbiol 93 : 113–127
81 Anderson JPE, Domsch KH (1978) A physiological method for the quantitative measurement of microbial biomass in soils. Soil Biol Biochem 10 : 215–221 Blagodatsky SA, Larionova AA, Yevdokimov IV (1992) Effect of mineral nitrogen on the respiration rate and growth efficiency of soil microorganisms. Eurasian Soil Sci 25 : 85–95 Blagodatsky SA, Richter O (1998) Microbial growth in soil and nitrogen turnover: a theoretical model considering the activity state of microorganisms. Soil Biol Biochem 30 : 1743–1755 Blagodatsky SA, Blagodatskaya EV, Rozanova LN (1994) Kinetics and strategy of microbial growth in Chernozemic soil affected by different long-term fertilization. Microbiology 63 : 298–307 Bremer E, Kessel C van (1990) Extractability of microbial 14C and 15N following addition of variable rates of labelled glucose and (NH4)2SO4 to soil. Soil Biol Biochem 22 : 707–713 Bremer E, Kuikman P (1994) Microbial utilisation of 14C[U]glucose in soil is affected by the amount and timing of glucose additions. Soil Biol Biochem 26 : 511–517 Chapman SJ, Gray TRG (1986) Importance of cryptic growth yield factors and maintenance energy in models of microbial growth in soil. Soil Biol Biochem 18 : 1–4 Colores GM, Schmidt SK, Fisk MC (1996) Estimating the biomass of microbial functional groups using rates of growth-related soil respiration. Soil Biol Biochem 28 : 1569–1577 Gray TRG (1976) Survival of vegetative microbes in soil. Symp Soc Gen Microbiol 26 : 327–364 Heinemeyer O, Insam H, Kaiser E-A, G Walenzik (1989) Soil microbial biomass and respiration measurements: an automated technique based on infra-red gas analysis. Plant Soil 116 : 191–195 Jenkinson DS, Powlson DS (1976) The effects of biocidal treatments on metabolism in soil. V. A method for measuring soil biomass. Soil Biol Biochem 8 : 209–213 Kaiser E-A, Müller T, Joergensen RG, Insam H, Heinemeyer O (1992) Evaluation of methods to estimate the soil microbial biomass and the relationship with soil texture and organic matter. Soil Biol Biochem 24 : 675–683 Könings WN, Veldkamp H (1983) Energy transduction and solute transport mechanisms in relation to environment occupied by microorganisms. In: Slater JH, Whittenbury R, Wimpenny JWT (eds) Microbes in their natural environments. Cambridge University Press, Cambridge, pp 153–186 Marstrop H (1996) Interactions in microbial use of soluble plant components in soil. Biol Fertil Soils 22 : 45–52 Monod J (1942) Recherches sur la croissance des cultures bacteriennes. Hermann, Paris Nordgren A, Bååth E, Söderstrem B (1988) Evaluation of soil respiration characteristics to assess heavy metal effects on soil microorganisms using glutamic acid as substrate. Soil Biol Biochem 20 : 949–954
Panikov NS (1995) Microbial growth kinetics. Chapman Hall, London Panikov NS (1996) Mechanistic mathematical models of microbial growth in bioreactors and in natural soils: explanation of complex phenomena. Math Comput Simul 42 : 179–186 Panikov NS, Sizova MV (1996) A kinetic method for estimating the biomass of microbial functional groups in soil. J Microbiol Methods 24 : 219–230 Paul EA, Clark FE (1989) Soil microbiology and biochemistry. Academic Press, San Diego, Calif. Payne WJ (1970) Energy yields and growth of heterotrophs. Annu Rev Microbiol 24 : 17–52 Pirt SJ (1975) Principles of microbe and cell cultivation. Wiley, New York Schmidt SK (1992) A substrate-induced growth-response method for estimating the biomass of microbial functional groups in soil and aquatic systems. FEMS Microbiol Ecol 101 : 197–206 Smith JL, McNeal BL, Cheng HH (1985) Estimation of soil microbial biomass: an analysis of the respiratory response of soils. Soil Biol Biochem 17 : 11–16 Smith JL, McNeal BL, Cheng HH, Campbell GS (1986) Calculation of microbial maintenance rates and net nitrogen mineralization in soil at steady-state. Soil Sci Soc Am J 50 : 332–338 Söderström BE (1977) Vital staining of fungi in pure cultures and in soil with fluorescein diacetate. Soil Biol Biochem 9 : 51–63 Sparling GP, Ord BG, Vaughan D (1981) Microbial biomass and activity in soils amended with glucose. Soil Biol Biochem 13 : 99–104 Stenström J, Stenberg B, Johansson M (1998) Kinetics of substrate-induced respiration (SIR): theory. Ambio 27 : 35–39 Stotzky G, Norman AG (1961a) Factors limiting microbial activities in soil. I. The level of substrate, nitrogen and phosphorus. Arch Mikrobiol 40 : 341–369 Stotzky G, Norman AG (1961b) Factors limiting microbial activities in soil. II. The effect of sulfur. Arch Mikrobiol 40 : 370–382 Tempest, DW, Neijssel OM (1984) The status of YATP and maintenance energy as biologically interpretable phenomena. Annu Rev Microbiol 38 : 459–486 Vance ED, Brookes PC, Jenkinson DS (1987) An extraction method for measuring soil microbial biomass C. Soil Biol Biochem 19 : 703–707 Werf H van de, Verstraete W (1987a) Estimation of active soil microbial biomass by mathematical analysis of respiration curves: development and verification of model. Soil Biol Biochem 19 : 253–260 Werf H van de, Verstraete W (1987b) Estimation of active soil microbial biomass by mathematical analysis of respiration curves: calibration of the test procedure. Soil Biol Biochem 19 : 261–265