J. AMER. SOC. HORT. SCI. 132(1):80–89. 2007.
Estimating the Genetic Architecture of Fruit Quality Traits in Melon Using a Genomic Library of Near Isogenic Lines Iban Eduardo1, Pere Aru´s, and Antonio Jos´e Monforte2 Laboratori de Gen`etica Molecular Vegetal CSIC-IRTA, Departament Gen`etica Vegetal, Carretera de Cabrils s/n, 08348 Cabrils (Barcelona), Spain Javier Obando and Juan Pablo Ferna´ndez-Trujillo Instituto de Biotecnolog´ıa Vegetal y Departamento de Ingenier´ıa de Alimentos y del Equipamiento Agr´ıcola, Universidad Polit´ecnica de Cartagena, Campus Paseo Alfonso XIII, 48, ETSIA, 30203 Cartagena (Murcia), Spain Juan Antonio Martı´nez Departamento de Producci´on Vegetal, Universidad Polit´ecnica de Cartagena, Campus Paseo Alfonso XIII, 48, ETSIA, 30203 Cartagena (Murcia), Spain Antonio Luı´s Alarc´on Departamento de Ciencia y Tecnolog´ıa Agraria, Universidad Polit´ecnica de Cartagena Campus, Paseo Alfonso XIII, 48, ETSIA, 30203 Cartagena (Murcia), Spain ´ lvarez Jose Marı´a A Unidad de Tecnolog´ıa en Producci´on Vegetal, Centro de Investigaci´on y Tecnolog´ıa Agroalimentaria de Arag´on. Apartado 727, 50080 Zaragoza, Spain Esther van der Knaap Department of Horticulture and Crop Science, The Ohio State University/OARDC, Wooster, OH 44691 ADDITIONAL INDEX WORDS. Cucumis melo, introgression line, QTL, G · E interaction, heritability ABSTRACT. A melon (Cucumis melo L.) genomic library of near-isogenic lines derived from the cross between the Spanish cultivar Piel de Sapo and the exotic accession PI 161375 has been evaluated for fruit quality traits in four different locations. Traits evaluated were fruit weight, soluble solids content, maximum fruit diameter, fruit length, fruit shape index, ovary shape index, external color, and flesh color. Among these traits, soluble solids content showed the highest genotype · environment interaction, whereas genotype · environment interactions for fruit shape and fruit weight were low. Heritability was high for all traits except soluble solids content, with the highest value for fruit shape and ovary shape. Ten to 15 quantitative trait loci were detected for soluble solids content, fruit diameter, fruit length, and fruit shape; and four to five for ovary shape, external color, and flesh color. Depending on the trait, between 13% and 40% of the detected quantitative trait alleles from PI 161375 increased the trait, and between 60% and 87% of them decreased it, resulting in some PI 161375 alleles of interest for breeding. Most of the quantitative trait loci detected in previous experiments could be verified with the near-isogenic line population. Future studies with the melon near-isogenic line genomic library will provide a better understanding of the genetic control of melon fruit quality in a wider context related to agronomy, genetics, genomics and metabolomics studies. Received for publication 11 Apr. 2006. Accepted for publication 28 Sept. 2006. This work was funded in part by grants AGL2003-09175-C02-01 and AGL2003-09175-C02-02 from the Spanish Ministry of Education and Science and Fondo Europeo de Desarrollo Regional (FEDER, European Union), and the Fundaci´on S´eneca de la Regi´on de Murcia (00620/PI/04). A.J.M. was partly supported by a contract from Instituto Nacional de Investigaci´on y Tecnologı´a Agraria y Alimentaria (INIA) and by a fellowship from the Departament d’Universitats, Recerca i Societat de la Informaci´o (Generalitat de Catalunya, Spain). I.E. and J.O. were supported by fellowships from the Spanish Ministry of Education and Science and the Spanish Ministry of Foreign Affairs respectively. We thank Angel Montejo, Antonio Ortigosa, Eduard Moreno, Fuensanta Garcı´a, Esperanza Truque, Maria Carmen Garcı´a-Abella´n, M´onica Ca´novas (CIFACITA S.L.), Manuela Selva, Ana Bel´en P´erez, and Nick Welty for technical assistance. We also thank Semillas Fit´o S.A. for providing the seeds of the parental PS line. 1 Current address: Institute of Plant Biotechnology, University of Stellenbosch, Merriman Avenue, 7602 Stellenbosch, South Africa. 2 Corresponding author. E-mail:
[email protected].
80
The use of wild or exotic germplasm as a source for novel allelic variation has been proposed as a strategy to recover at least part of the genetic variability lost during domestication (Ladizinsky, 1998). Exotic germplasm has been used to search for resistance genes or new alleles with favorable effects on fruit quality traits to be transferred to elite germplasm (Fernie et al., 2006; McCouch, 2004; Tanksley and McCouch, 1997; Zamir, 2001). However, some disease resistance pathways and most of the fruit quality traits are complex and controlled by several quantitative trait loci (QTL), making an efficient selection of favorable alleles difficult. The development of molecular marker saturated maps allowed the thorough analysis of QTLs using different population structures (Tanksley, 1993) as well as the development of populations suitable for QTL analysis, such as introgression lines and near-isogenic lines (NILs). A NIL genomic library J. AMER. SOC. HORT. SCI. 132(1):80–89. 2007.
consists of a set of lines, each containing a single homozygous chromosome segment from a donor parent in the genetic background of an elite cultivar, all together providing complete coverage of the donor parent genome. Analysis of NIL genomic libraries significantly facilitates QTL analysis. These populations give better estimates of individual QTL effects (Eshed and Zamir, 1995; Tanksley et al., 1996), QTL · environment, QTL · genetic background, and QTL · QTL interactions (Eshed and Zamir, 1996; Monforte et al., 2001). Furthermore, after QTLs are isolated in NILs, they can be combined in an elite cultivar to specific traits such as those for fruit morphology (Tanksley, 2004) or yield (Gur and Zamir, 2004). NILs have been used for the study of different aspects of biology, including fruit sugar content (Fridman et al., 2004), fruit shape (FS) and size (reviewed in Tanksley, 2004), fruit vitamin content (Rousseaux et al., 2005), leaf dissection (Holtan and Hake, 2003), and metabolic profiling (Overy et al., 2005). Potentially, any interesting measurable trait can be studied and dissected using NIL populations. The family Cucurbitaceae includes economically important species such as cucumber (Cucumis sativus L.), squash (Cucurbita maxima Duch.), zucchini (C. pepo L.), watermelon [Citrullus lanatus (Thunb.) Matsum. and Nakai] and melon (C. melo). C. melo is the most diversified species of the genus Cucumis L., and this variability is reflected at the morphological, physiological, biochemical (Burger et al., 2003; Kirkbride, 1993; Liu et al., 2004; Miccolis and Saltveit, 1991; Whitaker and Davis, 1962), and molecular (Akashi et al., 2002; Mliki et al., 2001; Monforte et al., 2003; Stepansky et al., 1999) levels. A high proportion of the genetic variability can be found in African, Indian and Oriental germplasm, which are considered exotic germplasm relative to European and North American cultivars (Akashi et al., 2002; Mliki et al., 2001; Monforte et al., 2003; Stepansky et al., 1999). Even though 162 major genes controlling different aspects of melon biology have been described (Pitrat, 2002), most of them have not been mapped. In addition, the genetic inheritance of most important agronomic traits is largely unknown, due, at least in part, to the fact that full linkage maps have only recently become available (Gonzalo et al., 2005; Oliver et al., 2001; P´erin et al., 2002a). QTLs involved in fruit quality traits have been detected in three different crosses involving European cultivars and exotic Asian accessions (Monforte et al., 2004; P´erin et al., 2002b). New experiments are still needed to assess if these alleles from exotic germplasm can be included into modern melon breeding programs. To obtain good estimates of the effects of QTLs involved in fruit quality traits, we present the phenotypic analysis of fruit quality traits using a melon NIL genomic library unique in the family Cucurbitaceae. This library consists of a set of lines with an introgression from the exotic Korean melon accession PI 161375 in the Spanish melon cultivar Piel de Sapo background, and covers the complete genome of this exotic accession (Eduardo et al., 2005). Materials and Methods PLANT MATERIAL. A set of 27 NILs was derived from a cross between two C. melo genotypes: ‘Piel de Sapo’ (PS) and the exotic Korean accession ‘Shongwan Charmi’ [SC (PI 161375)]. The NILs were developed by marker-assisted selection after several generations of backcrossing and selfing, as described by J. AMER. SOC. HORT. SCI. 132(1):80–89. 2007.
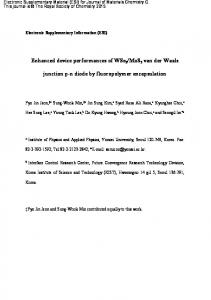
Eduardo et al. (2005). Most of them contained a single homozygote introgression from SC, with only three of them containing a single heterozygote introgression as shown in Fig. 1. The introgressions represented in this set of 27 NILs together cover most of the SC genome. EXPERIMENTAL DESIGN AND PHENOTYPIC EVALUATION. The NILs were evaluated in four locations in the summer of 2004: Cabrils (Spain), Zaragoza (Spain), Cartagena (Spain), and Wooster (Ohio). In Cabrils, 10 plants of each NIL and 100 controls (PS) were grown in a greenhouse in peat bags, drip irrigated, with 0.25-m spacing between plants. The greenhouse was divided in five blocks and an equal number of plants for each NIL and controls were randomized within each block. Plants were hand pollinated, ensuring only one fruit per plant. In Zaragoza, four plots of three plants for each NIL and 14 plots of PS were randomized in the field. The flowers were open pollinated, and three to five fruit from each plot were harvested. In Cartagena and Wooster, 10 plants of each NIL and 50 or 55 controls, respectively, were transferred to the field in a completely randomized design. The flowers were open pollinated. In Cartagena, the plantation had a grid with a distance of 2 m between rows and 1.4 m within hills (0.36 plants/m2). The agronomic evaluation included the following traits: fruit weight (FRW) in grams; soluble solids content (SSC) measured with a hand refractometer from homogenized melon flesh or juice obtained with a metal juicer (in the case of Cartagena); maximum fruit diameter (FD) and fruit length (FL) in centimeters; FS index as the ratio between FL and FD; ovary shape index (OS) as the ratio between maximum ovary diameter and ovary length, only in Cabrils; and external color (ECOL) evaluated subjectively in vivo or using digital pictures as green, dark green, or light green, and flesh color (FCOL) as white, green, light green, and orange. All traits were measured in all locations except for OS, which was studied only in Cabrils. Additional observations of plants and fruit (plant structure, plant health, fruit external spot pattern, necrosis of fruit placental tissue) were recorded when the phenotypes were very different from the PS control. DATA ANALYSIS. All statistical analyses were performed with JMP (version 5.1.2 for Windows; SAS Institute, Cary, N.C.). The interaction of the effects of the SC introgressions with the different environments was studied only in Cabrils, Zaragoza, and Cartagena, because it was not possible to obtain data from all the lines in Wooster as a result of unfavorable weather conditions. Only NILs that set fruit an all three previously cited locations were included in the analysis. The model for the two-way analysis of variance (ANOVA) was Yijk = m + Gi + Ej + GEij + eijk
[1]
where m represents the population mean value; Gi, the effect of the genotype [NIL (fixed effect)]; Ej, the environment effect [Cabrils, Zaragoza, or Cartagena (random effect)]; GEij, the genotype · environment (G · E) interaction effect; and eijk, the error or random residual effect. Significance of the effects was studied by an F test and variance components were also estimated. NILs with a higher G · E interaction were identified by comparing the NIL mean estimates, according to the model, and the actual NIL means, by a t test. Heritability (h2) was estimated in each location independently from the ANOVA: 81
Fig. 1. Graphical genotypes of the Cucumis melo NILs evaluated. The lines are shown on the right. a, more than one introgression; b, the NIL has an introgression slightly different from the introgression of the NIL with the same number described in Eduardo et al. (2005), although it covers the same genomic region; h, the introgression is heterozygous; and d, that part of the introgression is heterozygous. Linkage groups (LG) are depicted at the top. LG nomenclature is according to P´erin et al. (2002a) and the molecular map is according to Gonzalo et al. (2005). Heterozygous and homozygous introgressions from SC are shown in gray and black respectively.
Yij = m + NILi + eij
[2]
where NILi is the effect of the NIL, and the estimate of h2 was calculated as [3] h2 = Vb =Vt where Vb and Vt are the between-family (genetic variance) and total variances respectively estimated from the mean squares of 82
the ANOVA. The statistical significance of h2 was obtained from the previous ANOVA. Pearson correlation coefficients between traits were calculated independently in each location. Correlations were considered significant at P < 0.005 (0.005 = 0.05/10 correlation pairs per location), except in Cabrils, where the level of significance was fixed at P < 0.003 (0.003 = 0.05/15 correlations performed in Cabrils). J. AMER. SOC. HORT. SCI. 132(1):80–89. 2007.
To study the effect of the SC introgressions, NIL mean values were compared with the mean of the control genotype PS using the Dunnet contrast (Dunnet, 1955) with type I error a # 0.05 for each location. The number of QTLs was estimated assuming there was only one QTL per introgression, and when two NILs with overlapping introgressions showed significant effects, the QTL was located in the overlapping region. Results PHENOTYPIC ANALYSIS OF THE CONTROL GENOTYPE. Trait means and SDs for PS in different locations are given in Table 1. PS fruit are large and oval, with high SSC, white flesh, green skin, and a sparse spot pattern. The more evident differences between locations were for FRW (very low in Zaragoza) and SSC (very low in Wooster). These differences can be explained by the weather conditions. In Zaragoza it was dry, which is associated with small fruit. The weather in Wooster was very humid, often overcast, and with low solar irradiation. Those weather conditions affect negatively melon vegetative growing, probably reducing leaf carbon assimilation, limiting the source for fruit sugar accumulation (Long et al., 2004; Pardossi et al., 2004). GENOTYPE · ENVIRONMENT INTERACTION, HERITABILITY, AND TRAIT CORRELATIONS. Genetic and environment effect components and their interactions were significant for all traits (Table 2), although the contribution of each component to the variation was remarkably different between traits. FL and FS showed a low environment effect (24% and 22% of total variance respectively) and a low G · E interaction effect (4.5% and 9.5% of total variance respectively), FD and FRW showed a high environment effect (54% and 46%) but a low G · E interaction effect (6.3% and 5.4%), and SSC showed an important environment effect (21.8%) and G · E interaction effect (24.1%). Heritability estimates are given in Table 3. Heritability was highly significant for all traits in every location. The highest values were obtained for FS and OS: 0.62 and 0.84 respectively. The lowest values were found for SSC (range, 0.18–0.51), with intermediate values for FD, FL, and FRW (range, 0.29–0.72). Correlations between traits are shown in Table 4. In all locations, the highest correlations were found between FRW and FD (mean correlation, 0.89), and between FL and FS (mean correlation, 0.74). The correlation between FS and OS was also quite strong in Cabrils. SSC correlated less significantly with other traits, and these correlations were not consistent between locations. PHENOTYPIC ANALYSIS OF THE NIL POPULATION FOR FRUIT QUALITY TRAITS. NIL trait means with respect to the PS control
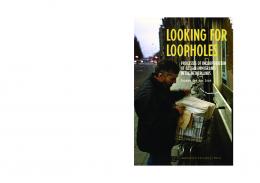
mean in each location, and the statistical significance of the comparisons with the control for SSC, FRW, FD, FL, and FS are depicted in Fig. 2. Data from NIL SC5-4 were not obtained in any location because of germination problems. The remainder of the NILs were evaluated in Cartagena and Zaragoza. In Cabrils, NILs SC1-4a and SC5-2 did not produce fruit because the plants suffered severe necrosis. NILs SC6-4, SC8-4, SC10-2, and SC11-2hab did not produce fruit in Wooster because most of these plants were affected by disease. There was wide variation for every trait, including phenotypic values that were up to 50% higher than the PS control. SOLUBLE SOLIDS CONTENT. Nineteen NILs were significantly different from the control in at least one location. Two of them had fruit with between a 15% and 22% higher SSC than the control (SC1-4a, SC3-5ab) and the other 16 had between 11% and 31% less SSC (SC2-2a, SC2-3d, SC3-3, SC4-4, SC5-2, SC6-4, SC7-2, SC7-4ab, SC8-2, SC8-3, SC8-4, SC9-1a, SC9-3, SC11-2hab, SC12-1ab, SC12-4hb). NIL SC10-2 had significantly opposite allelic effects: higher SSC in Zaragoza and lower in Cartagena. The most consistent NILs were SC2-3d (reducing between 18% and 31%), SC3-5ab (increasing between 16% and 19%), and SC8-4 (decreasing 13% and 16%), with significant effects in two locations. The rest of the NILs (except for SC10-2) showed significant effects only in one location. The pairs of NILs SC2-2a and SC2-3d, and SC7-2 and SC7-4ab shared a fragment of the introgression, so each pair of NILs may represent a single QTL. NILs SC8-2, SC8-3, and SC8-4 shared different regions of linkage group (LG) VIII; the minimum number of QTLs represented in these NILs was two. Finally, the estimated minimum number of QTLs affecting this trait was 15. FRUIT WEIGHT. Fourteen NILs were significantly different from the control in at least one location. Four of them had an increase in FRW between 16% and 39% (SC1-4a, SC6-4, SC9-3, SC11-2hab), and the other 10 had a decrease in FRW between 20% and 56% (SC3-3, SC3-5ab, SC4-3b, SC4-4, SC5-2, SC7-4ab, SC8-1, SC8-2, SC8-4, SC10-2). The most consistent NILs were SC4-3b (decreasing between 54% and 56%), SC4-4 (decreasing between 22% and 41%), and SC6-4 (increasing between 23% and 29%), with significant differences in all locations where they were evaluated, and SC8-1, which gave significant differences in three of them decreasing between 32% and 36%. SC7-4ab, SC8-2, SC8-3, SC11-2hab, and SC12-4hb were the most divergent among locations (P < 0.05). SC8-3 and SC12-4hb did not show significant effects in any location, but showed significant different effects among locations. This result may indicate that the putative QTLs represented in those NILs have relatively strong interaction effects but low main effects. The pairs of NILs SC3-3 and SC3-5ab, SC4-3b and SC4-4, and SC8-1 and SC8-2 shared part of their introgressions, so the
Table 1. Means and standard deviations for Cucumis melo cultivar Piel de Sapo (PS) in different locations for the fruit quality traits evaluated in the trials: FRW, SSC, FD, FL, FS, and OS. Location N FRW (g) SSC (%) FD (cm) FL (cm) FS OS Cabrils 52 2056.20 ± 432.58 10.40 ± 1.30 14.59 ± 0.97 18.41 ± 1.84 1.26 ± 0.08 1.79 ± 0.15 y Cartagena 47 2013.82 ± 300.01 11.98 ± 1.89 13.71 ± 0.81 19.07 ± 1.57 1.39 ± 0.10 y Wooster 14 1748.14 ± 735.49 8.69 ± 2.62 13.28 ± 1.77 18.84 ± 2.81 1.42 ± 0.08 y Zaragoza 15 1144.72 ± 223.23 11.03 ± 1.08 11.46 ± 0.85 16.89 ± 1.36 1.48 ± 0.06 z
Number of plants. Data not available.
y
J. AMER. SOC. HORT. SCI. 132(1):80–89. 2007.
83
Table 2. Partition of the variance in genetic (G) and environmental (E) components, their interaction (G · E) and residual error including data from three locations: Cabrils, Cartagena, and Zaragoza, Spain. FRW SSC FD FL FS df SS P SS P SS P SS P SS P G 23 3154