Ecological Applications, 9(1), 1999, pp. 254–265 q 1999 by the Ecological Society of America
ESTIMATING THE PROBABILITY OF LONG-DISTANCE OVERLAND DISPERSAL OF INVADING AQUATIC SPECIES LUCY A. J. BUCHAN
DIANNA K. PADILLA1
AND
Department of Zoology, 430 Lincoln Drive, University of Wisconsin, Madison, Wisconsin 53706 USA
Abstract. Accurately predicting the pattern and rate of spread of invading species is difficult, particularly for species that disperse long distances. Though relatively rare, and often stochastic, long-distance dispersal events increase the maximum rate and geographic extent of invasion. Human activities are responsible for the spread of many exotic species, particularly aquatic species such as the zebra mussel, which are primarily transported within North America by recreational boaters. We estimated spatial and temporal patterns of boating traffic among Wisconsin’s inland waterbodies using results of a large, randomized survey of recreational boaters conducted by the Wisconsin Department of Natural Resources. Of the survey respondents, .90% of boaters traveled locally, within a county or to adjacent counties, 8.4% moved .50 km, and only 0.8% moved extreme long distances (.261 km, two standard deviations above the mean of intercounty travel). Extreme longdistance boater movements were correlated positively with greater numbers of registered boaters in source and destination counties, and with greater surface area and numbers of named lakes in destination counties. We compared the observed spatial and temporal patterns of the zebra mussel invasion to those estimated from recreational boater movement by simple diffusion models. Diffusion models underestimated the maximum rate and geographic extent of the zebra mussel invasion and overestimated the invasion of suitable habitats within this extent. Patterns of recreational boater activity in Wisconsin were a better predictor of the observed zebra mussel invasion pattern because they provided probabilistic estimates of invasion at finer spatial resolution. These estimates may be used to manage the spread of boater-dispersed aquatic invaders. To slow the spread of boaterdispersed aquatic invaders such as the zebra mussel, management efforts should target highfrequency, long-distance boater movements, and regions with the greatest volume of source and/or destination boater movement. Key words: aquatic ecology; biological invasions; diffusion models; dispersal; Dreissena; exotic species; geographic spread; invading species; Lake Michigan (USA); recreational boaters; zebra mussels.
INTRODUCTION A large number of exotic species have invaded a wide array of natural communities, often causing major ecological and economic impacts (Carlton and Geller 1993, U.S. Congress Office of Technology Assessment 1993, Hengeveld 1994). Indeed, invading exotics may currently be the greatest agent of environmental threat to natural communities (Carlton and Geller 1993, Vitousek 1994). Long-distance dispersal events increase the maximum rate and geographic extent of invasion and are important to understand to prevent or slow invasions. However, because they are rare and stochastic, long-distance dispersal events are difficult to observe in nature and therefore are rarely included in predictive invasion models (Hengeveld 1994).
Manuscript received 27 May 1997; revised 24 February 1 Address reprint requests to this author. Present address: Department of Ecology and Evolution, State University of New York at Stony Brook, Stony Brook, New York 11794 USA. E-mail:
[email protected]
To interpret and predict invasion patterns, we must understand the velocity, frequency, distance, and direction of movement of individuals or their vectors, and the environmental factors influencing these movements at appropriate spatial and temporal scales in spatially explicit contexts. Invasion processes have been studied primarily using mathematical models that predict the rate and spatial pattern of invasion and are variations on diffusion and reaction–diffusion models (Andow et al. 1990, Hengeveld 1994). For the invasion of terrestrial habitats or in oceanic marine systems, reaction–diffusion (R–D) models may be good descriptors, especially over small spatial scales where most of the habitat is invasible or can be easily crossed by dispersal propagules (Lubina and Levin 1988, Hengeveld 1994). Frequent short-distance movement among habitat patches or saltation has been described by telegraph models (Holmes 1993) and by interacting particle models (Levin et al. 1993). However, longer distance movement between few, discrete patches surrounded by uninhabitable area is less effectively described using a diffusion approach. For example, dif-
254
February 1999
PREDICTING SPREAD OF AQUATIC INVADERS
fusion models underestimated the rate of spread of the cereal beetle Oulema melanopus due to infrequent long-distance dispersal by wind or humans (Andow et al. 1990). For most aquatic species, dispersal between unconnected waterbodies or across watersheds requires vectors and is difficult due to limitations in surviving outside of water for extended periods. For example, Eurasian watermilfoil (Myriophyllum spicatum) may survive 7–9 h under still, dry conditions and longer if protected from exposure or under humid conditions (Dove and Wallis 1981), whereas adult zebra mussels (Dreissena polymorpha) may survive 3–5 d under extreme conditions (Ricciardi et al. 1994) and up to several weeks in wet fishing nets (Deksbakh 1935). The recent invasion of the exotic zebra mussel into the Great Lakes region provides a unique opportunity to study an invasion in progress, and to quantify rare, long-distance colonization probabilities. Zebra mussels have a large economic impact by fouling human-made structures. Consequently, numerous agencies and scientists survey for their presence (Wisconsin Sea Grant, US Fish and Wildlife Service, Wisconsin and Minnesota Departments of Natural Resources, and Tennessee Valley Authority [Johnson and Carlton 1996, Ralley 1997]). Furthermore, because no similar freshwater species exist in North America, zebra mussels are conspicuous and are usually detected even in small, isolated populations, making them an ideal system in which to study long-range colonization. Zebra mussels are sessile invertebrates with shortlived (5–10 d) planktonic, microscopic (100–300 mm) larvae (veligers). Over the past century zebra mussels invaded from Eastern to Western Europe via shipping channels (Ramcharan et al. 1992, Karatayev et al. 1997) and were detected in North America (Lake St. Clair, Michigan) in 1988 (Hebert et al. 1989). By 1990 zebra mussels occurred in all of the Great Lakes and their major tributaries, and by 1993, in the Mississippi River (Johnson and Padilla 1996). Inland waterbodies have been invaded more slowly. In Wisconsin, none of .15 000 inland lakes were invaded through 1993 (Padilla et al. 1996). By 1994, only five Wisconsin lakes had been invaded, and by winter of 1998 only one more had been invaded (Cliff Kraft, Wisconsin Sea Grant Institute, University of Wisconsin, Green Bay, Wisconsin, USA, 1995, personal communication). Wisconsin is an ideal site for exploring the zebra mussel invasion because it contains .15 000 lakes used by recreational boaters, ;10% of the population (representing 38.7% of all households) are registered boaters, and borders include potential sources of zebra mussels: Lake Michigan and the Mississippi River. Trailered boating activity is the most effective transport vector of adult and larval zebra mussels to inland waters (Carlton 1993, Johnson and Carlton 1996, Johnson and Padilla 1996). Although both adult and larval mussels are transported by trailered boats in live wells, attached to hulls, and attached to water weeds acci-
255
dentally transported, adult Dreissena are more likely than larvae to establish viable populations due to the dispersal of larvae once introduced (Carlton and Geller 1993, Johnson and Carlton 1996). To predict zebra mussel spread, we estimated annual spatial and temporal boater movements over a large geographic extent using a randomized survey of boater activity conducted by the Wisconsin Department of Natural Resources (WDNR). In this paper we contrast the present pattern of zebra mussel invasion with those predicted by boater movements and by simple diffusion models, and based on our analyses we provide management recommendations. MATERIALS
AND
METHODS
WDNR boater survey In 1989–1990, the WDNR conducted a randomized survey of boat use by the 505 880 boaters licensed in Wisconsin, 485 041 of which were Wisconsin motorboaters, and 5600 were Illinois, Iowa, and Minnesota residents living in counties adjacent to Wisconsin and the Chicago area. Survey data were collected by mailing a written questionnaire (twice if necessary) to 4200 randomly selected (without replacement) boat owners, 2000 of which were Wisconsin motorboaters, during each of twelve 2-wk periods during May through October 1989, and two 2-wk periods during April 1990. Collectively these data were assumed to represent boating traffic during a single boating season. Of the 58 800 surveys sent, 53 559 were returned, of which 39 839 were considered usable by the WDNR. Survey response rate was 80–81% for Wisconsin residents and 54–62% for residents of Illinois, Iowa, and Minnesota. Response rates ranged from 71 to 77% among survey periods, with an average of 74%. An average of 26% of the survey respondents boated in Wisconsin during any given 2-wk period. To extrapolate from survey sample results to the general population of boaters, the WDNR calculated weighting factors by dividing the population size by the sample size (number of 2-wk periods) (Penaloza 1991). The weighting factor for trailered motorboats was the total population of trailered motorboaters (485 041) divided by the sample size of trailered motorboats for each survey period (2000), or 243. Using this method, the WDNR estimated that the survey results represented 6.2 3 106 boater days of activity in Wisconsin during 1989–1990. Eighty-nine percent of the boater activity was on inland lakes or rivers (6 177 871 boater days), 9% on Lake Superior or Lake Michigan (620 860 boater days), and 2% on both inland waters and a Great Lake (138 750 boater days). Because trailered boats represented 98.6% of the boats registered in Wisconsin and they are more likely to transport zebra mussels (Carlton 1993, Johnson and Carlton 1996, Johnson and Padilla 1996), we limited our analysis to these boats. Survey data we used in-
256
Ecological Applications Vol. 9, No. 1
LUCY A. J. BUCHAN AND DIANNA K. PADILLA
cluded the names of the counties where boating occurred, the number of days boated in each county, whether boating occurred on both inland waterbodies and Great Lakes, and the name of the most frequently used waterbody during the 2-wk survey period. The format of the survey questions did not enable estimation of movement between inland lakes; therefore, the spatial resolution of our boater movement analysis was limited to counties. For each record we confirmed that the waterbody reported as most-used during the 2-wk period corresponded to one of the counties reported as visited during that same period. We assumed that boaters had more confidence in the name of the waterbody used than in the name of the county in which the waterbody was located; thus, 3% of the records were corrected by changing the county to agree with the waterbody. If more than one county was listed and none of the listed counties included the location of the waterbody most used, we determined which county listed was closest to the reported county-location of the waterbody, and changed the county to reflect the location of the waterbody. If the waterbody spanned more than one county, the county with the majority of records and the majority of boat launches (locations where boats can be set afloat) was recorded as the county in which the waterbody was located. Records with missing information were not used.
Analysis Intercounty boater movement was assumed to be in the direction of the order of the counties listed (e.g., county 1, 2, 3 was interpreted as movement from county 1 to county 2 to county 3). We compiled a list of all boating activity reported from source and destination counties and calculated a frequency distribution for movement distances. The distance boaters traveled was determined by measuring the straight-line distance between the centroids of the source and destination counties. We considered long-distance movements to be those that resulted in movement farther than 2 standard deviations greater than the mean distance moved within and among counties. Extreme long-distance movements were defined as travel distances greater than two standard deviations above the mean for boaters traveling just among counties. We calculated the 95% confidence intervals of our estimates of the proportion of boater movements that were long distance and extreme long distance (Snedecor and Cochran 1980), and for long-distance boater travel in New Zealand (Johnstone et al. 1985) and in British Columbia (Dove and Wallis 1981). Overall activity was determined for all boater movements and for extreme long-distance movements by summing the number of boater days by 2-wk periods. The number of boater days per 2-wk survey period were compared between the two distance groups to determine if temporal patterns in boater activity existed, and
if the timing of extreme long-distance boater activity differed from that of all other boater activity. We wanted to assess whether any factors associated with source (county of origin) or destination counties were correlated with extreme long-distance boater movements and could be used as predictors. Therefore, we considered factors associated with population size, numbers of registered boaters and lakes, and amount of lake surface area in counties, and selected three that were not highly correlated with each other (correlation coefficient ,0.45): number of registered boaters in a county, number of named lakes in a county, and total surface-water area per county. For these three factors, we tested for differences in source counties, destination counties, and the difference between source and destination counties for boater movements categorized as extreme long-distance or not, using a Mann-Whitney U test. Significance of comparisons was evaluated using a sequential Bonferroni correction (Rice 1989). Zebra mussels have been reported from six inland lakes in Wisconsin. We determined the number of times boaters reported traveling from counties with lakes containing zebra mussels and the average distance each boater traveled.
Diffusion modeling To estimate the rate and pattern of spread expected if boater-dispersed zebra mussel invasion occurred by diffusion, we used a simple derivation
VF 5 Ï4rD
(1)
of a classic diffusion and growth model developed by Fisher (1937), Skellam (1951), and Kierstead and Slobodkin (1953):
[
]
]N ]2N ]2N 5 f (N ) 1 D 1 2 ]t ]x ]y 2
(2)
where VF represents the velocity (in kilometers per year) of the advancing invasion front, r is the intrinsic rate of population growth, D is the diffusion coefficient (in square kilometers per year), N represents local population density at time t and at location x, y, and f(N) represents net population change from birth and death. Both equations assume that individuals move randomly in a homogeneous environment and that population growth is exponential. We estimated r as
ln
[ ] N (t) N (t 0 ) t
(3)
where t is time and N is population density of zebra mussels measured at two different time intervals (Higgins et al. 1996). To determine an appropriate range for r, we used published data on zebra mussel populations (Karatayev et al. 1997), and unpublished data from larval settling plates in lakes in Wisconsin (C. Craft, unpublished data). Estimates for r included 1.0,
PREDICTING SPREAD OF AQUATIC INVADERS
February 1999
257
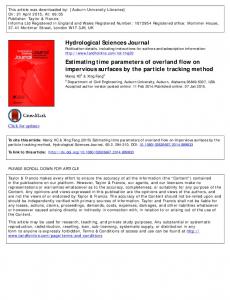
FIG. 1. Number of trailered boaters and distances traveled annually between Wisconsin counties, estimated from the Wisconsin Department of Natural Resources 1989–1990 boater survey (Penaloza 1991). Distances were measured from the centroid of the county where travel originated (source county) to the centroid of the county to which a boater traveled (destination county). Numbers to the right of arrowheads indicate the proportion of responding boaters who traveled more than the specified 50-km interval.
5.0, 10.0, and 15.0 (from 100 to 1500%). D was estimated as
D5P
1 N
O Dx 4D t
2
(4)
where P is the probability of transport, N is the number of annual boater movements, Dx2 is the square of the distance of boater movements (x, in kilometers), and t is the observation period (1 yr) (Okubo 1980). Using data on the probability of transport of zebra mussels (Johnson and Carlton 1996) and aquatic macrophytes (Dove and Taylor 1982) by trailered boaters, P was estimated as the product of the probabilities that boaters visit an infested lake and pick up zebra mussels, and that zebra mussels survive transport and survive in the destination lake (Buchan 1997). To demonstrate the influence of long-distance movements on predicted invasion rate and extent, we estimated D using all records of boater movement, and using only records reporting boater movements ,106 km (long-distance threshold). We mapped model predictions in a GIS (PC ARC/ INFO, Environmental Research Systems Institute, Redlands, California, USA) using a point coverage (National Biological Survey) of known adult zebra mussel populations along the Wisconsin shoreline of Lake Michigan, the Mississippi River, and inland Wisconsin lakes. RESULTS Boaters from all counties were represented in the WDNR survey results (39 839 boaters). Of this total,
10 506 respondents boated during the 2-wk survey period, and 10 175 used a trailered boat. We used 97% (9884) of these responses in our analysis and found potential for boater-mediated local and long-distance dispersal of aquatic organisms: 13.7% (1222 of 8946) of the respondents who used inland waterbodies (no Great Lake) boated in more than one county; 16.8% (180 of 1072) of the respondents used both a Great Lake and an inland waterbody. The average distance from the centroid of a county to an edge (determined by the radius of a circle with equal area) was 25 km, and this distance was used as the mean distance traveled by a boater staying within a county. Mean distance traveled by all boaters (intraand intercounty travel) was 34 km (total N 5 9094 respondents; mean 1 2 SD 5 106 km, N 5 311 longdistance boaters), and the mean intercounty distance traveled was nearly three times greater (mean 5 97 km, total N 5 1370 respondents; mean 1 2 SD 5 261 km, N 5 68 extreme long-distance boaters). The distribution of distances traveled by boaters was highly skewed to the right (Fig. 1). The probability of transport #50 km was 91.6 6 0.6%, long-distance travel (.106 km) occurred in 3.4 6 0.4% of all boater movements, and extreme long-distance travel (.261 km) occurred in only 0.8 6 0.2% of all boater movements (Table 1). Although rare overall, intercounty Wisconsin boater movements exhibited spatial patterns, occurring between only 11.8% of possible source and destination county pairs (Table 2). Few boaters traveled long distances; 62.1% of long-distance (.106 km) county pairs and 64.7% of extreme long-distance (.261 km) county
Ecological Applications Vol. 9, No. 1
LUCY A. J. BUCHAN AND DIANNA K. PADILLA
258
TABLE 1. Influence of sample size on the confidence of estimates of the proportion of boater movements that were long distance (3.4% . 106 km), and extreme long distance (0.8% . 261 km), based on the Wisconsin Department of Natural Resources 1989–1990 boater survey (Penaloza 1991).
TABLE 3. Differences between extreme long-distance (ELD, .261 km) movements and all boater movements for number of registered boaters, number of named lakes, and total lake area in counties that were the source and destination of movement (Mann-Whitney U test). Boater movements
Long-distance boater movement Sample size
CI
1 321 5 285 9 094 21 139
61.0 60.5 60.4 60.3
(%)
Extreme long-distance boater movement Sample size 1 861 3 308 9 092 29 775
CI
Factor tested
(%)
60.4 60.3 60.2 60.1
Notes: Sample size used 5 9094 responses to the survey. 5 95% confidence intervals of the estimates of long-distance and extreme long-distance boater movements. CI
pairs were reported by a single boater (Table 2). Multiple boaters traveled between 39.6% (239 of 603 respondents) of the reported county pairs. Of these trips 12.1% (118 of 979 respondents) were .106 km, and only 2.5% (24 of 979 respondents) were .261 km (Table 2). The temporal pattern of boater activity was similar whether boaters traveled extreme long-distances or not (Fig. 2). Most boating occurred from the middle of June through early September (Labor Day Holiday), peaking in early August. We found significant differences between extreme long-distance boater movements and all boater movements for every factor tested (Table 3). Extreme longdistance movements (Fig. 3) were associated with more registered boaters in source (Mann-Whitney U test, P 5 0.0021) and destination counties (Mann-Whitney U test, P 5 0.0001), as well as more named lakes (MannWhitney U test, P 5 0.0006), and greater total lake area (Mann-Whitney U test, P 5 0.0001) in destination counties than were all boater movements. As of winter 1998, there were six inland lakes in Wisconsin where zebra mussel adults or veligers were
All
P value
8886 8636 250
0.0021† 0.0001† 0.5057
ELD
Boaters Source county Destination county Source 2 Destination
12 091 12 041 50
Named lakes Source county Destination county Source 2 Destination
175 218 243
Lake area (ha) Source county Destination county Source 2 Destination
6465 8134 21669
120 120 0.22 4880 4156 724
0.0515 0.0006† 0.2128 0.0202 0.0001† 0.0420
Notes: Cell values for boater movements are means calculated from the Wisconsin Department of Natural Resources 1989–1990 boater survey (Penaloza 1991). † Statistical significance using the sequential Bonferroni correction for multiple tests (Rice 1987).
reported at least once (Table 4). Of the 1147 waterbodies cited as most used in the survey, these lakes ranked in the top 6.3%. Inland lakes with zebra mussels were used more often by boaters moving within counties than those that moved between counties (Table 4). Boaters that stayed within a single county visited lakes containing zebra mussels relatively frequently (11.7– 49.6%) compared to other waterbodies within the respective counties. Intercounty boaters used lakes invaded by zebra mussels less frequently (2.3–30.6%) than other lakes in the county. In only one case did a boater who used an inland lake containing zebra mussels report a long-distance movement (215 km [Lake Geneva, Waukesha County, to Portage County]) or an extreme long-distance movement (403 km [Silver Lake, Kenosha County, to Vilas County]). However,
TABLE 2. Movement patterns of boaters responding to the Wisconsin Department of Natural Resources 1989–1990 boater survey (Penaloza 1991) reported by the frequency of specific source–destination intercounty boater movement. Frequency of intercounty boater movement
Number of boaters
Total number of records
Median
Minimum
Maximum
LD
ELD
1 2 3 4 5 6–7 8–9 10–19 20–30
364 92 45 40 15 27 12 8 2
364 184 135 160 75 169 100 106 60
113 65 58 50 49 44 44 44 38
22 30 19 19 28 28 35 28 38
455 402 331 331 219 68 71 53 38
193 58 30 20 10 0 0 0 0
44 10 6 8 0 0 0 0 0
Number of boater movements
Distance traveled (km)
Notes: Frequency is the number of times specific intercounty movement was reported by individual boaters. Data in column 2 are the number of boaters reporting different intercounty movements (N 5 603 of 5112 possible intercounty pairs). For example, 92 different intercounty paths were reported by two different boaters. Total number of records is the number of boaters multiplied by the frequency class. Distances were measured between the centroids of source and destination counties. Long-distance (LD) boater movements were defined as those .106 km (N 5 311 respondents). Extreme long-distance (ELD) boater movements were .261 km (N 5 68 respondents).
PREDICTING SPREAD OF AQUATIC INVADERS
February 1999
259
FIG. 2. Number of days of boater activity during 2-wk survey periods reported in the Wisconsin Department of Natural Resources 1989–1990 boater survey (Penaloza 1991) for (A) all boaters, and (B) boaters traveling .261 km (extreme long distances). The 14 2-wk survey periods represent a single boating season; therefore, the figure represents annual boater activity.
11 long-distance boater movements occurred from Lake Michigan to uninvaded inland lakes. Of boaters that visited Lake Michigan, 5.4% also visited inland lakes containing zebra mussels, but none of these were long-distance movements.
Because parameters for diffusion models are difficult to estimate accurately, and invasion velocities are particularly sensitive to values of r, we estimated invasion rates for a range of values of r estimated from data for recently invaded populations. The invasion velocities
TABLE 4. Volume of recreational boating on Wisconsin lakes where zebra mussel adults or veligers had been reported as of winter 1998 to Wisconsin Sea Grant. Usage rank 1 represents the greatest number of uses. Number (percentage) of records
Percentage of lake use
County and lake
Usage rank
Within-county use only
Intercounty use
Walworth county Geneva Lake†
4
30.6
25
16 (7.8%) 4 (8.3%)
49.6
Beulah Lake‡
190 (92.2%) 44 (91.7%)
11.7
6.5
Waukesha county Okauchee Lake‡
13
67 (98.5%)
1 (1.5%)
14.1
2.3
Kenosha county Powers Lake‡
59
8.3
49
3 (12.0%) 4 (14.3%)
15.6
Silver Lake†
22 (88.0%) 24 (85.7%)
17.0
11.1
19 (95.0%)
1 (5.0%)
35.9
11.1
Sheboygan county Elkhart Lake†
72
Within-county only
Intercounty boaters
Notes: Lakes were ranked by the volume of boater use for all lakes (N 5 1147 reported lake uses) reported in the Wisconsin Department of Natural Resources 1989–1990 boater survey (Penaloza 1991). The number of times lakes were used is reported for boaters using the named lake and staying within the county, and for boaters using the named lake and also boating in other counties. Volume of lake use is presented as the percentage of intracounty boater activity and as the percentage of intercounty boater activity. † Adult zebra mussels reported. ‡ Veligers reported.
260
LUCY A. J. BUCHAN AND DIANNA K. PADILLA
Ecological Applications Vol. 9, No. 1
FIG. 3. Extreme long-distance (ELD) boater movements (.261 km) that were reported in the Wisconsin Department of Natural Resources 1989–1990 boater survey (Penaloza 1991) by more than one trailered boater. Arrows indicate source-todestination travel. Numbers indicate the number of respondents reporting the same path of travel.
predicted by the diffusion model using all boater records to estimate the diffusion coefficient were 1.0 km/ yr, 2.2 km/yr, 3.1 km/yr, and 3.8 km/yr for r equal to 1.0, 5.0, 10.0, and 15.0, respectively (Fig. 4). When we estimated the diffusion coefficient using only records ,106 km, invasion velocities were lower: 0.6 km/ yr (r 5 1.0), 1.3 km/yr (r 5 5.0), 1.9 km/yr (r 5 10.0), and 2.3 km/yr (r 5 15.0). The straight-line distance from the Lake Michigan shoreline to the six invaded boater-accessible lakes ranged from 28 to 57 km. Therefore, none of the above models correctly predicted the invasion dates for these six lakes; models that included long-distance boater records to estimate D predicted that the invasion front would reach a maximum distance of 27.9 km (r 5 10.0) and 34.2 km (r 5 15.0) by the end of 1997, thereby predicting invasion at a later date to two of the six lakes where zebra mussels have been observed (Fig. 4). DISCUSSION Although rare, long-distance dispersal events are important to predict because they increase the maximum
rate of geographic spread of invading species (Moody and Mack 1988, Hengeveld 1994). By definition rare events are infrequent and thus difficult to estimate accurately. For freshwater exotic species such as zebra mussels, recreational trailered boat traffic is a major dispersal vector. Fortunately, unlike other major dispersal vectors for invading species, humans can be asked where and when they traveled, which facilitates obtaining a sample size large enough to detect rare dispersal events with confidence. By analyzing boater movements surveyed by the WDNR, we accurately estimated spatially explicit rates of long-range vector dispersal independently of zebra mussel occurrence data. This approach to estimating dispersal probabilities is statistically powerful and applicable to any invading species that relies on human dispersal and invades island habitats, including most marine and freshwater species as well as terrestrial species living on true or habitat islands. Invasion caused by long-distance dispersal of invading species is both rare and stochastic (Moody and Mack 1988, Hengeveld 1994). Therefore, boater move-
February 1999
PREDICTING SPREAD OF AQUATIC INVADERS
261
FIG. 4. Maximum geographic extent of zebra mussel invasion predicted by simple reaction–diffusion models (described in Eq. 1) and observed pattern of the zebra mussel invasion in Wisconsin. Panels A–D depict model results when D (diffusion coefficient; see Eq. 1) was estimated using all boater movements reported in the Wisconsin Department of Natural Resources 1989–1990 boater survey (Penaloza 1991), and r 5 15.0 (A), r 5 10.0 (B), r 5 5.0 (C), r 5 1.0 (D); maximum predicted invasion velocities were 1.0, 2.2, 3.1, and 3.8 km/yr, respectively. Not illustrated: invasion velocities were 33–40% slower when D was estimated using boater movements ,106 km. Sites invaded by zebra mussels were mapped using a GIS (PC ARC/INFO) coverage (National Biological Survey).
262
LUCY A. J. BUCHAN AND DIANNA K. PADILLA
ments may be used to predict invasion patterns, with the understanding that invasion, i.e., successful boatermediated dispersal, will be stochastic. We found that long-distance and extreme long-distance boater movements were predictable in both time and space. Peak periods of travel were similar for both extreme longdistance boaters and all boaters, occurring between mid-June and Labor Day weekend, and coinciding with periods of reproduction for exotic species that have invaded Wisconsin, such as the zebra mussel and Eurasian watermilfoil. Boaters traveled between about one-tenth of the possible intercounty travel paths, and the majority of these travel paths were reported by only one boater. Long-distance boater travel was numerically abundant once the sample results were extrapolated to the entire boating population. Using a weighting factor of 243 actual annual boater events for each reported boater event, in a boating season 75 573 boaters traveled .106 km, and 16 524 boaters traveled .261 km. Using the mean percentage of boaters (8%) departing from lakes with zebra mussels attached to boating equipment estimated by Johnson and Carlton (1996), 5895 of long-distance and 1289 of extreme long-distance annual boater travel could transport zebra mussels. However, the probability of successful invasion is likely lower than such dispersal estimates indicate. Successful invasion depends on the probability that zebra mussels attach to a dispersal vector, remain attached during travel, survive travel, are deposited in an aquatic environment suitable for growth and reproduction, and successfully reproduce in their new environment (Buchan 1997). The frequency of long-distance and extreme longdistance movements detected in the WDNR survey could be used by other researchers studying the spread of invading aquatic species to determine appropriate sample sizes. Other researchers have estimated distances traveled by boaters from sample sizes smaller than ours, resulting in less confident estimates of longdistance movement that may not accurately detect important spatial patterns that will drive the spread of aquatic invaders. Johnstone et al. (1985) surveyed 565 recreational boaters and found that only 24.5% of N 5 144 responding boaters traveled between lakes, of which 9.7 6 5.0% moved .125 km. Of a sample of 826 boaters in British Columbia, Canada, Dove and Wallis (1981) found that all boaters moved between two lakes, and 13.0 6 2.2% traveled .125 km. We compared confidence intervals of our estimates of longdistance boater travel to those from smaller sample sizes. Survey samples will have to be relatively high to accurately predict boater transport of exotic species; long-distance movements would have been reasonably detected with half of the current sample size, but lower sample sizes would have made it considerably more difficult to accurately detect extreme long-distance movements. Much larger sample sizes would be required to reduce our confidence intervals .30%.
Ecological Applications Vol. 9, No. 1
Because we have been explicit in defining our spatial and temporal scales of resolution and extent, and our large sample size provides confidence in our estimates, our results could be tested for their generality in landscapes with similar geographic features, such as other states and Canadian provinces in the Great Lakes region. Extreme long-distance boating movements were more likely to occur between counties with high numbers of registered boaters, between counties with large areas covered by lakes, and to counties with large numbers of named lakes. At least two extreme long-distance boater movements were reported for each of the seven counties with the highest reported volume of boater activity. Therefore, movements most likely to have the greatest impact on the maximum rate of geographic spread of invading aquatic species are correlated with the following county metrics: high volume of boater activity, large number of registered boaters, high numbers of lakes, and large cumulative lake surface area.
Assessment of modeling strategies Most current models used to predict the rate increase of species ranges are deterministic, such as reaction– diffusion (R–D) models (Cantrell and Cosner 1991, Mollison 1991, Holmes 1993, Hastings 1994, Hengeveld 1994), which assume random individual movement occurring in a homogeneous environment and exponential population growth. Although diffusion and reaction–diffusion (R–D) models are good descriptors of historic spread for some species (Lubina and Levin 1988, Andow et al. 1990), in many cases they greatly underestimate the rate of spread (Hengeveld 1989, Andow et al. 1990, van den Bosch et al. 1990, Allen et al. 1991, Hengeveld 1994). Invasion rate and pattern include both an increase in geographic extent, described by R–D models, and invasion of suitable habitats within the range, which no models adequately describe (Johnson and Padilla 1996). We found that simple R–D models did not predict the observed invasion rate and pattern for zebra mussels in Wisconsin over the entire range of parameter values for D and r; all models underestimated the geographic extent of spread within Lake Michigan and to inland lakes and overestimated spread to inland lakes from the Mississippi River. Invasion velocities were higher when D was predicted using estimates of boater movement that included shorter and longer distances than when only short-distance (,106 km) movements were included. In both cases, however, estimates were heavily weighted by the majority (85%) of very shortdistance movements (,25 km). Therefore, even the highest predicted invasion velocity (3.8 km/yr for r 5 15, and D estimated using all boater records) did not correctly predict any of the observed invaded lakes, and the invasion of suitable habitats within the predicted geographic extent (26.6 km by 1995) was greatly overestimated. By the end of 1995, this model predicted that 75 boater-accessible lakes (with public boat
February 1999
PREDICTING SPREAD OF AQUATIC INVADERS
launches) would be invaded; however, adult zebra mussels were found in only three boater-accessible lakes and three additional boater-accessible lakes had veligers (Padilla et al. 1996). Since 1995, no more adult zebra mussels or veligers have been detected in inland waterbodies. Therefore, predicted invasion velocities through 1997 overestimated invasion success by 35 boater-accessible lakes. By analyzing nonrandom individual boater behavior, our modeling approach improves the spatial resolution and accuracy of invasion estimates and provides information that is more likely to help prevent or slow the zebra mussel invasion. For example, all six invaded lakes were within the top 6.3% of lakes visited most frequently by recreational boaters, and all of these lakes were used by at least one boater who had also boated in Lake Michigan within the survey period (Padilla et al. 1996). Of the lakes predicted invaded by the end of 1995 by the diffusion model, only 61.3% (46/75) were listed in the WDNR survey, and only seven of these lakes (15.2%) were included in the 100 most frequently visited lakes listed in the survey. Of the additional lakes predicted to be invaded by the end of 1997 by the diffusion model, only 71.4% (25/35) were listed in the WDNR survey, and only seven of these lakes (20%) were included in the 100 most frequently visited lakes listed in the survey. R–D models are frequently used to predict invasions for species that live in terrestrial or marine environments where organisms usually survive even if they are not in their preferred habitat. Habitats for freshwater species, however, are extremely isolated by large inhabitable areas of land and are not uniformly distributed on the landscape, and unlike marine or terrestrial species, freshwater organisms cannot disperse part of the way to a new habitat and survive. Therefore, many of the assumptions of simple R–D models are violated when examining invasion processes in freshwater habitats, and these models may poorly predict observed invasion rates for freshwater species invasions. Most simple R–D models assume that dispersal distances are normally distributed, whereas measured dispersal curves are frequently skewed or leptokurtic and will influence estimates of D (Hastings 1994, Kot et al. 1996). Although we used the skewed distribution of boater movement to estimate D, the model still underestimated the observed invasion rate. A commonly observed invasion pattern is a slow initial rate of spread that abruptly accelerates and eventually reaches an asymptotic invasion velocity. In some cases the initial slow rate of spread is attributable to an Allee effect (Lewis and Kareiva 1993, Kot et al. 1996, Veit and Lewis 1996), which is not represented in simple R–D models. R–D model predictions of invasion velocities have improved by including an agestructured Allee effect (Lewis and Kareiva 1993, Hengeveld 1994, Kot et al. 1996, Veit and Lewis 1996), but adequate data do not exist for zebra mussel pop-
263
ulation growth to develop and test similar models. The diffusion model results we present, however, could be interpreted to account for a lag in population growth similar to an Allee effect. For example, if a 5-yr lag was estimated for zebra mussel population growth, the maximum invasion rate could be estimated as the geographic extent predicted through 1992. In that case a model using r 5 15 and D estimated from all boater movements would underestimate the observed geographic extent, predicting a maximum invasion velocity of 11.5 km/yr, and still overestimate invasion of suitable habitat within the predicted range. Therefore, incorporating an Allee effect into a simple R–D model will not likely make it a better predictive model for zebra mussel invasion than a model such as ours, which incorporates spatially explicit dispersal movement.
Conclusions An important immediate application of our results is to guide management strategies by predicting the rate and pattern of spread of the zebra mussel in the Great Lakes region. Initial efforts to manage zebra mussels and other aquatic invasions should focus on boater movements from Lake Michigan since it has been invaded by zebra mussels for the longest period of time, has the largest population of zebra mussels, and is the major initial source of new invading aquatic species in the Great Lakes region (Mills et al. 1993). Waterbodies used frequently by boaters coming from Lake Michigan were identified by Padilla et al. (1996) and Buchan (1997). Theoretical models developed by Moody and Mack (1988) showed that the most effective means of restricting the geographic spread of invading species is to detect and eradicate small new invasion foci caused by long-distance dispersal events. Therefore, once these waterbodies are invaded, the subsequent rate and extent of spread will be most affected by longdistance and extreme long-distance boater movements. To slow or stop the spread of exotics such as zebra mussels, management efforts should focus on the few high frequency long-distance paths; on the areas with large numbers of registered boaters, large areas covered by lakes, and the highest boater activity; and on destinations of boaters coming from lakes invaded by zebra mussels. Education can effectively slow the rate of aquatic invasion (Dove and Wallis 1981); therefore, these criteria may also be used to target areas for education concerning the potential for spread of exotics between waterbodies. Indeed, the reduced rate of new invasions of zebra mussels in Wisconsin lakes since 1995 may be the result of increased awareness and education about the zebra mussel invasion problem. We have shown that certain rare, long-distance boater movements can be accurately estimated and used to predict the probability of invasion for aquatic invaders, such as the zebra mussel. While our model does not explicitly predict an invasion rate, it provides annual estimates of spatially explicit movement patterns that
264
LUCY A. J. BUCHAN AND DIANNA K. PADILLA
can be incorporated into spatially and temporally dynamic models (Buchan 1997). Invasion models that incorporate such geographically explicit information are essential for understanding and predicting the rate and especially the pattern of spread of exotic species, and may be used to generate testable hypotheses about invasion processes. Patterns of likely invasion, as we determined from the WDNR boater survey, can be tested in Wisconsin as the zebra mussel invasion progresses and may be informative for other states and provinces in the Great Lakes region. ACKNOWLEDGMENTS We thank M. Koutnik who provided the initial impetus for the project and discovered the data set used in this paper. We also thank C. Teigs for help acquiring the data set, B. Feeny and C. Staude for the artwork, the Wisconsin DNR for access to their boater survey, the Director and staff at the Friday Harbor Laboratories for facilities, N. Williams for his financial support for L. A. J. Buchan, and M. Turner, J. Magnuson, M. Clayton, S. Ventura, R. Stein, and two anonymous reviewers for their comments. This research was supported by grants from WARF to D. K. Padilla and by the University of Wisconsin Sea Grant Institute under grants from the National Sea Grant College Program, National Oceanic and Atmospheric Administration, U.S. Department of Commerce, and the State of Wisconsin. Federal grant number NA90AA-DSG469, NA46RG0481 and grant number NA116RG0531-01, project number R/LR65 to D. K. Padilla. LITERATURE CITED Allen, L. J. S., E. J. Allen, and C. R. G. Kunst. 1991. A diffusion model for dispersal of Opuntia imbricata (Cholla) on rangeland. Journal of Ecology 79:1123–1135. Andow, D. A., P. M. Kareiva, S. A. Levin, and A. Okubo. 1990. Spread of invading organisms. Landscape Ecology 4:177–188. Buchan, L. A. J. 1997. Predicting invasion patterns of nonindigenous aquatic species. Dissertation. University of Wisconsin-Madison, Madison, Wisconsin, USA. Cantrell, R. S., and C. Cosner. 1991. Insular biogeographic theory and diffusion models in population dynamics. Theoretical Population Biology 15:177–202. Carlton, J. T. 1993. Dispersal mechanisms of the zebra mussel Dreissena. Pages 677–697 in T. F. Nalepa and D. W. Schloesser, editors. Zebra mussels: biology, impacts, and control. Lewis (CRC Press), Ann Arbor, Michigan, USA. Carlton, J. T., and J. B. Geller. 1993. Ecological roulette: the global transport of nonindigenous marine organisms. Science 261:78–82. Deksbakh, N. K. 1935. Spread of Dreissena polymorpha Pallas (Mollusca) in the European part of the USSR and the factors responsible for their spread. Byulleten Moscowskogo Obschestva Ispyatelei Pirody. Otdelenie Biologii 44: 153–163 (in Russian). Dove, R., and B. Taylor. 1982. Studies on aquatic macrophytes part XXXVI. The 1981 aquatic plant quarantine project. Assessment and Planning Division Bulletin 18. Province of British Columbia Ministry of Environment, Victoria, British Columbia, Canada. Dove, R., and M. Wallis. 1981. Studies on aquatic macrophytes part XXXIV. The 1980 aquatic plant quarantine project. APD Bulletin 17. Province of British Columbia Ministry of Environment, Victoria, British Columbia, Canada. Fisher, R. A. 1937. The wave of advance of advantageous genes. Annals of Eugenics (London) 97:355–369.
Ecological Applications Vol. 9, No. 1
Hastings, A. 1994. Conservation and spatial structure: theoretical approaches. Page 100 in S. A. Levin, editor. Frontiers in mathematical biology. Lecture notes in biomathematics. Springer-Verlag, New York, New York, USA. Hebert, P. D. N., B. W. Muncaster, and G. L. Mackie. 1989. Ecological and genetic studies on Dreissena polymorpha (Pallas): a new mollusc in the Great Lakes. Canadian Journal of Fisheries and Aquatic Sciences 48:1381–1388. Hengeveld, R. 1989. Dynamics of biological invasions. Chapman and Hall, London, England. Hengeveld, R. 1994. Small-step invasion research. Trends in Ecology and Evolution 9:339–342. Higgins, S. I., D. M. Richardson, and R. M. Cowling. 1996. Modeling invasive plant spread: the role of plant–environment interactions and model structure. Ecology 77:2043– 2054. Holmes, E. E. 1993. Are diffusion models too simple? A comparison with telegraph models of invasion. American Naturalist 142:779–795. Johnson, L. E., and J. T. Carlton. 1996. Post-establishment spread in large-scale invasions: the relative roles of leading natural and human-mediated dispersal mechanisms of the zebra mussel, Dreissena polymorpha. Ecology 77:1686– 1690. Johnson, L. E., and D. K. Padilla. 1996. Geographic spread of exotic species: ecological lessons and opportunities from the invasion of the zebra mussel, Dreissena polymorpha. Biological Conservation 78:23–33. Johnstone, I. M., B. T. Coffey, and C. Howard-Williams. 1985. The role of recreational boat traffic in interlake dispersal of macrophytes: a New Zealand case study. Journal of Environmental Management 20:263–279. Karatayev, A. Y., L. E. Burlakova, and D. K. Padilla. 1997. The effects of Dreissena polymorpha (Pallas) invasion on aquatic communities in Eastern Europe. Journal of Shellfish Research 16:187–203. Kierstead, H., and L. B. Slobodkin. 1953. The size of water masses containing plankton bloom. Journal of Marine Research 12:141–147. Kot, M., M. A. Lewis, and P. van den Driessche. 1996. Dispersal data and the spread of invading organisms. Ecology 77:2027–2042. Levin, S. A., T. M. Powell, and J. W. Steele. 1993. Patch dynamics. Springer-Verlag, Berlin, Germany. Lewis, M. A., and P. Kareiva. 1993. Allee dynamics and the spread of invading organisms. Theoretical Population Biology 43:141–158. Lubina, J. A., and S. A. Levin. 1988. The spread of a reinvading species: range expansion in the California sea otter. The American Naturalist 131:526–543. Mills, E. L., J. H. Leach, J. T. Carlton, and C. L. Secor. 1993. Exotic species in the Great Lakes: a history of biotic crises and anthropogenic introductions. Journal of Great Lakes Research 19:1–54. Mollison, D. 1991. Dependence of epidemic and population velocities on basic parameters. Mathematical Biosciences 107:255–287. Moody, M. E., and R. N. Mack 1988. The spread of plant invasions: the importance of nascent foci. Journal of Applied Ecology 25:1009–1021. Okubo, A. 1980. Diffusion and ecological problems: mathematical models. Springer-Verlag, New York, New York, USA. Padilla, D. K., M. A. Chotkowski, and L. A. J. Buchan. 1996. Predicting the spread of zebra mussels (Dreissena polymorpha) to inland waters using boater movement patterns. Global Ecology and Biogeography Letters 5:353–359. Penaloza, L. J. 1991. Boating pressure on Wisconsin’s lakes and rivers. Results of the 1989–1990 Wisconsin recreational boating study, phase I. Technical Bulletin 174. Wis-
February 1999
PREDICTING SPREAD OF AQUATIC INVADERS
consin Department of Natural Resources, Madison, Wisconsin, USA. Ralley, W. 1997. Zebra mussel update—Province of Manitoba. DREISSENA! 8:1–3. National Aquatic Nuisance Species Clearinghouse, New York Sea Grant, Brockport, New York, USA. Ramcharan, C. W., D. K. Padilla, and S. I. Dodson. 1992. Models to predict the potential occurrence and density of the zebra mussel, Dreissena polymorpha. Canadian Journal of Fisheries and Aquatic Sciences 49:2611–2620. Ricciardi, A., R. Serrouya, and F. G. Whoriskey. 1994. Aerial exposure tolerance of zebra and quagga mussels (Bivalvia: Dreissenidae): implications for overland dispersal. Canadian Journal of Fisheries and Aquatic Sciences 52:470– 477. Rice, W. R. 1989. Analyzing tables of statistical tests. Evolution 43:223–225.
265
Skellam, J. G. 1951. Random dispersal in theoretical populations. Biometrika 38:196–218. Snedecor, G. W., and W. R. Cochran. 1980. Statistical methods. Iowa State University Press, Ames, Iowa, USA. van den Bosch, F., J. A. J. Metz, and O. Diekmann. 1990. The velocity of spatial population expansion. Journal of Mathematical Biology 28:529–565. Veit, R. R., and M. A. Lewis. 1996. Dispersal, population growth, and the Allee effect: dynamics of the house finch invasion of eastern North America. American Naturalist 148:255–274. Vitousek, P. M. 1994. Beyond global warming: ecology and global change. Ecology 75:1861–1876. U.S. Congress, Office of Technology Assessment. 1993. Harmful nonindigenous species in the United States. Report Number OTA-F-565. United States Government Printing Office, Washington, D.C., USA.