African Journal of Biotechnology Vol. 8 (10), pp. 2050-2059, 18 May, 2009 Available online at http://www.academicjournals.org/AJB ISSN 1684–5315 © 2009 Academic Journals
Full Length Research Paper
Estimation of genetic diversity in rice (Oryza sativa L.) genotypes using SSR markers and morphological characters K. Seetharam, S. Thirumeni* and K. Paramasivam Department of Plant Breeding and Genetics, Pandit Jawaharlal Nehru College of Agriculture and Research Institute, Karaikal, U.T. of Puducherry, India. Accepted 25 July, 2008
Thirty rice genotypes comprising land races, pure lines, somaclones, breeding lines and varieties specifically adapted to costal saline environments were characterized by SSR markers and morphological characters in this study. Out of 35 primers of SSR markers, 28 were found to be polymorphic. The PIC value ranged from 0.064 (RM 274) to 0.72 (RM 580) with an average of 0.46. The Jaccard’s similarity coefficient ranged from 0.42 to 0.90. At the genetic similarity of 56% the genotypes were grouped into five clusters. PCA components explained 41.6% of variation. There was overlapping of tolerant genotypes and susceptible genotypes within the cluster. Morphological traits of each genotype were measured on five randomly chosen plants. The matrix of average taxonomic distance was estimated using Euclidian distance. The average taxonomic distance ranged from 1.5 to 7.78. At a Euclidean distance of 3.49, the 30 genotypes were grouped into IV clusters. The clustering pattern clearly grouped the genotypes based on their response to salinity and clustering was not based on their geographical origin. PCA components explained 38.4% of variation. Key words: Rice, salt tolerance, SSR markers, cluster analysis. INTRODUCTION Rice is an important food crop for the entire world population. While active efforts are being made to increase rice productivity, a considerable amount of rice biomass for which genetic potential exists in the present-day cultivars is not harvested under field conditions, primarily because of the sensitivity of this crop to various stresses (Widawsky and O’Toole, 1990). Rice is a salt-sensitive crop, increasing its salt tolerance has enormous implications. The strategy to overcome this problem is genetic improvement of salinity tolerance in present day varieties (Epstein et al., 1980). Genetic diversity in plants has been traditionally assessed using morphological or physiological traits. The assessment of phenotype may not be a reliable measure of genetic differences as gene
*Corresponding author. E-mail:
[email protected]. Abbreviations: PCR, Polymerase Chain Reaction; SSR, Simple Sequence Repeats.
expressions were influenced by environment. Further, this is aggravated in screening for salt tolerance as any change in environment alters salt tolerance among the genotypes (Yeo et al., 1990). On the other hand, identified genetic variations based on DNA polymorphism are abundant and independent of environmental factor. DNA markers that differentiate genotype are more reliable and convenient than physiological or morphological characters in the identification and characterization of genetic variation (Zeng et al., 2004). Among various PCR based markers, SSR markers are more popular in rice because they are highly informative, mostly mono locus, co-dominant, easily analysed and cost effective (Chambers and Avoy, 2000). The genetic variation, as identified by morphological characters and molecular markers, may be useful in breeding for abiotic stress. Therefore, the present investigation was undertaken with the objective of estimating genetice diversity in a set of salt tolerant suce genotypes using SSR markers and morphological characters.
Seetharam et al.
2051
Table 1. Details of genotypes
S . NO 1 2 3 4 5 6 7 8 9 10 11 12 13 14 15 16 17 18 19 20 21 22 23 24 25 26 27 28 29 30
Genotypes Chitteani Chettivirippu Wag wag Nonabokra Ketumbar Pokkali Jhona IR 72582-10-1-1-3-1 IR 72593-B-3-2-1-2 IR 73678-6-9-B IR 72579-B-2R-1-3-2 IR 72593-B-13-3-3-1 IR 71991-3R-2-6-1 BTS 10-10 BTS 10-12 BTS 24 BTS 17-20 BTS 11-7 CST 7-1 IET 18709 KR 0004 KR 0015 KR 0029 KR 0009 CSR 10 CSR 13 CSR 23 TRY 2 Improved White Ponni MI 48
Pedigree Land race Land race Land race Land race Land race Land race Land race IR 9884 // IR 20 / IR 26 IR 69195 / IR 20 / IR 24 IR 9884 / Oryza rufipogan CSR10 // IR20 / IR26 IR 69195 / IR20 / IR24 IR5 / IR 52713 Somaclone of Pokkali Somaclone of Pokkali Somaclone of Pokkali Somaclone of Pokkali Somaclone of Pokkali C CSR 1 / IR 24 Jaya / CSR 23 IET 14543 / TRY 1 SSRC 92076 / TRY 1 IR 70866-B-P-7-2 SSRC 92076 / TKM 9 M-40-431-24-114 / Jaya CSR 1/ Basmati 370 / CSR 5 IR 64 // IR 4630-22-2-5-1-3 / IR 9764-45-2-2 IET 6238 / IR 36 Taching 65 / 2 ME80 -
Origin Kerala, India Kerala, India Philippines West Bengal, India Indonesia Kerala, India Pakistan IRRI,Philippines IRRI,Philippines IRRI,Philippines IRRI,Philippines IRRI,Philippines IRRI,Philippines CARI, Port Blair, A&N Islands CARI, Port Blair, A&N Islands CARI, Port Blair, A&N Islands CARI, Port Blair, A&N Islands CARI, Port Blair, A&N Islands Canning Town, West Bengal CSSRI, Karnal , India PAJANCOA& RI, Karaikal , India PAJANCOA& RI, Karaikal , India PAJANCOA& RI, Karaikal , India PAJANCOA& RI, Karaikal , India CSSRI, Karnal , India CSSRI, Karnal , India CSSRI, Karnal , India Tamil Nadu, India Tamil Nadu, India CSSRI, Karnal , India
IRRI - International Rice Research Institute, Philippines PAJANCOA & RI - Pandit Jawaharlal Nehru College of Agriculture and Researche Institute, Karaikal. CSSRI - Central Soil Salinity Research Institute, Karnal. CARI - Central Agriculture Research Institute, Port Blair, Andaman and Nicobar Islands.
MATERIALS AND METHODS Plant material Thirty rice genotypes (Table 1) comprising land races, purelines, somaclones, breeding lines and varieties specifically adapted to costal saline environments were chosen in the study. This includes Pokkali and MI48 as tolerant and susceptible checks, respectively. DNA extraction and SSR marker analysis DNA was extracted from five day old young leaves using CTAB method (Dellapota et al., 1983). Thirty-five SSR markers, covering all the 12 chromosomes of rice, were selected from the Genome Databases, Rice Genes Microsatellite Markers (http:/ars_genome.cornell.edu/rice/microsats.html). These primer sequences were synthesized by Sigma Aldrich Inc. Bangalore. PCR reactions were carried out in PTC (Programmable Thermal Cycler) MJ research Inc. USA. The reaction volume was 15 µl containing 2 µl of genomic DNA, 1X assay buffer, 200 µM of dinucleotides, 2 µM
MgCl2, 0.2 µM each primer and 1 unit of Taq polymerase (Banglore Genei). The temperature cycles were programmed as 95oC for 2 min, 94oC for 45 s, 55oC for 1 min, 72oC for 1:30 s for 34 cycles and additional temperature of 72oC for 10 min for extension and 4oC for cooling. The amplified products were separated in 2.5 percent metamorpho agarose gel prepared in 0.5X TBE buffer stained with ethidium bromide. The gel was run in 0.5X TBE buffer at constant voltage of 90 V for a period of 45 min to 1 h. The gel was visualized in UV transilluminator and photographs taken using Alpha Digidoc gel documentation instrument. Clearly resolved, unambiguous bands were scored visually for their presence or absence with each primer. The scores were obtained in the form of matrix with ‘1’ and ‘0’, which indicate the presence and absence of bands in each variety respectively. Morphological characteristics All the 30 genotypes were screened for salt tolerance in field condition (soil-EC-5.50, pH-9.20 and irrigation water EC-3.10, pH-
2052
Afr. J. Biotechnol.
8.60, SAR- 18.83 and RSC-10.83) and the trials were carried out in Randomized Block Design with three replications and each genotype was raised in three rows of one-meter length. Morphological characters viz., Days to 50 per cent flowering, plant height, total tillers, productive tillers, panicle weight, panicle length, spikelet fertility, 100 grain weight, single plant yield were recorded from five randomly chosen plant. Data analysis Statistical analyses for the morphological and SSR marker data were conducted using the software NTSYS-pc version 2.1 (Exeter software, Setauket, NY). The morpho-physiological characters were standardized prior to cluster analysis. The matrix of average taxonomic distance for individuals and morphological traits was then computed using SIMINIT function and EUCLIDIAN distance coefficient. This dissimilarity coefficient is based on interval measure data collected for the morpho-physiological traits. Cluster analysis was then conducted on the taxonomic distance matrix with the Unweighted Pair Group Method based on Arithmetic Average (UPGMA) and a dendrogram was generated based on the genetic distance matrix. For analyses based on SSR markers data from all the markers were used to estimate the similarity on the basis of the number of shared bands. Similarity was calculated with SIMQUAL function of NTSYS that computes a variety of similarity and dissimilarity coefficients for qualitative data. The similarity matrix values based on Dice coefficient of similarity were calculated. The similarity matrix thus generated was used to generate dendrogram based on UPGMA. In order to estimate the congruence among dendrograms, cophenetic matrices for which marker and index type were computed and compared using the Mantel test. Principal component analysis was performed in order to highlight the resolving power of the ordination. Polymorphic information content that provides an estimate of the discriminatory power of a locus or loci, by taking into account not only the number of alleles that are expressed, but also relative frequencies of those alleles, was estimated using the formula suggested by Nei (1973). PIC = 1-
Table 2. Allelic variation and PIC values for SSR markers identified in 30 rice genotypes.
SSR LOCUS RM274 RM 515 RM 580 RM 539 RM 481 RM 215 RM 21 RM 561 RM443 RM315 RM7
Number of alleles 2 2 4 2 3 2 3 2 3 3 2
PIC values 0.064 0.278 0.720 0.420 0.551 0.278 0.598 0.391 0.551 0.558 0.504
RM428 RM224
3 3
0.504 0.631
RM234 RM247 RM152 RM131
3 3 2 2
0.558 0.598 0.491 0.464
RM273 RM 440
2 3
0.391 0.460
RM332 RM464 RM410 RM411 RM412
2 2 3 2 2
0.391 0.391 0.580 0.410 0.36
RM413 RM414
2 3
0.490 0.570
RM415
2
0.410
x2k
Where, x2k represents the frequency of the kth allele.
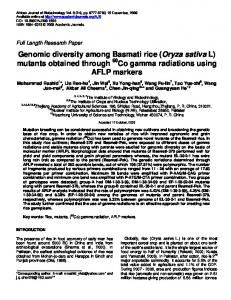
RESULTS AND DISCUSSION Genetic diversity based on SSR markers data In the amplification of genomic DNA of the 30 rice genotypes, using 35 primers of SSR markers, 28 were found to be polymorphic. The number of amplified fragments ranged from two to four. Of the total amplified bands the average polymorphic fragment per primer is 2.48. The PIC value ranged from 0.064 (RM274) to 0.72 (RM 580) (Table 2) with an average of 0.46 (Figure 1). Similar studies were reported in rice, barely and wheat (Lu et al., 2005; Sjakste et al., 2003; Röder et al., 2002). Dendrogram based on UPGMA analysis grouped the 30 genotypes into different clusters. The Jaccard’s similarity co efficient ranged from 0.42 to 0.90 (Table 3). At the genetic similarity of 66% the genotypes were grouped into five clusters (Figure 2). Each cluster distinguishes the genotypes clearly from the other. Cluster I had all the
landraces which were cultivated in Kerala, Cluster II had all the breeding lines which were developed in IRRI Philippines, cluster III had the somaclones that were selected from Pokkali and some advanced breeding lines, cluster IV and V had released varieties. Similarly at the genetic similarity of 66% the main clusters can be divided into sub clusters. Genotypes with in cluster III are further grouped into three sub clusters. The clusters IIIA and IIIB comprised of somaclones and IIIC comprised of advanced breeding lines and varieties. The genetic similarity between the genotypes ranged between 0.25 (IR 7199-3R-2-6 and Jhona) and 0.87 (KR 0015 and KR 0029). Though the clustering pattern grouped the genotypes based on pedigree but it failed to group the genotypes based on their salt tolerance. There was overlapping of tolerant genotypes and susceptible genotypes with in the cluster. This may be due the markers used might not have covered the genomic regions harbouring salt tolerant genes. PCA components explained 41.6 % of variation. Genotypes viz Pokkali, Ketumbar and IET 18709 were found to be distinct from other (Figure 3).
Seetharam et al.
1
2
13
14
25
26
3
4
15
27
16
28
5
6
7
8
17
18
19
20
29
30
L
9
10
21
11
22
12
23
L
24
L
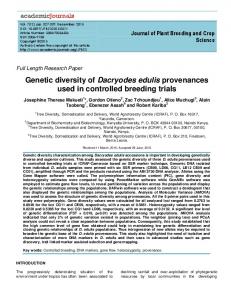
Figure 1. Gel profile showing the amplification of SSR primer RM 21 with all 30 genotypes. The number above the lane indicates the genotype number as in Table 1 and L indicates100 bp ladder-Bangalore Genei.
Figure 2. Clustering of all 30 rice genotypes based on SSR marker data.
2053
2054
Afr. J. Biotechnol.
Table 3. Similarity coefficient based on SSR markers (above diagonal) and genetic distances based on morphological characters (below diagonal).
! "
#" "
"$ #
$
# "
#" """
## " $
%& ! !
%& !
%& '
! " #
$
%&
' ' ' ' '
%&
' ' ' ' '
%&
' ' '
%&
' ' &' ' '
%&
' ' ' ' '
%&
' &' ' ' ()
'
()
'
() ()
'
()
'
)( ' & & & %* ( (&+ %!
,
#
- % )& )& )& . & %&
!
%&
&%
!!!'
!!
!! #
(%
!#
% )
* '
&
"
&
"
&
!
+
!!!#
Seetharam et al.
Table 3. Contd.
! " #
$
%&
' ' ' ' '
%&
' ' ' ' '
%&
' ' '
%&
' ' &' ' '
%&
' ' ' ' '
%&
' &' ' ' ()
'
()
'
() () ' () ' )( ' & & & %* ( (&+ % # - % )& )& )& . &
2055
2056
Afr. J. Biotechnol.
Table 4. Mean salt tolerant indices of different characters of the 30 rice genotypes
Genotypes Chitteani Chettivirippu Wag wag Nona Bokra Ketumbar Pokkali IR 72582-10-1-1-3-1 IR 72593-B-3-2-1-2 IR 73678-6-9-B IR 72579-B-2R-1-3-2 IR 72593-B-13-3-3-1 IR 71991-3R-2-6-1 BTS 10-10 BTS 10-12 BTS 24 BTS 17-20 BTS 11-7 CST 7-1 KR 0004 KR 0015 ER 0029 IET 18709 TRY 2 Improved White Ponni CSR 13 CSR 23 CSR 10 Jhona KR 0009 Mean S.E C.D (5%)
Days to 50 per cent flowering *
0.91 * 0.92 * 0.89 * 0.91 * 0.90 * 0.92 0.83 0.80 0.90 0.82 0.79 0.71 0.87* 0.73 0.69 0.68 0.79 0.78 0.82 0.77 0.69 0.91 0.65 * 0.90 * 0.90 0.77 0.84 0.78 * 0.86 0.82 0.015 0.030
Plant height (cm) *
0.94 0.91 0.83 * 0.96 * 0.94 0.79 0.80 0.74 0.91 0.81 0.80 0.92 0.55 0.83 0.92 0.75 0.85 0.80 0.91 * 0.93 * 0.72 * 0.96 * 0.94 0.53 * 0.93 * 0.95 0.87 0.92 * 0.97 0.85 0.036 0.074
Productive tillers
Panicle length (cm)
Total tillers
0.73 * 0.87 * 0.86 0.70 * 0.77 * 0.85 0.79 0.25 0.78 0.46 0.56 0.72 0.39 0.48 0.65 0.67 0.41 0.47 0.39 0.54 * 0.83 0.58 * 0.89 0.41 * 0.86 0.72 0.73 0.70 0.70 0.64 0.088 0.181
0.87 0.72 0.83 0.88 0.89 0.94 0.97 0.97 0.83 0.75 0.85 076 0.87 0.86 0.97 0.96 0.85 0.95 0.94 0.94 0.74 0.80 0.96 0.82 0.61 0.85 0.84 0.65 0.91 0.85 0.076 0.155
0.95 0.72 0.68 0.64 0.76 * 0.96 0.72 0.33 * 0.86 048 0.58 0.83 0.37 0.53 0.68 0.70 0.56 0.47 0.36 0.51 * 0.84 0.58 * 0.93 0.45 * 0.96 0.76 0.82 0.64 0.62 0.65 0.097 0.198
*
Panicle weight (g) *
0.92 * 0.93 0.59 * 0.93 0.56 * 0.95 0.74 0.68 * 0.95 0.49 0.65 0.71 0.74 0.81 0.73 0.67 0.72 0.52 0.78 0.83 0.69 0.66 * 0.95 0.46 * 0.96 * 0.95 0.94 0.68 0.81 0.75 0.440 0.059
Spikelet fertility (per cent) * 0.99 * 0.98 0.89 * 0.99 * 0.97 * 0.98 0.85 0.80 * 0.99 * 0.94 0.82 0.91 0.90 0.87 0.89 0.94 0.89 0.90 0.91 * 0.94 0.91 * 0.93 * 0.95 0.76 * 0.98 * 0.99 0.98 0.88 0.88 0.91 0.013 0.028
100 grain weight (g)
Single plant yield (g)
0.96 * 0.91 0.91 0.92 0.89 0.96 0.83 0.88 0.84 0.87 0.89 0.94 * 0.97 * 0.99 0.90 0.67 0.74 0.91 0.60 0.89 0.60 0.91 0.87 0.77 0.83 0.80 0.87 0.81 0.76 0.85 0.059 0.121
0.93 * 0.91 * 0.78 * 0.89 0.67 * 0.93 0.48 0.33 * 0.91 0.49 0.48 0.51 0.44 0.49 0.65 0.68 0.61 0.56 0.56 0.54 0.65 0.61 0.69 0.29 * 0.86 * 0.90 0.91 0.46 0.77 0.64 0.072 0.147
Seetharam et al.
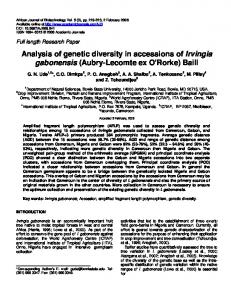
Figure 3. Three dimensional plot of principal component analysis of using morphological data of the 30 rice genotypes. The numbers plotted represents individual cultivars corresponds to the ones listed in Table 1.
Figure 4. Clustering of all 30 rice genotypes base on morphological data.
2057
2058
Afr. J. Biotechnol.
Figure 5. Three dimensional plot of principal component analysis of using morphological data of all 30 rice rgenotypes The numbers plotted represents individual cultivars corresponds to the ones listed in Table 1.
Genetic diversity characteristics
based
on
morphological
Morphological traits of each genotype were measured on five randomly chosen plants in each replication. Analysis of variance revealed significant genotypic differences, but non significant replication difference, hence average of the three replications was taken for further analysis. Taxonomic distance based on plant morphological character was estimated after standardization. The matrix of average taxonomic distance was estimated using Euclidian distance. The average taxonomic distance ranged from 1.5 to 7.78. The cluster analysis was conducted on average taxonomic distance with UPGMA method. At a Euclidean distance of 3.49 the 30 genotypes were grouped into IV clusters (Figure 4). Among them cluster II was found to have large number of genotypes. When the genotype in the each cluster were compared with the morphological data it was found that genotypes in cluster I were tolerant, genotypes in cluster II were moderately tolerant and moderately susceptible and the genotypes in
the cluster III and IV were highly susceptible. Further at Euclidean distance of 3.49 the cluster II can be sub divided as cluster IIA and cluster IIB. Based on the salt tolerance indices of morphological data (Table 4) subcluster IIA have moderately susceptible genotypes and subcluster IIB have moderately tolerant genotypes. The clustering pattern clearly grouped the genotypes based on their response to salinity and clustering was not based on their geographical origin. PCA components explained 38.4% of variation (Figure 5). Similar results were earlier reported by Zeng et al. (2004). Conclusion The best measure to analyze genetic diversity among genotypes would be with the use of all information, both from morphological characters and DNA based markers. Molecular marker data and morphological data subjected to various numerical and taxonomical techniques measured the relationship among the genotypes (Kumar et
Seetharam et al.
al., 2003). The genotypes which found to diverse based on both by morphological and molecular diversity can be used for further breeding program. REFERENCES Chambers M, Avoy M (2000). Comparision of microsatellite and amplified fragment length polymorphism markers for parentage analysis. Mol. Ecol. 9: 1037-1048. Dellapota SL, Woode J, Hicks JB (1983). A plant DNA minipreperation : Version 2, plant mol. Biol. rep. 1: 10-22. Epstein E, Norlyer JD, Rush DW, Kingsbury RW, Kelly DB, Cnningham GA, Wrona AF (1980). Saline culture of crops: A Genetic approach. Science. 210: 399-404. Kumar P, Singh K, Vikal Y, Randhawa LS, Chahal GS (2003). Genetic diversity studies of elite cotton germplasm lines using RAPD markers and morphological characters. Indian J. Genet. 63(1): 5-10. Lu H, Redus MA, Coburn JR, Rutger JN, McCouch SR, Tai TH (2005). Population structure and breeding patternsof 145 U.S. rice cultivars based on SSR marker analysis. Crop Sci. 45: 66-76. Nei M (1973). Analysis of gene diversity in subdivided populations. Proc. Natl. Acad. Sci. USA. 70: 395-401. Röder MS, Wendehake K, Korzun V, Bredemeijer G, Laborie D, Bertrand L, Isaac P, Rendell S, Jackson J, Cooke RJ, B, Vosman, Ganal MW (2002). Construction and analysis of a microsatellitebased database of European wheat varieties. Theor. Appl. Genet. 106: 67-73.
2059
Sjakste TG, Rashal I, Röder MS (2003). Inheritance of microsatellite alleles in pedigrees of Latvian barley varieties and related European ancestors. Theor. Appl. Genet. 106: 539-549. Widawsky DA, O’Toole JC (1990). Prioritizing the rice biotechnology research agenda for eastern India. The Rockfeller foundation, News letter 86pp. Yeo AR, Yeo ME, Flowers SA, Flowers TJ (1990). Screening of rice genotypes for physiological characters contributing to salinity resistance and their relationship to overall performance. Theor. Appl. Genet. 79: 377-384. Zeng L, Kwon TR, Liu X, Wilson C, Grieve CM, Gregorio GB (2004). Genetic diversity analysed by microsatellite markers among rice (Oryza sativa L.) genotypes with different adaptation to saline soils. Plant Sci. 166: 1275-1285.