Body Weight and Egg Weight Dynamics in Layers R. J. DI MASSO,*,†,‡ A. M. DOTTAVIO,*,‡ Z. E. CANET,* and M. T. FONT,†,‡,1 *Ca´tedra de Gene´tica y Biometrı´a, Facultad de Ciencias Veterinarias, Ovidio Lagos y Ruta 33, CC 166, 2170 Casilda, Argentina, †Instituto de Gene´tica Experimental, Facultad de Ciencias Me´dicas, Santa Fe 3100, 2000 Rosario, Argentina, and ‡Consejo de Investigaciones, Universidad Nacional de Rosario, Santa Fe 3100, 2000 Rosario, Argentina ABSTRACT The association between body weight-age and egg weight-age patterns was studied in a segregating population of laying hens belonging to the F3 generation of a Rhode Island Red × White Leghorn reciprocal cross. Body weight and egg weight were expressed as a function of time using the model developed by Weatherup and Foster. Each hen was characterized in terms of its asymptotic body weight (ABW), maturing rate for body weight (MBW), asymptotic egg weight (AEW), and maturing rate for egg weight (MEW) values. Four groups of hens were distinguished by means of a principal component analysis. Birds belonging to Groups 1 and 3 were discriminated for their egg weight-age pattern. Group 1 included hens laying the heaviest eggs (AEW = 66.1 g)
at the lowest maturing rate (MEW = 0.922), the inverse being true for birds in Group 3 (AEW = 55.7 g and MEW = 0.737). Birds belonging to Groups 2 and 4 were distinguished for their body weight-age pattern. Hens in Group 2 showed the lowest ABW (1,893 g) and MBW (0.764) whereas the heaviest (ABW = 2,802 g) and less mature (MBW = 0.929) birds were found in Group 4. The results confirm the partial pleiotropic basis of the body weight-egg weight correlation, evincing the feasibility of applying selective pressure not only on each character separately but also on maturing rate independently of asymptotic weight within each trait. This strategy could be implemented using a biological selection index based on principal component analysis equations.
(Key words: body weight, egg weight, Weatherup and Foster model, principal component analysis, layer) 1998 Poultry Science 77:791–796
low asymptotic weight and a high maturing rate (Grossman and Bohren, 1985). This advantage is so in laying birds because, in contrast to meat-type poultry, growth is not important per se but it is obviously necessary for hens to attain the productive phase of their cycle. Therefore, an early maturing light bird would express two propitious features in comparison with other growth patterns, a short nonproductive phase prior to sexual maturity and low maintenance costs. With regard to egg weight, it might be advantageous to have laying hens producing, quickly and regularly, eggs within a limited weight range (Poggenpoel and Duckitt, 1988). In addition, body weight and egg weight show a positive genetic correlation (Siegel, 1962; Festing and Nordskog, 1967) and, as the egg represents the marketable product, a compromise exists between reducing body weight while keeping commercially acceptable egg weights. This relationship was considered by Nordskog and Briggs (1968) when discussed the body weight-egg production paradox.
INTRODUCTION Growth is a complex biological process resulting from genetic factors and environmental circumstances, which is usually represented, both in domestic and experimental animals, as an age-dependent S-shaped change in body weight. The dynamic of this time-related change can be described by means of different mathematical models such as the four-parameters Richards model (Richards, 1959) and its variants, the logistic, Gompertz, and von Bertalanffy equations (Krause et al., 1967; Knizetova et al., 1983; Grossman and Bohren, 1985; Grossman et al., 1985; Ricklefs, 1985; Zelenka et al., 1986; Kachman et al., 1988; Barbato, 1991). From an economics point of view, certain associations between the two most relevant parameters that characterize such models (average size at maturity and maturing rate) are more desirable than others for animal production purposes. In layers, for example, an advantageous growth pattern would be the combination of a
Received for publication May 15, 1997. Accepted for publication February 17, 1998. 1To whom correspondence should
[email protected]
be
Abbreviation Key: ABW = asymptotic body weight; AEW = asymptotic egg weight; MBW = maturing rate for body weight; and MEW = maturing rate for egg weight.
addressed:
791
792
DI MASSO ET AL.
In poultry, genetic variation for body weight has been determined and exploited in different experiments of body growth selection (Siegel, 1962; Festing and Nordskog, 1967; Krause et al., 1967; Marks, 1978; Dunnington and Siegel, 1985). Similarly, egg weight, alone or combined with other traits, has been extensively used as a selective criterion (Festing and Nordskog, 1967; Kolstad, 1980; Liljedahl and Weyde, 1980; Sorensen et al., 1980). Both variables are usually measured at specific ages or during a specific period of time along the laying cycle, reducing an intrinsically dynamic process to a static determination. This approach reduces the potential information that experimental data could yield about the phenomenon under study (Cock, 1966). This paper discusses the association between body weight-age and egg weight-age patterns in a segregating population of laying hens, using a longitudinal analysis in accordance with the dynamic nature of both processes. This approach could be applied in poultry to define selective criteria in genetic improvement plans.
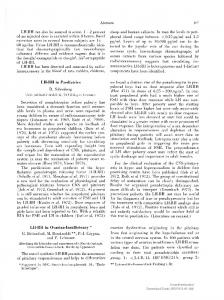
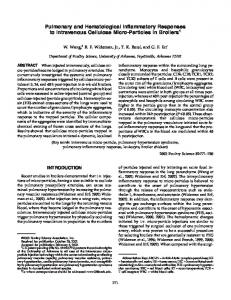
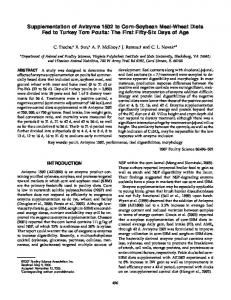
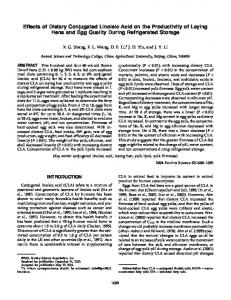
FIGURE 1. Scatterplot of the two first principal components, with the ordination plane partitioned using Lefkovitch’s method. Group 1: First quadrant (⁄), Group 2: Second quadrant (+), Group 3: Third quadrant (◊), and Group 4: Fourth quadrant (π).
MATERIALS AND METHODS A random sample of 50 hens belonging to the F3 generation of a Rhode Island Red × White Leghorn reciprocal cross was used. Parental lines belong to the stocks maintained at the Facultad de Ciencias Veterinarias, Universidad Nacional de Rosario, Casilda, Repu ´ blica Argentina. Birds hatched in spring were collectively floor reared under natural photoperiod until 18 wk of age, and then individually caged under a minimum of 14 h lighting. Hens were maintained under identical managemental conditions. Individual body weights were registered weekly to the nearest 10 g from 18 to 48 wk of age. All the eggs laid in the same period were identified and weighed the evening of the same day to the nearest 0.1 g. Body weights and egg weights for each individual were expressed as a function of time using the equation (Y = A – B rt) of Weatherup and Foster (1980), where A = mature body weight or mature egg weight; B = the range in body weight or egg weight from t = 0 to the asymptote; and r = the rate at which the respective mature weight is approached (r < 1). The same model was used for fitting both response variables because, on the one hand it is a reparameterization of Brody’s exponential growth equation (Brody, 1945), a special case of Richards function (Richards, 1959) and, on the other hand, it adequately describes how egg weight increases with age in various commercial avian species (Shalev and Pasternak, 1993). Estimation was by nonlinear least squares (Draper and Smith, 1981), using an iterative procedure via Marquardt’s (1963) algorithm. Goodness of fit was evaluated by the coefficient of determination (R2). Each hen was described by the following traits: asymptotic body weight (ABW), maturing rate for body weight (MBW), asymptotic egg weight (AEW), and maturing rate for egg weight (MEW).
Four groups of layers were defined by means of a principal component analysis (Tatsuoka, 1971). Firstly, a two-dimensional ordination was obtained in which every point (hen) had as its coordinates two scores obtained from two different linear combinations of the aforementioned four traits (ABW, MBW, AEW, and MEW). Secondly, a divisive classification was performed by partitioning the ordination plane using Lefkovitch’s (l976) method. Two divisions were made by breaking the x-axis and the y-axis of the Cartesian coordinate system at their respective centroids. As a consequence, four quadrants were defined, numbered from one to four in counterclockwise order. Hens in each quadrant were identified and their individual body weight-age and egg weight-age curves were fitted. In both cases, estimations of A and r were considered as new variables. Differences among groups (quadrants) were evaluated by one-way analysis of variance (Sokal and Rohlf, 1969) and when statistically significant, the means were separated by Duncan’s multiple range test (Kramer, 1956). A discriminant analysis (Kleinbaum and Kupper, 1978) was performed to corroborate differences among groups in their jointly considered body weight and egg weight patterns.
RESULTS The proportion of the total variance accounted for by the two first principal components was 79% (Figure 1). The first principal component (Y1) showed a positive and significant correlation with the four traits included in the analysis: ABW, MBW, AEW, and MEW (Table 1). Accordingly, the highest Y1 values corresponded to hens with the highest asymptotic body weight and the lowest
793
BODY WEIGHT AND EGG WEIGHT IN LAYERS TABLE 1. First (Y1) and second (Y2) principal component equations and Pearson’s correlation coefficients between body weight-age and egg weight-age curves parameters and principal component values1
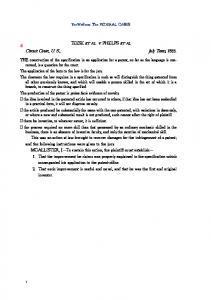
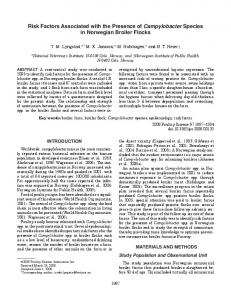
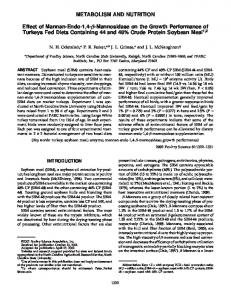
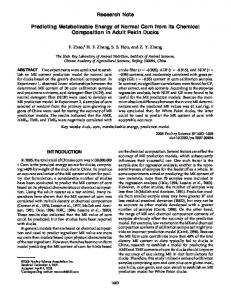
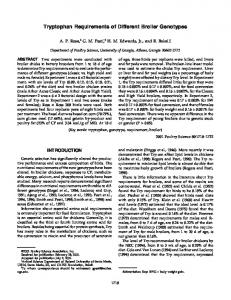
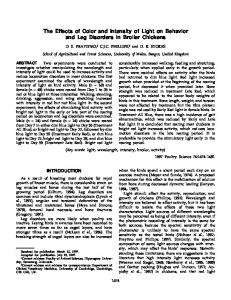
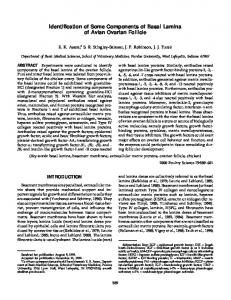
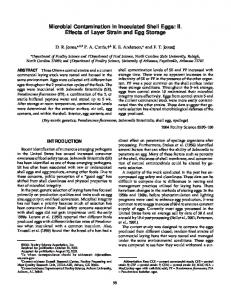
their body weight-age and egg weight-age patterns when they were simultaneously considered, as a high proportion of the observations (more than 92%) were correctly classified. Parameter estimates for growth curves and egg weight patterns are presented in Tables 4 and 5, respectively. The R2 values indicate an excellent agreement between the curve estimated by the proposed mathematical model and the experimental observations. Figures 2 and 3 illustrate theoretical body weights and egg weights, respectively, for each group using the Weatherup and Foster equation (1980) plotted against hen age.
Pearson’s correlation coefficients (r) Variable
Y1
Y2
Asymptotic body weight (ABW) Maturing rate for body weight (MBW) Asymptotic egg weight (AEW) Maturing rate for egg weight (MEW)
0.781 0.643 0.763 0.602
–0.424 –0.622 0.439 0.658
11st principal component Y = 0.5570 ABW + 0.4583 MBW + 0.5436 1 AEW + 0.4293 MEW. 2nd principal component Y2 = –0.3886 ABW – 0.5694 MBW + 0.4025 AEW + 0.6023 MEW.
DISCUSSION maturing rate for body weight (> r) and the highest asymptotic egg weight and the lowest maturing rate for egg weight. The second principal component (Y2) showed a negative correlation with both body weight traits, whereas a positive correlation was evident for the same characters for egg weight (Table 1). In consequence, hens with the highest Y2 values showed the lowest asymptotic body weight and the highest maturing rate for this variable jointly with the highest asymptotic egg weight and the lowest maturing rate for egg weight. The partitioning of the scatterplot for the first two principal components (Y1: x-axis and Y2: y-axis) allowed the identification of four groups of hens (Figure 1 and Table 2). Birds belonging to Groups 1 and 3 (first and third quadrant, respectively) were discriminated for their egg weight-age pattern. Group 1 included hens laying the heaviest eggs (AEW = 66.1 ± 2.18 g) at the lowest maturing rate (MEW = 0.922 ± 0.009), the inverse being true for birds in Group 3 (AEW: 55.7 ± 0.98 g; MEW: 0.737 ± 0.025). Birds belonging to Groups 2 and 4 (second and fourth quadrants respectively) were distinguished for their body weight-age pattern. Hens in Group 2 showed the lowest ABW (1,893 ± 46 g) and the highest MBW (0.764 ± 0.029) whereas the heaviest (2,802 ± 116 g) and less mature (0.929 ± 0.008) birds were found in Group 4. Table 3 shows the results of a discriminate analysis performed with data distributed in these four groups. This technique confirmed differences between groups in
Body weight and egg weight are two relevant productive traits in poultry. Body weight has shown to be highly responsive to selection in chickens and genetic improvement for growth has been basically performed selecting for body weight at fixed ages. Genetic modification of body weight in meat-type chickens increased feed intake, body fat, and age at sexual maturity and decreased reproductive performance as undesirable correlated responses to artificial selection (Barbato, 1991), whereas, in laying hens, a correlated modification of egg weight and a decline in egg production and other components of reproductive fitness have been described by Festing and Nordskog (1967) as a consequence of selection for body weight. On the other hand, egg weight is also highly heritable in chickens and its economic implications are obvious. In layers, each 1-g increment in average egg weight may improve income by about 4% whereas in meat-type poultry, the same increase may enhance marketing weight by 2 to 13 g (Shalev and Pasternak, 1993). The genetic antagonism based on the positive genetic correlation between body weight and egg weight indicates the necessity to develop particular strategies for combining in the same bird a desirable weight-age pattern for both productive traits, implying a simultaneous change in both weight-age trajectories. Among the different possible approaches available to change the shape of these curves are 1) to apply selection pressure at discrete points on the curve, 2) to construct a selection index to exert selective pressure simultaneously at all
TABLE 2. Nonlinear least squares estimates (mean ± standard error) of Weatherup and Foster equation parameters for individual body weight-age and egg weight-age data of hens grouped by means of a principal component analysis
Variable
Group 1 Quadrant 1 (n = 11)
Asymptotic body weight, g Maturing rate for body weight Asymptotic egg weight, g Maturing rate for egg weight
2,344.17 0.8704 66.11 0.9217
a–cValues
± 103.09a ± 0.0161a ± 2.18a ± 0.0093a
Group 2 Quadrant 2 (n = 12) 1,892.85 0.7636 57.07 0.8650
with different superscript differ significantly (P < 0.05).
± ± ± ±
Group 3 Quadrant 3 (n = 12) 46.46b 0.0293b 0.98b 0.0171b
2,194.98 0.8715 55.72 0.7370
± 105.58a ± 0.0153a ± 0.98b ± 0.0254c
Group 4 Quadrant 4 (n = 15) 2,801.72 0.9294 60.86 0.8611
± 116.01c ± 0.0081c ± 1.12c ± 0.0115b
794
DI MASSO ET AL. TABLE 3. Discriminant analysis—Results of between groups classification analysis Contrast between groups
False (–)
Sensibility
False (+)
1 1 1 2 2 3
8.3 8.3 9.1 0 0 0
91.7 91.7 90.9 100 100 100
0 0 6.7 0 0 6.3
Specificity
Discriminant rate
100 100 93.3 100 100 93.7
95.7 95.7 92.3 100 100 96.3
(%) vs vs vs vs vs vs
2 3 4 3 4 4
points of the curve, or 3) to determine a mathematical function and then to develop an optimum curve by selecting for desired values of parameters of this function (Grossman and Bohren, 1985). Festing and Nordskog (1967) studied the response to selection for body weight and egg weight in White Leghorns and concluded that these characters are evidently controlled by both independent and pleiotropic genes. A dynamic study of the same traits in a segregating population of layers derived from a reciprocal cross between two genotypes with different asymptotic body weight showed that egg weight and body weight increase monotonically with age approaching an asymptote. As both sets of longitudinal data showed a similar behavior, they were fitted with the same mathematical model. This pattern is typical of the curve relating egg weight and age of hen (Cowen et al., 1964; Weatherup and Foster, 1980; Shalev and Pasternak, 1993; Minvielle et al., 1994) whereas for body weight-age, data results from using postinflexion growth values (Brody, 1945). This dynamic approach allowed us to discriminate four growth patterns divided in two subgroups (Groups 1 and 4 vs Groups 2 and 3) with very similar 20-wk body weights within subgroup but different between them, and with different asymptotic weight within subgroup. With regard to maturing rate, there were three categories ranking from the earliest maturing hens with the lowest r value (Group 2) to the late maturing birds belonging to Group 4 (with the highest r value). Hens in Quadrants 1 and 3 showed similar
maturing rates for body weight, a condition made evident in the parallelism of their growth curves. Groups 1 and 4, with the highest ABW, showed different patterns of egg size increase with age. The birds belonging to the first quadrant had a higher initial egg weight and a lower maturing rate than those allocated in Quadrant 4. As a consequence, average egg weight of layers in Group 1 still increased at 50 wk of age whereas the same trait was nearly stabilized for hens in Group 4. Hens localized in the other two quadrants (Groups 2 and 3) displayed a differential behavior related to maturing rate but not to AEW. In accordance with the positive genetic correlation between body weight and egg weight, those birds with the highest MBW (Groups 1 and 4) showed also the highest AEW but hens in Group 1 were lighter and laid heavier eggs than hens in Group 4. The remaining groups (2 and 3), with similar average MEW, exhibited significantly different MBW. These differences among groups in their jointly considered body weight and egg weight patterns were corroborated by the discriminant analysis.
TABLE 4. Nonlinear least squares estimates of Weatherup and Foster equation parameters for mean body weight-age data of hens grouped by means of a principal component analysis1 Variable Location
A
1st quadrant 2nd quadrant 3rd quadrant 4th quadrant
2,306.54 1,876.74 2,137.73 2,711.77
1A
B (g) 13,192.89 124,671.75 11,585.42 5,002.37
r
R2
0.8625 0.7600 0.8718 0.9258
0.962 0.950 0.983 0.991
= asymptotic body weight; B = range in body weight from t = 0 to A; r = maturing rate for body weight; and R2 = coefficient of determination.
FIGURE 2. Theoretical mean body weight-age curves of laying hens grouped by means of a principal component analysis. Group 1: First quadrant (⁄), Group 2: Second quadrant (+), Group 3: Third quadrant (◊), and Group 4: Fourth quadrant (π).
BODY WEIGHT AND EGG WEIGHT IN LAYERS TABLE 5. Nonlinear least squares estimates of Weatherup and Foster equation parameters for mean egg weight-age data of hens grouped by means of a principal component analysis1 Variable Location
A
1st quadrant 2nd quadrant 3rd quadrant 4th quadrant
66.58 56.52 55.66 60.66
B
r
R2
0.9212 0.8714 0.7629 0.8426
0.987 0.971 0.984 0.980
(g) 139.38 436.39 14,496.08 1,076.14
1A = asymptotic egg weight; B = range in egg weight from t = 0 to A; r = maturing rate for egg weight; and R2 = coefficient of determination.
The results confirm the partial pleiotropic basis of the genetic correlation between body weight and egg weight, evincing the feasibility of applying an independent selective pressure on each character; also, within each trait, applying independent selection pressure on maturing rate separately from asymptotic weight, modifying both weight-age patterns at the same time. Perhaps this type of strategy could be accomplished by means of a biological selection index based on principal component analysis equations as it has been proposed by Godshalk and Timothy (1988). Although the heritable basis of the various combinations of traits in the four groups of hens herein described has not yet been demonstrated, such a procedure would potentially eliminate those problems associated with conventional selection indexes (Hazel, 1943), such as errors in genetic parameter estimates and difficulties in assigning relative economic weight to traits.
FIGURE 3. Theoretical mean egg weight-age curves of laying hens grouped by means of a principal component analysis. Group 1: First quadrant (⁄), Group 2: Second quadrant (+), Group 3: Third quadrant (◊), and Group 4: Fourth quadrant (π).
795
REFERENCES Barbato, G. F., 1991. Genetic architecture of growth curve parameters in chickens. Theor. Appl. Genet. 83:24–32. Brody, S., 1945. Bioenergetics and Growth. Reinhold Publishing Corp., New York, NY. Cock, A. G., 1966. Genetical aspects of metrical growth and form in animals. Q. Rev. Biol. 41:131–190. Cowen, N. S., B. B. Bohren, and H. E. McKean, 1964. Increase in pullet egg size with age. Poultry Sci. 43:482–486. Draper, N. R., and H. Smith, 1981. Applied regression analysis. John Wiley and Sons, New York, NY. Dunnington, E. A., and P. B. Siegel, 1985. Long-term selection for 8-week body weight in chickens. Direct and correlated responses. Theor. Appl. Genet. 71:305–313. Festing, M. F., and A. W. Nordskog, 1967. Response to selection for body weight and egg weight in chickens. Genetics 55:219–231. Godshalk, E. B., and D. H. Timothy, 1988. Factor and principal component analyses as alternatives to index selection. Theor. Appl. Genet. 76:352–360. Grossman, M., and B. B. Bohren, 1985. Logistic growth curve of chickens: heritability of parameters. J. Hered. 76:459–462. Grossman, M., B. B. Bohren, and V. L. Anderson, 1985. Logistic growth curve of chickens: a comparison of techniques to estimate parameters. J. Hered. 76:397–399. Hazel, L. N., 1943. The genetic basis for constructing selection indexes. Genetics 28:476–490. Kachman, S. D., R. L. Baker, and D. Gianola, 1988. Phenotypic and genetic variability of estimated growth curve parameters in mice. Theor. Appl. Genet. 76:148–156. Kleinbaum, D. G., and L. L. Kupper, 1978. Applied Regression Analysis and Other Multivariable Methods. Duxbury Press, Boston, MA. Knı´zetova´, H., B. Knı´ze, J. Hya´nek, R. Siler, L. Hya´nkova´, J. Plachy, and M. Vilheimova´, 1983. Growth curves of highly inbred lines of fowl and their F1 hybrids. Genet. Sel. Evol. 15:533–558. Kolstad, N., 1980. Scandinavian selection and crossbreeding experiment with laying hens. III. Results from the Norwegian part of the experiment. Acta Agric. Scand. 30: 261–287. Kramer, C. Y., 1956. Extension of multiple range tests to group means with unequal numbers of replications. Biometrics 12:307–310. Krause, G. F., P. B. Siegel, and D. C. Hurst, 1967. A probability structure for growth curves. Biometrics 23:217–225. Lefkovitch, L. P., 1976. Hierarchical clustering from principal coordinates: an efficient method for small to very large numbers of objects. Math. Biosci. 31:157–174. Liljedahl, L. E., and C. Weyde, 1980. Scandinavian selection and crossbreeding experiment with laying hens. II. Results from the swedish part of the experiment. Acta Agric. Scand. 30:237–260. Marks, H. L., 1978. Growth curve changes associated with long term selection for body weight in Japanese quail. Growth 42:129–140. Marquardt, D. W., 1963. An algorithm for least-squares estimation of nonlinear parameters. J. Soc. Indust. Appl. Math. 11:431–441. Minvielle, F., P. Me´rat, J. L. Monvoisin, G. Coquerelle, and A. Bordas, 1994. Increase of egg weight with age in normal and dwarf, purebred and crossbred laying hens. Genet. Sel. Evol. 26:453–462.
796
DI MASSO ET AL.
Nordskog, A. W., and D. M. Briggs, 1968. The body weightegg production paradox. Poultry Sci. 47:498–504. Poggenpoel, D. G., and J. S. Duckitt, 1988. Genetic basis of the increase in egg weight with pullet age in a White Leghorn flock. Br. Poult. Sci. 34:863–867. Richards, F. J., 1959. A flexible growth function for empirical use. J. Exp. Bot. 10:290–300. Ricklefs, R. E., 1985. Modification of growth and development of muscles in poultry. Poultry Sci. 64:1563–1576. Shalev, B. A., and H. Pasternak, 1993. Increment of egg weight with hen age in various commercial avian species. Br. Poult. Sci. 34:915–924. Siegel, P. B., 1962. Selection for body weight at eight weeks of age. 1. Short term responses and heritabilities. Poultry Sci. 41:954–962.
Sokal, R. R., and F. J. Rohlf, 1969. Biometry. W. H. Freeman and Co., San Francisco, CA. Sorensen, P., T. Ambrosen, and A. Petersen, 1980. Scandinavian selection and crossbreeding experiment with laying hens. IV. Results from the Danish part of the experiment. Acta Agric. Scand. 30:288–308. Tatsuoka, M. M., 1971. Multivariate analysis techniques for educational and psychological research. John Wiley and Sons, Inc., New York, NY. Weatherup, S.T.C., and W. H. Foster, 1980. A description of the curve relating egg weight and age of hen. Br. Poult. Sci. 21:511–519. Zelenka, D. J., E. A. Dunnington, and P. B. Siegel, 1986. Growth to sexual maturity of dwarf and nondwarf White Rock chickens divergently selected for juvenile body weight. Theor. Appl. Genet. 73:61–65.