Emerging Treatments and Technologies O R I G I N A L
A R T I C L E
Etanercept Treatment in Children With New-Onset Type 1 Diabetes Pilot randomized, placebo-controlled, double-blind study LUCY MASTRANDREA, MD, PHD1,2 JIHNHEE YU, PHD3 TORSTEN BEHRENS, MA1 JOHN BUCHLIS, MD1,2
CHRISTINE ALBINI, MD, PHD1,2 SHANNON FOURTNER, MD1,2 TERESA QUATTRIN, MD1,2
OBJECTIVE — To gather preliminary data on the feasibility and efficacy of etanercept therapy to prolong endogenous insulin production in pediatric patients with newly diagnosed type 1 diabetes. RESEARCH DESIGN AND METHODS — This was a 24-week double-blind, randomized, placebo-controlled study conducted at the Diabetes Center, Women and Children’s Hospital of Buffalo. Eighteen subjects (11 male and 7 female, aged 7.8 –18.2 years) were randomly assigned to receive either placebo or etanercept. Inclusion criteria included age 3–18 years, GAD-65 and/or islet cell antibody positivity, A1C ⬎6%, three insulin injections per day, white blood cell count 3,000 –10,000, platelets ⬎100,000, and normal liver and renal function. Intention-to-treat analysis was used. RESULTS — A1C at week 24 was lower in the etanercept group (5.91 ⫾ 0.5%) compared with that in the placebo group (6.98 ⫾ 1.2%; P ⬍ 0.05) with a higher percent decrease from baseline than in the placebo group (etanercept 0.41 ⫾ 0.1 vs. placebo 0.18 ⫾ 0.21; P ⬍ 0.01). The percent change in C-peptide area under the curve from baseline to week 24 showed a 39% increase in the etanercept group and a 20% decrease in the placebo group (P ⬍ 0.05). From baseline to week 24 insulin dose decreased 18% in the etanercept group compared with a 23% increase in the placebo group (P ⬍ 0.05). Seventeen patients completed the study, and none withdrew because of adverse events. CONCLUSIONS — In this small pilot study, treatment of pediatric patients newly diagnosed with type 1 diabetes with etanercept resulted in lower A1C and increased endogenous insulin production, suggesting preservation of -cell function. A larger study is needed to further explore safety and efficacy. Diabetes Care 32:1244–1249, 2009
T
ype 1 diabetes is a T-cell–mediated autoimmune disease characterized by selective destruction of insulinproducing -cells within the pancreatic islet. This chronic disease affects 1 in 400 – 600 youth and poses a significant medical and psychological burden on patients and their families (1–3). In most patients, diagnosis and treatment are followed by a “partial remission period”
(honeymoon period) during which transient partial recovery of endogenous insulin production occurs. Eventually, there is progressive, irreversible -cell demise, leaving the patient totally dependent on exogenous insulin administered via multiple daily injections or continuous subcutaneous insulin infusion. Thus, the partial remission period represents a window of opportunity to halt the progres-
● ● ● ● ● ● ● ● ● ● ● ● ● ● ● ● ● ● ● ● ● ● ● ● ● ● ● ● ● ● ● ● ● ● ● ● ● ● ● ● ● ● ● ● ● ● ● ● ●
From the 1Department of Pediatrics, School of Medicine and Biomedical Sciences, University at Buffalo, Buffalo, New York; the 2Women and Children’s Hospital of Buffalo-Kaleida Health, Buffalo, New York; and the 3Department of Biostatistics, School of Public Health, University at Buffalo, Buffalo, New York. Corresponding author: Teresa Quattrin,
[email protected]. Received 12 January 2009 and accepted 27 March 2009. Published ahead of print at http://care.diabetesjournals.org on 14 April 2009. DOI: 10.2337/dc09-0054. Clinical trial reg. no. NCT00730392, clinicaltrials.gov. Immunex/Amgen approved this article. © 2009 by the American Diabetes Association. Readers may use this article as long as the work is properly cited, the use is educational and not for profit, and the work is not altered. See http://creativecommons. org/licenses/by-nc-nd/3.0/ for details. The costs of publication of this article were defrayed in part by the payment of page charges. This article must therefore be hereby marked “advertisement” in accordance with 18 U.S.C. Section 1734 solely to indicate this fact.
1244
sion of the disease. Several clinical studies are currently conducted to test agents that may alter the natural history of type 1 diabetes. Tumor necrosis factor-␣ (TNF-␣) and other cytokines play a role in the autoimmune process leading to pancreatic destruction (4,5). Evidence suggesting that TNF-␣ plays an active role in the pathogenesis of type 1 diabetes is derived from in vitro studies and animal models. In the nonobese diabetic mouse, TNF-␣ mRNA is produced by CD4 ⫹ T-cells within inflamed islets during the development of diabetes (6). In vitro models show that TNF-␣ potentiates the direct functional inactivation and destruction of -cells by other cytokines such as interleukin-1 and interferon-␥ (7–11). Transgenic mice with increased -cell expression of TNF-␣ have significant lymphocytic insulinitis, which is abrogated in TNF receptor–null mice (12). These findings support the role of TNF-␣ in signaling lymphocytic invasion, promoting local inflammation within pancreatic islets and contributing to cytokine-induced -cell destruction. Etanercept is a recombinant soluble TNF-␣ receptor fusion protein that binds to TNF-␣. It acts by clearing TNF-␣ from the circulation, thereby blocking the biological activity of this inflammatory cytokine. Although etanercept is used in the treatment of many autoimmune diseases including ankylosing spondylitis, juvenile rheumatoid arthritis, psoriasis, psoriatic arthritis, and rheumatoid arthritis, it has never been tested in youth with type 1 diabetes (13,14). We hypothesized that the administration of etanercept to children newly diagnosed with type 1 diabetes may prolong the partial remission period. The aim of this pilot study was to gather preliminary data on the feasibility and efficacy of etanercept administration to pediatric patients with recently diagnosed type 1 diabetes. The primary end points of this study were percent change from baseline for A1C and for C-peptide area under the curve (AUC). Secondary end points were insulin dose change from baseline and DIABETES CARE, VOLUME 32, NUMBER 7, JULY 2009
Mastrandrea and Associates
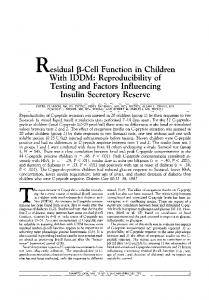
Figure 1—Flow diagram showing the progress of the patients throughout the trial.
number of insulin injections discontinued, if any. RESEARCH DESIGN AND METHODS — This was a randomized, double-blind, placebo-controlled feasibility study lasting 24 weeks, followed by a 12-week washout period. Inclusion criteria were as follows: male and female subjects aged 3–18 years with type 1 diabetes, GAD-65 and/or islet cell antibody positivity, A1C ⬎6% at diagnosis, insulin regimen with three injections daily, white blood cell count between 3,000 and 10,000 and platelets ⬎100,000, normal alanine aminotransferase and aspartate aminotransferase, creatinine ⬍1.8 mg/dl, and type 1 diabetes duration ⱕ4 weeks. However, to accommodate parental schedules, this window was lengthened, resulting in a 1.7- to 5.7-week interval between diabetes diagnosis and baseline. Exclusion criteria were as follows: intravenous antibiotics at diagnosis or within 14 days of study entry, BMI ⬎85th percentile for age and sex, unstable household unable to comply with study protocols, evidence of DIABETES CARE, VOLUME 32, NUMBER 7, JULY 2009
psychiatric disease in the study subject and/or primary caretaker, and chronic disease, including additional autoimmune disorders with the exception of euthyroid autoimmune thyroiditis. The study was approved by the institutional review boards of the Women and Children’s Hospital of Buffalo and the University at Buffalo and was conducted in accordance with the Declaration of Helsinki. Subjects and their parents signed informed consent and assent forms. All patients received a three-injection insulin regimen with Humalog and NPH before breakfast, Humalog before dinner, and NPH at bed time. Patients were instructed to measure blood glucose by fingerstick before breakfast, lunch, and dinner, at bed time, and at 2:00 A.M. as needed and when having symptoms of hypoglycemia. Insulin adjustments were made throughout the study at clinic visits and by telephone or e-mail between study visits. Study visits occurred every 4 weeks during the study drug period and 4 and 12 weeks after discontinuation of the study drug. Randomization was stratified
based on an A1C level of 9.5% at diagnosis. Study subjects were randomly assigned in a 1:1 ratio to subcutaneous injections of placebo or etanercept. The study drug, provided by Immunex/Amgen, was administered at a dose of 0.4 mg/kg up to a maximum dose of 25 mg/dose subcutaneously twice weekly (Monday/Thursday, Tuesday/Friday, or Wednesday/ Saturday). The study drug was stored in the pharmacy of the Women and Children’s Hospital of Buffalo and reconstituted with 1 ml of bacteriostatic water by the pharmacist, according to the master randomization table provided by Immunex/Amgen. Every 4 weeks, parents were provided with prefilled and refrigerated syringes of the study drug and returned empty syringes. The study procedure at every visit included laboratory work (cell blood counts, biochemical profile including liver and kidney function tests, and A1C), clinic visit (physical examination, blood glucose review, and insulin adjustment), and study drug dispensation. Menstruating female subjects also had urine human chorionic gonadotropin measurements. 1245
Etanercept therapy in type 1 diabetes Table 1—Characteristics of study participants at diagnosis
Sex (male/female) Age (years) Height (cm) Weight (kg) Insulin (units 䡠 kg⫺1 䡠 day⫺1) A1C (%) C-peptide (ng/ml) Diabetes duration (days)
Etanercept
Placebo
8/2 12.5 ⫾ 3.3 154.4 ⫾ 18.3 51.1 ⫾ 19.7 40.4 ⫾ 22.3 12.8 ⫾ 3.2 0.9 ⫾ 0.4 21.4 ⫾ 4.4
3/5 12.4 ⫾ 3.6 152.1 ⫾ 16.6 49.2 ⫾ 15.9 39.6 ⫾ 20.5 12.4 ⫾ 2.5 1.1 ⫾ 0.8 28.5 ⫾ 7.5
Data are means ⫾ SD.
An antinuclear antibody (ANA) titer was obtained at baseline, at weeks 12 and 24 of treatment, and at week 12 of washout. At baseline and week 24, a Boost meal test was performed (6 ml/kg up to a maximum of 360 ml). C-peptide was measured at 0, 30, 60, and 120 min, and AUC was calculated using the trapezoidal rule (15). The cell blood count and differential, biochemical profiles, A1C, and ANA titer were performed in the laboratory of the Women and Children’s Hospital of Buffalo (Kaleida Health). The A1C was measured by high-performance liquid chromatography with Bio-Rad variant (Bio-Rad, Richmond, CA). C-peptide was measured by immunoassay; islet cell antibodies and GAD-65 antibodies were measured by radiobinding at Nichols Institute laboratory (San Juan Capistrano, CA). Preliminary data were not available to perform power calculations. Historically, interventions that result in a change in A1C of 1% (SD ⱕ1.0) are accepted as clinically relevant. A priori power analysis indicated that a total sample size of 30 subjects (15 control and 15 treatment) would have 86% power to detect a 1% difference in A1C level (SD ⫽ 1.0) after 24 weeks of treatment (␣ ⫽ 0.05; effect size ⫽ 1.1). Because of the slow recruitment, the principal investigator decided to halt the study before reaching the planned number of participants. The principal investigator thought that if these preliminary results were favorable, they could be used as a basis for a larger efficacy and safety study to be proposed to TrialNet. Data are means ⫾ SD with the exception of Fig. 2, for which values are means ⫾ SEM. Comparisons between groups at each time point were performed using the Wilcoxon-Mann-Whitney exact method test. This method was used because of the small sample size and the fact 1246
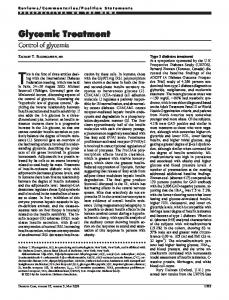
that it does not rely on large sample size approximation. Note that the linear model– based method was not used to handle repeated measures as this approach is reliable only for large samples. Kendall’s tau-b coefficient was used to test for associations between numerical outcomes. All statistical analyses were conducted using SAS (version 9.1). An intention-to-treat analysis was performed. RESULTS — Nineteen patients and their parents signed informed consent or assent forms. An intention-to-treat analysis was performed for the data of the 18 randomly assigned patients (Fig. 1). The characteristics of study participants at baseline were not statistically different between groups (Table 1). Study protocol institutional review board and Food and Drug Administration procedures were in place in June 2002; the study took place between October 2002 and October 2007. Reasons for slow recruitment were 1) parental concern over potential side effects and 2) lack of a “stable household environment,” which was necessary to ensure adherence to the study protocol and overall safety for the patient receiving the study drug. Efficacy data Figure 2 shows mean A1C values and percent decrease throughout the study. A1C values were higher in the etanercept than in the placebo group at both baseline and week 4 of treatment (difference not statistically significant). From week 8, the A1C values were lower in the etanercept group, with statistical significance at week 24 in etanercept group (5.91 ⫾ 0.5%) compared with the placebo group (6.98 ⫾ 1.2%; P ⬍ 0.05) (Fig. 2A). Moreover, from week 8 through week 24 of treatment, the percent decrease in A1C from baseline was consistently higher in
favor of the etanercept group (Fig. 2B). The A1C values continued to be lower in the etanercept group than in the placebo group at the 4- and 12-week washout observations, but this value reached statistical significance only at the ⫹4-week washout visit (P ⬍ 0.05) (Fig. 2A). However, the percent A1C decrease from baseline continued to be statistically greater in the etanercept group than in the placebo group at both week ⫹4 and week ⫹12 of washout (Fig. 2B). Blood glucose levels before breakfast, dinner, and bedtime for a 7-day period preceding baseline and week 24 were similar at baseline between the groups. At week 24, they demonstrated a trend toward lower blood glucose averages for fasting (111 ⫾ 27 vs. 158 ⫾ 69 mg/dl; P ⫽ 0.18), before dinner (149 ⫾ 44 vs. 208 ⫾ 55 mg/dl; P ⫽ 0.054), and before bedtime (129 ⫾ 24 vs. 198 ⫾ 46; P ⬍ 0.01) in the etanercept and placebo groups, respectively. C-peptide AUC in the etanercept group increased from 3.1 ⫾ 1.2 ng 䡠 ml⫺1 䡠 h⫺1 at baseline to 3.9 ⫾ 1.6 ng 䡠 ml⫺1 䡠 h⫺1 at week 24, whereas in the placebo group it decreased from 4.7 ⫾ 2.2 ng 䡠
Figure 2—A1C values (A) and relative change in A1C (B) throughout a 24-week treatment and 12-week washout period for etanerceptand placebo-treated groups. Values represent means ⫾ SEM at each time point. *P ⱕ 0.05; ∨ P ⱕ 0.01. ⽧, placebo; f, etanercept. DIABETES CARE, VOLUME 32, NUMBER 7, JULY 2009
Mastrandrea and Associates
Figure 3—C-peptide at baseline and 24 weeks for individual subjects. F, etanercept; E, placebo.
ml⫺1 䡠 h⫺1 at baseline to 3.6 ⫾ 2.0 ng 䡠 ml⫺1 䡠 h⫺1 at week 24. These changes resulted in a mean relative percent increase in C-peptide AUC from baseline to week 24 of 39% in the etanercept group, whereas the placebo group exhibited a 20% decrease compared with baseline (P ⬍ 0.05). In the etanercept group, all subjects but one experienced stable or increased C-peptide AUC, whereas in the placebo group, all subjects but one showed a decline in C-peptide AUC (Fig. 3). There was no association between type 1 diabetes duration and C-peptide or A1C at either baseline or week 24. The number of insulin injections in the etanercept and placebo groups did not differ appreciably. However, the insulin dose change between baseline and week 24 showed a mean decrease of 18% in the etanercept group compared with a mean increase of 23% in the placebo group (P ⬍ 0.05). There was no association between the relative difference in C-peptide and insulin dose from baseline to week 24. DIABETES CARE, VOLUME 32, NUMBER 7, JULY 2009
Safety data There were no severe adverse events in either group. The frequency of events was similar in the two groups with the following exceptions: three very mild episodes of self-resolving paresthesia in one subject in the etanercept group and none in the placebo group; cold symptoms, reported twice as frequently in the etanercept group compared with the placebo group; and abdominal pain with six of nine episodes reported by one patient receiving etanercept. None of these events caused significant disruption of daily activities or significant absence from school. Results of cell blood count with differential and biochemical profile, including liver and renal function tests were unremarkable in the two groups. The majority of cell blood count or biochemical profile abnormalities were present at baseline, were not clinically significant, and did not worsen during the study. A positive ANA titer was detected at baseline in five subjects assigned to etan-
ercept and two assigned to placebo. The ANA titer results at baseline for one subject in the etanercept group were missing. This subject had a positive ANA titer in the samples drawn thereafter. None of the subjects in the etanercept group with negative results at baseline converted to positive ANA status, and one subject in the placebo group converted to positive status after discontinuation of study drug. CONCLUSIONS — This is the first placebo-controlled pilot study to gather data on the feasibility of etanercept to prolong endogenous insulin production in youth with new-onset type 1 diabetes. A 24-week course of etanercept administered to pediatric patients with newly diagnosed type 1 diabetes resulted in lower A1C in the etanercept group compared with that in the placebo group at the end of the treatment period, with a significantly different A1C percent change from baseline favoring the etanercept arm. This finding was associated with a mean in1247
Etanercept therapy in type 1 diabetes crease from baseline of 39% in C-peptide AUC in response to a meal test in the etanercept group as opposed to a mean decrease of 20% observed in the placebo group, which is similar to declines published in the literature (16). Thus, both primary end points of this trial were met. In addition, glycemic levels during a 7-day period preceding the week 24 visit showed a lower trend for the etanercept group—a finding consistent with the A1C results. When the total daily insulin dose at week 24 was compared with that at baseline, a significant difference was found with a mean decrease of 18% in the etanercept group compared with a 23% increase in insulin usage in the placebo group. This difference in insulin usage was paralleled by an increase in C-peptide AUC during a meal test in the etanercepttreated group compared with a decline in the placebo group, as noted above. These results suggest that the decrease in exogenous insulin usage is due to preservation of endogenous insulin production. The improved metabolic control experienced by the etanercept group is important as patients and health care providers strive to achieve near-normal control because it correlates with improved clinical outcomes (17). Serum levels of TNF-␣ are increased in patients with newly diagnosed type 1 diabetes compared with those in control subjects (18). Even after -cell function is completely lost, serum TNF-␣ levels remain elevated in type 1 diabetes (19), suggesting that the hyperglycemic state is associated with chronic inflammation. Anti-TNF-␣ agents, including etanercept, have an established role in the treatment of rheumatoid arthritis and other autoimmune conditions. In an adult patient with type 1 diabetes and rheumatoid arthritis, after initiation of adalimumab (monoclonal antibody against TNF-␣), fructosamine levels decreased without any reduction in erythrocyte sedimentation rate and C-reactive protein or in insulin usage (20). In another report describing three patients with insulin resistance as measured by the homeostasis model assessment index, chronic treatment with infliximab for either rheumatoid or psoriatic arthritis resulted in significant improvement in insulin sensitivity. One patient with type 2 diabetes reverted to a diagnosis of impaired glucose tolerance and stopped insulin therapy. The authors hypothesized that TNF-␣ blockade resulted in improved insulin signaling (21). 1248
Our findings suggest that etanercept administration at doses customarily used for the treatment of rheumatoid arthritis is well tolerated in pediatric patients with new-onset type 1 diabetes. In addition, our data show preservation of -cell function with improvement in glycemic control after a 24-week course of etanercept therapy. Although these results are promising, it should be recognized that patients receiving etanercept or other antiTNF agents must be carefully monitored for other autoimmune conditions and infections, including tuberculosis, which occurred in ⬃0.007% of etanercepttreated patients in trials enrolling ⬎15,000 patients in the U.S. and Canada. In fact, many of the agents currently being tested to prolong the remission period in type 1 diabetes are likely to have significant effects on the immune system. Thus, the goal of halting pancreatic islet -cell demise must be weighed against possible complications from agents that might achieve this goal. In addition, the potential need for continuous therapy is an important factor weighing in the costbenefit balance compared with other potential immunotherapies. For example, a single 14-day course of anti-CD3 monoclonal antibody resulted in preserved -cell function for at least 2 years after onset of diabetes in 67% of subjects assigned to intervention compared with 26% of subjects receiving placebo. However, etanercept therapy does not require hospitalization, and side effects were minimal compared with those observed during anti-CD3 monoclonal antibody infusion (16). A larger study is needed to confirm these preliminary data showing that etanercept may modulate the progression of type 1 diabetes and to further address the risk-to-benefit ratio of etanercept therapy in this population. Given the complex pathogenesis of type 1 diabetes, the use of etanercept in new-onset type 1 diabetes may need to be coupled with use of another agent modulating T-cells. Last, there is a possibility that the etanercept treatment may be explored to examine whether it could prevent or delay diabetes development in individuals at high risk for the disease.
Acknowledgments — Funding and study drug for this study were provided by Immunex/Amgen. No other potential conflicts of interest relevant to this article were reported. We are indebted to Sherry Ortiz for her as-
sistance in the manuscript preparation, to Dara Farber for helping with data management, and to Angela Clark for conducting the nursing procedures.
References 1. Centers for Disease Control and Prevention. National Diabetes Fact Sheet. Bethesda, MD, U.S. Department of Health and Human Services, National Institutes of Health, 2005 2. Hauenstein EJ, Marvin RS, Snyder AL, Clarke WL. Stress in parents of children with diabetes mellitus. Diabetes Care 1989;12:18 –23 3. Wysocki T, Huxtable K, Linscheid TR, Wayne W. Adjustment to diabetes mellitus in preschoolers and their mothers. Diabetes Care 1989;12:524 –529 4. Mandrup-Poulsen T, Zumsteg U, Reimers J, Pociot F, Morch L, Helqvist S, Dinarello CA, Nerup J. Involvement of interleukin 1 and interleukin 1 antagonist in pancreatic -cell destruction in insulin-dependent diabetes mellitus. Cytokine 1993;5:185– 191 5. Argiles JM, Lopez-Soriano J, Lopez-Soriano FJ. Cytokines and diabetes: the final step? Involvement of TNF-␣ in both type I and II diabetes mellitus. Horm Metab Res 1994;26:447– 449 6. Held W, MacDonald HR, Weissman IL, Hess MW, Mueller C. Genes encoding tumor necrosis factor ␣ and granzyme A are expressed during development of autoimmune diabetes. Proc Natl Acad Sci USA 1990;87:2239 –2243 7. Mandrup-Poulsen T, Bendtzen K, Dinarello CA, Nerup J. Human tumor necrosis factor potentiates human interleukin 1-mediated rat pancreatic -cell cytotoxicity. J Immunol 1987;139:4077– 4082 8. Pukel C, Baquerizo H, Rabinovitch A. Destruction of rat islet cell monolayers by cytokines: synergistic interactions of interferon-␥, tumor necrosis factor, lymphotoxin, and interleukin 1. Diabetes 1988;37:133–136 9. Eizirik DL. Interleukin-1 induced impairment in pancreatic islet oxidative metabolism of glucose is potentiated by tumor necrosis factor. Acta Endocrinol (Copenh) 1988;119:321–325 10. Rabinovitch A, Baquerizo H, Pukel C, Sumoski W. Effects of cytokines on rat pancreatic islet cell monolayer cultures: distinction between functional and cytotoxic effects on islet -cells. Reg Immunol 1989;2:77– 82 11. Campbell IL, Iscaro A, Harrison LC. IFN-␥ and tumor necrosis factor-␣: cytotoxicity to murine islets of Langerhans. J Immunol 1988;141:2325–2329 12. Herrera PL, Harlan DM, Vassalli P. A mouse CD8 T cell-mediated acute autoimmune diabetes independent of the perforin and Fas cytotoxic pathways: DIABETES CARE, VOLUME 32, NUMBER 7, JULY 2009
Mastrandrea and Associates
13.
14.
15. 16.
possible role of membrane TNF. Proc Natl Acad Sci USA 2000;97:279 –284 Weisman MH, Paulus HE, Burch FX, Kivitz AJ, Fierer J, Dunn M, Kerr DR, Tsuji W, Baumgartner SW. A placebocontrolled, randomized, double-blinded study evaluating the safety of etanercept in patients with rheumatoid arthritis and concomitant comorbid diseases. Rheumatology (Oxford) 2007;46:1122–1125 Braun J, McHugh N, Singh A, Wajdula JS, Sato R. Improvement in patient-reported outcomes for patients with ankylosing spondylitis treated with etanercept 50 mg once-weekly and 25 mg twice-weekly. Rheumatology (Oxford) 2007;46:999 – 1004 Bolton S, Bon C. Pharmaceutical Statistics: Practical and Clinical Applications. New York, Informa Health Care, 2003 Herold KC, Gitelman SE, Masharani U,
DIABETES CARE, VOLUME 32, NUMBER 7, JULY 2009
Hagopian W, Bisikirska B, Donaldson D, Rother K, Diamond B, Harlan DM, Bluestone JA. A single course of anti-CD3 monoclonal antibody hOKT3␥1(Ala-Ala) results in improvement in C-peptide responses and clinical parameters for at least 2 years after onset of type 1 diabetes. Diabetes 2005;54:1763–1769 17. The Diabetes Control and Complications Trial Research Group. The effect of intensive treatment of diabetes on the development and progression of long-term complications in insulin-dependent diabetes mellitus. N Engl J Med 1993;329: 977–986 18. Cavallo MG, Pozzilli P, Bird C, Wadhwa M, Meager A, Visalli N, Gearing AJ, Andreani D, Thorpe R. Cytokines in sera from insulin-dependent diabetic patients at diagnosis. Clin Exp Immunol 1991;86: 256 –259
19. Lechleitner M, Koch T, Herold M, Dzien A, Hoppichler F. Tumour necrosis factor-alpha plasma level in patients with type 1 diabetes mellitus and its association with glycaemic control and cardiovascular risk factors. J Intern Med 2000; 248:67–76 20. van Eijk IC, Peters MJ, Nurmohamed MT, van Deutekom AW, Dijkmans BA, Simsek S. Decrease of fructosamine levels during treatment with adalimumab in patients with both diabetes and rheumatoid arthritis. Eur J Endocrinol 2007;156:291– 293 21. Yazdani-Biuki B, Stelzl H, Brezinschek HP, Hermann J, Mueller T, Krippl P, Graninger W, Wascher TC. Improvement of insulin sensitivity in insulin resistant subjects during prolonged treatment with the anti-TNF-␣ antibody infliximab. Eur J Clin Investig 2004;34:641– 642
1249