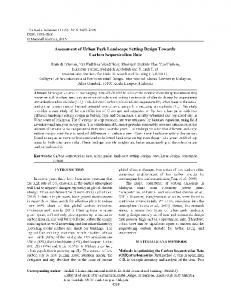
Ahmad, Guillermo Castilleja, Marcia Gowen, Susan. Hoke .... evaluate forestry projects for their carbon ... project sponsors wanted a relatively high degree ... fencing; building terraces to protect 2,000 hectares ...... The growth curve represented is S-shaped, so that ...... and on fallow lands, backyard cattle raised for family.
EVALUATING THE CARBON SEQUESTRATION BENEFITS OF FORESTRY PROJECTS IN DEVELOPING' COUNTRIES
Paul Faeth CherylCort Robert Livernash
&EPA WORLD RESOURCES INSTITUTE February 1994
I
Kathleen Courtier Publications Director
Brooks Clapp Belford Marketing Manager
Hyacinth Billings Production Manager
Nels Johnson, WRI: View of Ghandruk village in the Annapurna Conservation Area, Nepal, site of one of the carbon sequestration proposals evaluated by WRI. Cover Photo
Each World Resources Institute report represents a timely, scientific treatment of a subject of public concern. WRI takes responsibility for choosing the study topics and guaranteeing its authors and researchers freedom of inquiry. It also solicits and responds to the guidance of advisory panels and expert reviewers. Unless otherwise stated, however, all interpretation and findings set forth in WRI publications are those of the authors.
Copyright 1994 World Resources Institute. All rights reserved. ISBN 0-915825-95-3 Printed in the United States of America on recycled paper.
Contents Acknowledgments Preface
v vii
I. Introduction................................................................................... 1 2. Land Use and Carbon Sequestration (LUCS) ModeL
9
3. Revisiting the CARE/Guatemala Agroforestry Project...
21
4. The PDA Project in Thailand
33
5. The ANCON Project in Panama
37
6. The UCEFO Project in Mexico
.43
7. The KMTNC Micro-Hydro Project in Nepal
.51
8. The OxfamlCOICA Project in the Western Amazon
55
9. Lessons Learned
63
References
69
Appendix A - Request for Concept Papers and Data Sheet...
73
Appendix B - Project Evaluation Form
81
Appendix C - Additional Flow Diagrams
83
Acknowledgments We wish to thank those who helped with the evaluation and production processes involved in this report. In particular, the members of the evaluation panel deserve special mention: Jim Adriance, Kamal Ahmad, Guillermo Castilleja, Marcia Gowen, Susan Hoke, Kathy Moser, Mark Trexler, and Peter Veil. Bruce Cabarle, Nels Johnson and Guillermo Catilleja also deserve special mention for their invaluable participation in site visits and scenario analysis. Thanks are due to those who reviewed earlier drafts of this report, including Gilbert Arum, Roger Dower, Gerald Leach, Richard Rice, Roger Sedjo, Nigel Sizer, and Aaron Zazueta.
Special thanks to Seth Beckerman, who edited the report and did the layout, and to Katy Perry, who assisted with the graphics. Funding for the evaluation process was provided by the AES-Shady Point Corporation of Poteau, Oklahoma. The U.S. Environmental Protection Agency's Office of Policy, Planning and Evaluation, Climate Change Division, provided funds to prepare and publish this report.
P.F.
c.c. R.L.
Preface Planting trees is widely touted as a hedge against climate change, but how much carbon dioxide can a given forestry scheme aetually scrub from the atmosphere? There's been no lack of debate on this question, but few attempts to answer it with real experience. The fact that nations are now on the verge of buying and selling such "sink enhancements" under the climate treaty's "joint implementation" provisions puts a premium on finding ways to make defensible quantitative estimates.
carbon a particular forestry project would sequester - and at what cost.
WRI researchers first tackled this problem in 1989 when Applied Energy Services, an electricity supplier with power plants around the world, asked them to help find a way to offset the lifetime carbon dioxide emissions of its new coal-fired electric plant in Connecticut. This effort resulted in the first forestry project funded explicitly to offset greenhouse gas emissions.
As they note, risks and uncertainties abound in any attempt at long-term forecasting. Unforeseeable shifts in political, economic, or demographic trends can skew the outcome; indeed, changes in key parameters could have enormous effects over such a long time frame. The best available information may be far from accurate. The amount ofbiomass in a particular kind offorest is hotly disputed, for instance, so researchers may have to go with their best "guestimate," another instance in which small errors at the outset may be magnified over time. Given these inescapable difficulties, the authors pointedly note that their findings should be considered "first approximations, not revealed truth."
Now, WRI Senior Associate Paul Faeth and former research assistant Cheryl Cort, with help from Senior Editor Robert Livernash, have taken the next step by detailing the second-round effort to evaluate "carbon forestry" projects on the ground. After eliciting forestry project proposals from developing country nongovernmental organizations, these researchers pioneered a way to estimate projects' carbon storage potential by feeding scenarios based on many kinds of data and trends into a land-use model. The "carbon sequestration" model they designed then estimated how the landscape would change over the power plant's 34year lifespan, allowing them to estimate how much
In Evaluating the Carbon Sequestration Benefits ofForestry Projects in Developing Countries, the authors describe how they used this new model to evaluate proposed forestry projects in Thailand, Panama, Mexico, and Nepal. The authors also revisit the Guatemala project, comparing the original estimates with new data and the new technology.
Nonetheless, the carbon sequestration model promises to be a useful tool in an era when nations everywhere are trying to meet the obligations they accepted in signing the climate treaty. Walter V. Reid Vice President for Program World Resources Institute
vii
WORLD RESOURCES INSTITUTE
I. INTRODUCTION
As policy-makers around the world assess the complex dynamics of climate change, the prospect that human activities will increase global
60-percent reduction in carbon dioxide emissions. Such an effort seems prudent, however, given that violent disruptions to the global ecosystem could
temperatures arises, along with the potential need for
occur in a warmer world.
action to stem such warming. The problem, in essence, is that gases such as
What can be done? Much of the debate to date has appropriately focused on cutting the use of fossil
carbon dioxide and methane act like a greenhouse
fuels, which accounts for the bulk of CO2 emissions.
roof, blocking a portion of the infrared heat reflected from the earth's surface. Historically, concentrations of these gases have varied within a range that resulted in a relatively moderate and stable climate. Over the past few centuries, however, human activities have increased the level of greenhouse gases in the atmosphere. Burning fossil fuels such as coal, for example, has increased the atmospheric concentration of CO2 about 25 percent above preindustrial levels, a concentration which continues to increase about 0.4 percent per year. Emissions from fossil fuel use alone have increased 3.6 times since 1950. lfthese trends persist and concentrations of greenhouse gases continue to rise, mean global temperatures will increase an estimated 0.3 degrees Celsius per decade, which could have potentially catastrophic implications for human health, agricultural productivity, and sea levels.
The latest estimate is that industrial processes account for emissions of about 21.8 billion metric tons of carbon dioxide annually, or about 78 percent of global (human-induced) carbon dioxide emissions. Inevitably, no solution to global warming is possible without drastic reductions in fossil fuel use and the development of renewable forms of energy.
Carbon dioxide is likely to be responsible for about half of human-induced global warming in the coming decades. Stabilizing concentrations of carbon dioxide at present levels would require an estimated
Deforestation is the other main culprit. Trees contain stored carbon. When they are cut down, as they are in the tropics at about an annual rate of 17 million hectares, carbon dioxide is released. Deforestation annually accounts for about 6.4 billion metric tons of carbon dioxide emissions, or about 22 percent of global carbon dioxide emissions. Forests and forest soils can be part of the solution, however, since they store carbon - about 20 to 100 times more per hectare than pastures or croplands do. Projects such as tree plantations or agroforestry schemes can store "new" carbon, while projects that protect valuable areas or prevent or
b
2
CARBON SEQUESTRATION
slow deforestation can preserve carbon in existing forests. Recently, there has been considerable discussion of methods to approach the problem of greenhouse gas emissions (GHGs) through international programs. Ideas such as tradable permits or allowances have been proposed, such as those used in the United States for sulfur dioxide control. Under these schemes, permits are allocated to cover emissions, and those allocated but not used can be sold. Trading mechanisms of this sort could be applied to GHGs and permits traded between nations (pearce, 1990; Swisher and Masters, 1989). Some countries could create salable permits by investing in forestry projects. The notion of forests as carbon storehouses of fossil fuel emissions was first proposed in 1976 (Dyson). However, the idea that new powerplants could offset their CO2 emissions by sponsoring sustainable forestry projects had never been implemented until 1989.
• •
several alternatives for reducing carbon dioxide at the source and found that none was technically feasible. AES then asked WRI to help develop criteria and identify and evaluate forestry projects that could mitigate the carbon dioxide emissions of a new 183-megawatt AES coal-fired powerplant in Connecticut that was expected to emit about 14.1 million metric tons of carbon (52.1 million tons of CO2) over its 40-year life. This project afforded WRI an exceptional opportunity to put some hard numbers into what was then a very soft debate. At that time, no project had the expressed purpose of offsetting carbon dioxide emissions, and most cost estimates were gross and not based on field experience with actual projects (Sedjo, 1989; Marland, 1988). Through the evaluation process, WRI hoped to gain some experience that would be more broadly useful. There were a number of reasons for pursuing such a project in a developing country rather than in the United States, including:
Such offsets could be created in two ways:
•
Accelerating the removal of CO2 from the atmosphere - for example, by planting trees. Reducing the rate at which CO2 is produced through human activities, such as protecting forests to slow the rate of deforestation.
•
•
Higher potential growth rates and faster carbon accumulation of trees in tropical countries. Greater dependence of people in developing countries on the services forests provide and therefore potentially greater benefits. Greater grant leveraging opportunities, including debt-for-nature swaps, foreign aid, and volunteer services. Alternatives in the United States to avoid the release of carbon dioxide or sequester it at the source appeared to be considerably more expensive.
The theory is relatively straightforward, but devising a way to test the carbon "sequestration" potential of a forestry project and comparing different projects are much more complicated.
•
Evaluating Carbon Sequestration Projects: A First Attempt
Since 1992, legislation in the United States. allows power companies to "bank" carbon offset credits. If a carbon tax is implemented in the future, those companies that have banked carbon offsets might receive tax credits (U.S. Congress, 1992).
The World Resources Institute first began to evaluate forestry projects for their carbon sequestration potential in 1988. Applied Energy Services, Inc. (AES), a U.S.-based independent electrical power producer, initially considered
WORLD RESOURCES INSTITUTE Four main criteria were developed for evaluating
3
worth ofin-kind services provided by the U.S. Peace
projects:
Corps and U.S. food aid.
•
The project had several components, including planting about 12,000 hectares of community woodlots, mostly in pine and eucalyptus for poles and lumber; implementing agroforestry practices on some 60,000 hectares of agricultural land for fuelwood, fodder, soil nitrogen-fixation, and fruit and nut production; planting 2,880 kilometers of live fencing; building terraces to protect 2,000 hectares of vulnerable slopes; and providing training and extension for community forest fire brigades to protect the newly planted trees and natural forest.
•
•
•
Potential ofthe project to offset carbon emissionsfrom the powerplant. Active local support and participation. Numerous studies have found that local participation is a critical factor in the success and durability of projects. Ability to leverage additional funds. AES wanted to use the $2 million it was willing to commit as leverage to attract other funds. Experience and commitment ofthe implementing organization. Since most projects would be carried out over many years and were intended to endure for several decades, the project sponsors wanted a relatively high degree of confidence that the organization managing the project could complete it successfully.
Of the proposals submitted, the most attractive was for a project located in Guatemala and proposed by CARE, a well-known international development and relief organization. Started in the mid-1970s, the CARE/Guatemala agroforestry program emphasized tree planting in agroforestry and woodlot applications, the conservation of biomass through such activities as forest fire brigades, and the formation of self-sustaining forestry groups to protect, plant, and manage trees. The program was supported by the Guatemalan Directorate General of Forests (DIGEBOS) and the U.S. Peace Corps, with funding provided by the U.S. Agency for International Development (USAID). In 1989 the termination of a USAID matching grant threatened to end the program, which prompted CARE to submit a proposal to WRI. CARE proposed using the $2 million AES grant to establish an endowment that would support a lO-year multiple-use sustainable forestry project. CARE was also prepared to raise $1.8 million in matching funds and expected to receive $1.2 million from the government of Guatemala and about $7 million
Based on WRI's calculation (Trexler et at, 1989), the CARE project would sequester an estimated 16.3 million metric tons of carbon over 40 years, primarily through: •
Net addition to the standing inventory of biomass carbon.
•
Retention of standing forest as a result of demand displacement (that is, the woodlots and agroforestry projects displace the demand for standing forests).
• •
Protection of some carbon in soils. Retention of some standing forests because of community fire brigades.
The analysis of the Guatemala project was an important first attempt to evaluate the carbonsequestration potential of sustainable forestry projects, but many questions were left unanswered. The evaluation, for example, was static and did not measure dynamic variables, such as the impact of population growth. Nor did it measure indirect impacts on forests of some significant variables, such as the effect of improved agricultural productivity on the conversion of forest land for cultivation.
Stage 2: A New Challenge In 1990, AES was building two new coal-fired plants. The plants were estimated to emit about 45
4
CARBON SEQUESTRATION
million metric tons of carbon over 34 years (the estimated lifetimes of the plants). AES offered a total of $5 million for projects that would offset emissions through forest management. In general, more field experience was necessary
A fourth criterion, carbon sequestration, was not estimated at this stage of the process. However, a decision was made to modify the evaluation process somewhat. Whereas the initial effort was designed to find a single large project, this second effort eliminated the bias against small projects by
as input to policy discussions. AES again asked WRI to develop the criteria and solicit and evaluate proposals. After the first round of evaluations, WRI realized that there were ways to improve the process, making it more fair and rigorous. In particular, it was important to attempt to include a much larger applicant group and to develop a more sophisticated methodological approach. Also, there was more to be learned about the potential of such projects to sequester carbon, the availability of organizations to implement them, and the actual cost of implementation.
evaluating the cost of carbon sequestration potential in terms of cost per ton of carbon. (See Appendix E.)
In November 1990, WRI wrote to 110 NGOs in 40 countries asking for a five-page concept paper, a one-page budget, and a one-page description of biophysical data. (See Appendices A and E.) Sixty concept papers were received, and an evaluation committee of rural development, forestry, and carbon sequestration experts selected 11 concept papers to be developed into full proposals.
Population and Community Development Association (PDA), Thailand. This project is
The committee used three criteria for this selection: •
•
•
Local participation, or projects that would provide the greatest involvement of (and benefit from) labor pledges, foreign aid programs, or support of existing projects. Grant leverage, which could include debt swaps, block or matching grants, community or labor pledges, foreign aid programs, or support of existing projects. Experience, including a demonstrated ability on the part of the implementing organization to manage and carry out the proposed project.
Ten proposals were resubmitted and initially evaluated without considering their carbon sequestration potential. Carbon sequestration estimates were not made until after site visits. Five of those projects, described below, provide the basis for the case studies in this report. The descriptions and evaluations are based on the proposals and amendments submitted by the various groups during the evaluation process conducted by WRI.
intended to provide rural communities in northeastern Thailand with direct access to forest products and control over future afforestation efforts. The project would establish village forestry committees in 300 selected villages; construct nurseries in each village; provide technical, financial, and managerial training to villagers; provide village nurseries with 1.5 million nitrogenfixing and 600,000 native hardwood tree seedlings plus 75,000 fruit tree graftings over five years; establish multiple-use protected forests and economic agroforestry plots on 1,200 hectares of public land; and employ agroforestry/integrated farming techniques on 300 hectares of privately-owned paddy fields. National Association for the Conservation of Nature (Associacion Nacional para la Conservacion de la Naturaleza, or A NCON), Panama. The
ANCON project would protect and restore the forest cover of the Panama Canal watershed. In recent decades, the watershed area has been extensively cleared for agriculture. The cleared areas have been
5
WORLD RESOURCES INSTITUTE taken over by an invasive exotic grass, inviting
social, political, and economic factors that have
further clearing and thus causing extensive
contributed to the destruction of hundreds of
deforestation. This process has increased soil erosion
thousands of hectares of the Amazon rain forest. The
and the buildup of sediments in the canal. The
project would attempt to halt deforestation through
project would strengthen the protection of the
land-defense strategies and provide economic
Chagres and Soberania national parks, restore
benefits through the sustainable management of
degraded areas within the parks through the planting
forests.
of native tree species, promote agroforestry practices among small farmers in the watershed, and expand a
The project has four components:
demonstration farm for sustainable agriculture and agroforestry practices. The expansion also would
•
include increased outreach.
CICOL (Intercommunal Central of the East Lomerio) in Bolivia would hire lawyers to fight against lumber and mining concessions and
Union ofForestry Communities (Union de Communidades Y Ejidos Forestales Del Estado de Oaxaca, or UCEFO), Mexico. Some 18,000 people live in the nine Indian communities that form UCEFO in the state of Oaxaca in Mexico. Of the 114,600 hectares in their territory, about 4,000 are used for agriculture and about 100,000 are forested. The project's objectives include gradually increasing forestry potential from a yield of 1.3 cubic meters of timber per hectare in 1991 to 4.5 cubic meters in 2030, converting and expanding existing nurseries and establishing new ones, developing an integrated program of reforestation, and improving local agricultural productivity.
work to obtain legal title to the 130,000-hectares traditionally belonging to the Chiquitano Indians. •
legal strategies to seek enforcement of a law protecting 1.2 million hectares of tropical lowlands belonging to the indigenous peoples of Beni. •
CEDIA (Center for the Development of Indigenous Amazonians) in Peru would work to protect the Machiguenga Indians' legally recognized territory in Peru, which is threatened by oil and gas development.
•
King Mahendra Trust for Nature Conservation, Nepal. The King Mahendra Trust proposed installing 12 micro-hydroelectric plants as part of its Annapurna Conservation Area Project. Since fuelwood currently provides 86 percent of the region's energy requirements, the micro-hydro projects would provide an alternative source of energy and could help slow deforestation in the region. Seedling nurseries would also be established in each village selected for a micro-hydro project, which would allow about 65 hectares of denuded land to be reforested annually.
CIDDEBENI (Center for Research and Documentation ofBeni) in Bolivia would use
OPIP (Organization of Indigenous Peoples of Pastaza) in Ecuador would use a legal defense strategy to protect the lands of the Quichua Indians in Pastaza Province.
All told, the project is intended to protect almost 2 million hectares.
Evaluating the Carbon Sequestration Potential of Each Project The carbon sequestration potential of all but one proposal was analyzed using project site data and a simple land-use model. (The OxfamlCOICA project could not be analyzed using the model because the necessary data were unavailable.) The model was
Oxfam America with CO/CA, an umbrella organization of indigenous groups in the Amazon
designed to evaluate changes in the landscape over
region. This project comprehensively addresses the
substantial insight on how different trends and
the 34-year life of the power plants and to provide
I
J'0:. ,I
6
CARBON SEQUESTRATION
interventions may affect the landscape over future decades.
their relative effectiveness in producing sustainable land-use patterns.
To assess changes in land use over time, we approximated essential relationships between human population growth, the subsequent need for food and energy, technological change, resource management, and land-use change. The model provides a comprehensive standard method for fairly and objectively evaluating each project's carbon sequestration potential. The model is used principally to analyze different scenarios, and the results produced are a function of the scenario assumptions. To the extent possible, assumptions were taken from project documents.
The model is quite sensitive to a few parameters, such as population growth rates and levels of agricultural productivity. Good estimates were available for the most sensitive parameters. Whenever possible, local data from the project site were used. When this was not possible, national data or data from similar ecological settings were used (see reference list). The data available among the projects were not consistent.
No broader political analysis was undertaken for each country, although the political and economic environment in a country are obviously critical to the outcome of a given project. For example, when considering the UCEFO project in Mexico, WRI did not simulate the impact of the North American Free Trade Agreement on emigration, and the subsequent effect of alternative population growth rates on shifting agriculture and standing biomass. Such exercises were not appropriate because WRI did not consider itself qualified to speculate about the future and it did not want to make the analysis any more subjective than necessary, especially considering that millions of dollars of funding were at stake. Instead, WRI assumed, for better or worse, that current trends would continue. Project interventions were compared against a baseline scenario, which simulates the conditions of the project site without the benefit of the project intervention. The difference between the amount of carbon sequestered with and without project interventions is considered the total amount of carbon sequestered. The land-use model can also be applied more widely. Different interventions can be tested to assess
\\
The model is also somewhat sensitive to biomass numbers for the various land-use categories. There is currently a great deal of uncertainty and discussion in the scientific literature about biomass estimates for different forest types in different parts of the world, and estimates diverge widely. The latest information using large-scale surveying techniques shows much lower biomass estimates than have been previously reported. In this sense, the results from the model should be viewed as first approximations, not "truth revealed." Some of the results are uncertain, not only because the future itself is inherently uncertain, but also because some of the data used are of poor quality and the relative risks associated with the various project interventions differ. The CARE project, with 14 years of experience, for example, will have a lower associated risk than the OxfamlCOICA project, which proposes to implement a fundamentally new political paradigm. The uncertainty associated with each project was considered subjectively by the evaluation committee, but excluded from the modeling work since it was impossible, within the bounds of the work undertaken for these evaluations, to objectively determine a confidence interval for each project outcome. To the extent that there are errors, these should occur consistently across the projects to produce
7
WORLD RESOURCES INSTITUTE
objective comparisons among projects. Table I summarizes each project's estimated carbonsequestration benefits and related budgetary information. In the table, the total budget reflects the total costs of implementing the project as estimated by the applicant. Costs include salaries and benefits, buildings and equipment, operation and maintenance, overhead charges, and other necessary items (Appendix A). The request is the amount requested from AES. Dollars per ton of carbon is shown for both the request and the total budget. The difference reflects the leveraging anticipated by the applicant. In the second round evaluation, AES chose to sponsor the Oxfam project. This report describes the process, results, and analytical methods used in the first comprehensive
evaluation undertaken to select carbon-offset projects in developing countries. WRI hopes it provides useful information to policy-makers and researchers considering similar joint ventures in developing countries. Chapter 2 provides an overview ofthe structure of the land-use model. In Chapter 3 the initial evaluation for the Guatemala project is revisited, and the original methodology and data are updated and contrasted to estimates developed through the use of the land-use model. The five other projects are discussed in more detail in Chapters 4 through 8. Chapter 9 summarizes the findings and draws conclusions relevant to future carbon sequestration efforts.
Table 1. Amount of Carbon Sequestration and Cost Estimates for Six Forestry Projects in Developing Countries Dollars per ton of carbon (requested/ total)
Dollars per dollar leverage
Request (percent of total budget)
NGO/country or region/chapter
Total carbon ('000 tons)
Request (million dollars)
Total budget (million dollars)
CARE/Guatemala/3
39,000
2.00
8.80
0.05/0.23
3.40
23
150
1.19
1.62
7.93/10.8
0.36
73
ANCON/Panama/5
7,400
2.60
18.00
0.3512.43
5.92
14
UCEFO/Mexico/6
2,700
2.86
3.25
1.06/1.20
0.14
88
70
0.96
1.13
13.64/16.14
0.18
85
75,000
2.55
4.50
0.03/0.06
0.76
57
PDAIThaiiand/4
KMTNC/Nepal/7 OxfamlAmazon/8
WORLD RESOURCES INSTITUTE
9
2. Land Use and Carbon Sequestration (LUCS) Model
When Trexler et al. (1989) first attempted to estimate the carbon sequestration benefits of the
consideration would be scarce. The model, therefore, must represent the social, physical, and ecological
CARE/Guatemala project, it became clear that the methodology was deficient. Many essential elements offorest and agricultural management in rural areas
interactions as simply as possible to reduce data demands.
were not part of the analysis. The effects of
The principal purpose of the model was to track
population growth and the carbon associated with
the implications of different management schemes in
the recovery of fallow areas were notable, but the analysis focused principally on the more direct benefits of tree planting, soil conservation, and suppression of forest fires.
widely different areas in order to allow fair comparisons among proposals. Previous experience had demonstrated the difficulty of estimating carbon sequestration and the near impossibility of making fair comparisons among proposals when many different methods and assumptions were used. A more objective evaluation could be made if the same tool and evaluators were used.
Trexler et al. recognized that a more sophisticated effort would be necessary for a more complete evaluation of the benefits of such projects. The model described in this chapter is such an effort. The model was constructed with three principal considerations. It must: •
• •
Capture the essential physical interactions among people and forests in developing countries. Not be overly complicated. Be able to represent a wide variety of situations and management schemes.
Previous experience suggested that the data available in the areas that would come under
Finally, recognizing the impossibility of predicting carbon sequestration over a 35-year period, a scenario analysis method was chosen instead. The model does not predict prices, incomes, or other economic indicators. The analyst must determine the rates of change for key parameters such as population and agricultural productivity, and the model serves as an accounting tool, tracing the implications of these scenarios. The burden of defining the future is thus on the analyst and a more complicated model isn't needed. In addition, the assumptions of the modeling exercise are much more transparent.
/3
10
CARBON SEQUESTRATION
The most appropriate use of the model, therefore, is as a tool for comparing and contrasting both the broad differences among sites and alternative management regimes at a given site. The results that the model produces are in this sense more qualitative than quantitative in nature. Does a given intervention make a minor or major difference in the outcome? Does a given intervention change the nature of the resulting behavior, for example, from asymptotic decay to stability, or does it simply delay the inevitable run-down of the ecosystem? What elements are most critical in determining the results? Because the nature of the interventions proposed were so diverse (for example, agroforestry, fuelwood stoves, forest management, agricultural extension), and because the boundaries of interest were at the project level, land use was the most suitable and most simple basis for the model.
Overview The model was designed to operate at the project or subregional level, and the areas under consideration ranged from about 100,000 hectares to as much as 3 million hectares. These project areas were defined to contain the principal physical influences from the projects. Changes in land use are determined by population growth (demand), agricultural productivity and its growth rate, and management activities. The projects evaluated have focused on poor, underdeveloped areas that depend largely upon low-productivity agriculture for subsistence and fuelwood for energy. The local people derive most of their livelihood from the project region. As the population grows, more land is required to supply food and fuelwood. While demand grows in absolute terms, however, its impact on the land base can grow at a lesser or even negative rate depending upon changes in productivity and project activities.
Categories for Land and Biomass The nine categories of land represented in the model are based upon principal uses and the amount of biomass present. (See Figure 1.) Several of these categories are subdivided into early, medium, and mature age classes to represent growth stages in forest maturation. The principal land uses include: 1 • •
•
Three categories of agriculture - permanent, shifting, and agroforestry. Five categories of forest or woodland - closed, open woodland, tree plantations, forest fallow, and restored forests. One category combining grazed and degraded land. (See Figure 1.)
The biomass of each category or subcategory is constant and represents an average over the project area. The model represents changing biomass levels by movement from one land class to another. Biomass accumulation in tree plantations, closed forest (primary and secondary), restored forests, and forest fallow is represented by "aging chains." The biomass figures account for survival rates of tree seedlings. Forest degradation, for example, due to loss of biomass for fuelwood, is represented as a movement of land from closed forest to open woodland and then to degraded land. Carbon sequestration is calculated from standing biomass, wood products, and fossil fuel use. Carbon in standing biomass is determined by multiplying the area of each land use category by its average biomass, then multiplying the product by the carbon content of wood. (Figure C-1.)
1. Some of the figures mentioned in this discussion are located in this chapter and some in Appendix C. This separation reduces the burden for readers not interested in details of the model's structure. The figures included in this chapter are considered essential to a basic understanding of the model's behavior in later chapters, while those included in Appendix C might be of interest to a more technical audience.
11
WORLD RESOURCES INSTITUTE
Interpreting Flow Diagrams The flow diagrams on the following pages use a set of icons that have specific meanings. It is essential to understand these icons in order to interpret the flow diagrams. A rectangle represents a stock, also called a state variable or level. Stocks are instantaneous measures of things like people or land area.
A straight line represents a constant. For the sake of simplicity, many items that are known to vary over time are assigned a constant value to avoid the necessity of modeling these aspects where the aspect is either not of central importance, or these data are too weak to justify further disaggregation.
CONSTANT
e
LEVEL
Circles are called auxiliaries. These are catchalls for everything else.
Stocks are changed by rates. Rates characterize the change in a stock over time. Births per year or conversion of closed forest are rates. The icon for a rate looks like a spigot.
RATE
Sources and sinks are represented by cloud-
like shapes. Somewhat unfortunately, modeling jargon defines a source or sink as outside the boundary of interest. For example, we don't care where people come from before they are born. In the issue of global warming, sources and sinks have a different meaning and are critically important. In this analysis, few sources or sinks are indicated because land area can neither be created nor destroyed in the time frame of interest.
In this model, solid lines represent material flows of people or land. Dashed lines represent information flows. The direction offlow is indicated by the arrows. Material flows affect the values of the elements connected, but information flows do not.
INFORMATION FLOW
0- - - - - - - - - - - - - - - --... MATERIAL FLOW
0---------.....
I~
-
~I
I Figure 1. Land Categories Represented in the LUCS Model
..D1lUoNiNT MIICULTUli
(HA)
CLOSED rOREST
IlES1'OIlED FOUT 1.2.3 (HA)
1,2,3 [HA)
OPEN WOODLAND
gRAZED aR DEglADED LAND
[HAl
[HAl
IHIFTlNQ AGRICULTURE
AQROFOREITRY
(HA)
(HA)
TREE .. LANTATIONI 1.2.3 (HA)
.....
'"
rOREIT FALLOW
1.1.3 (HA)
WORLD RESOURCES INSTITUTE
13
The model tracks wood harvested for permanent uses - for example, lumber, fencing, or poles
Agricultural land requirements are reduced by the fraction of food imported into the project area and
(Figure C-2.) This wood comes from the harvest and
increased by the amount of land used for export
thinning of trees in the closed forest, open woodland,
production and its rate of growth.
and tree plantation categories. The area harvested is multiplied by the biomass and the fraction of biomass that goes into a permanent use, as opposed to a consumptive use such as fuelwood. Limbs, roots, damage, and waste are excluded from the fraction. The useful life of the wood products is based upon their use. Wood for housing has a longer useful life than poles for fencing. (Figure C-2.) A preference for fuelwood over fossil fuels such as kerosene is assumed. Fossil fuel comes into play when demand for fuelwood exceeds the local supply. Fossil fuel is modeled as a stock with a large arbitrary beginning value that declines over time. The carbon released from the stock is added to the total carbon sequestered as a negative value.
Population, Land, and Fuelwood Demand Figure 2 shows the model structure for population growth, required agricultural land, and fuelwood requirement. Population is represented by a simple stock with a rate of population change. The rate of population change slows to zero as the year that the population is expected to stabilize approaches. In this simple way, the model can represent a demographic transition from exponential growth to stability. Required agricultural land is a function of population, agricultural land required per person, fraction offood imported, and agricultural land required for export production. Agricultural land per person, a variable that captures the productivity of the project region, is estimated initially on the productivity of permanent annual cropping. Areas of low productivity require more agricultural land to support a given level of population and export production. The value of this variable changes over time according to the estimate given for growth rate in agricultural productivity. (See Figure 2.)
Fuelwood requirement is determined by population and the fuelwood requirement per person. The fuelwood requirement can be reduced if the efficiency of fuelwood stoves is improved. Key here are the addition of stoves, the fuelwood savings from stove use, and average family size, which determines the number of people affected by the use of a single stove. Three broad types of agricultural land are specified in the LUeS model so that significant differences in cropping, fuelwood production, and associated land use can be captured. Permanent agricultural land as used here can be thought of as continuously cropped land used mostly for annual crops. Agroforestry is also permanent cropping, but these sorts of systems are mixed with perennials, and commodities produced may include a cash crop such as coffee or a fuelwood crop. Shifting agricultural land is not continuously cropped, but rather is temporarily put into fallow after some period of cultivation. Each of these three categories of agricultural land is characterized by its own level of productivity. In the LUeS model, agricultural productivity is defined as the amount of land required to support one person. More productive systems require less land to support a person. For agroforestry and shifting agriculture, productivity is defined relative to permanent agriculture. To determine if the amount of agricultural land at any given time is sufficient to meet local and export requirements, the model multiplies the area of each category of agricultural land by its respective productivity ratio (1 for permanent agriculture). These are summed to determine the total amount of agricultural land, which is compared to the required
---~
Figure 2. Population Levels Are Used to Determine Demand for Agricultural Land and Fuelwood INnw. MlE OF POPULATION CHANeI:
YI:AII THAT
-
I'DPULATION WILL IITAaIUZE
~-
....
..".
- ......
..".
- ,....------.
..... ....
-- ...
POPUl-'TION (PERSDNS) CHANllIE IN POPULATION [P/YR)
, I
FIIAC. OF IIIPORTED FOOD
.... .fo.
-.
.. _--
.... .... I
I
---- - -
I I
e~
/
.... ....
I
/
.... ....
..".
,
..".
........
FUELWOOD REQUIREIIENT PER PERSON (TDNS/P/yR)
"
........
,,1-
....
I I
..".
I
I 8RDWT1l IIAlE IN AGRIC. PRDDUCTIYllY
INITIAL AORICULTUIlAL LAND REQUIRED PER PERSON
FAMILY SiZE
(HA/P)
....
/
-'
I I
GROWTH IIAlE OF AGRIC. LAND FOR EXPORT [HAlYR)
, ....
~
, , ....
/
,
.... _----
---.-.
--- - '
ADDITIONAL FUELwooa lITaYES (NO./YR)
--
....
..".
11
..".
't
, I
I --
"'v I
FIlAC. OF FUELWallD SAYINGS FRail FUEL EFFICIENT IlTaYES
15
WORLD RESOURCES INSTITUTE
agricultural land to determine the agricultural land shortfall. (Figure C-3.) Required agricultural land is estimated for the coming year, so there will be a
This same structure is used for conversion of open and closed forest to permanent agriculture, agroforestry, and shifting agriculture. (Figure
shortfall as long as population is growing.
C-4.) For agroforestry and shifting agriculture, there are no limits to the area that can put into those
Agricultural land shortfalls result in movement of land to agriculture. Land can be moved to agriculture from conversion of closed forest, conversion of open woodland, and reversion of forest fallow. Conversion of open woodland to permanent agriculture is indicated by the relative amounts of open woodland and closed forest, the agricultural land shortfall, and the fraction of new land brought into permanent agriculture. (Figure C-4.) Limits are placed on the conversion because no more open woodland can be converted than exists and no more land can be put into permanent agriculture than is suitable for that type of production (maximum permanent agricultural land). The time required to convert agricultural land is assumed to be one year so that projected and actual requirements can be matched.
categories (except for the availability of closed forest and open woodland). For closed forest, an additional constraint is placed on the conversion to represent the effective protection of parks. (Figure C-5.) Only unprotected closed forest can be converted to agricultural or other categories.
The fraction of land converted from open woodland is the amount of open woodland divided by the area of open woodland and closed forest. The model assumes a spatially even landscape and directs conversion by the relative availability. For example, if there were 900,000 hectares of closed forest and 100,000 hectares of open woodland, then the fractions for conversion would be 0.90 and 0.10, respectively, for closed forest and open woodland. This fraction is multiplied by the agricultural land shortfall and a constant that indicates the fraction of new agricultural land that would normally be brought into permanent agriculture. The fractions for each agricultural land category sum to 1.0 and reflect the prior historical pattern of agricultural land use. As conditions change - for example, if the maximum amount of permanent agricultural is reached - these fractions change.
Because fallow land must be taken into account, shifting agriculture has a more complicated structure than permanent agriculture or agroforestry. (See Figure 3.) As in the other two categories, land can be converted from closed forest or open woodland to shifting agriculture. In addition, shifting agricultural land can be converted to agroforestry (as happened in Guatemala) through project activities, or degraded to a low biomass category that includes grazed and degraded land. Some fallow periods for shifting agriculture may last 20 years or more, during which time the idled land can accumulate significant amounts of biomass. For this reason, the forest fallow category is split into three age classes to capture the biomass dynamics. (Figure C-6.). After a given cultivation period, usually two to eight years, shifting agricultural land moves into the first aging category of forest fallow. The maturation time to the next age category is onethird of the total fallow period. At the end of the fallow period, the land returns to cultivation if an agricultural land shortfall exists. If no shortfall exists, the third aging category reverts to open woodland (not shown). If the agricultural land shortfall is larger than the amount of land that will be moving into shifting agriculture from the third forest fallow age category, more land will be returned to production from the second age class.
11
~ Figure 3. Flows of Land to and from Shifting Agriculture
~
r
llIAZED OR DElIIIADED LAND (HA)
.
~
~V
~
FllREIT FALLOW AlINI CATEIORY 1 (HAo)
1\
RETURN DF\
IATO
DEGRADATlON OF SHIFT. AG. (HAIYR)
FOREST FALLOW / (HAIYA)
IJ 1\ ~
.... 0>
............. / / ..............
OPEN WOODLAND (HA)
CONVERIION OF OW TO IHIFT. All. (HAIVR)
-.
....
-
SHIFTIND ADRICULTURAL LAND (HA)
..~
... I....
....--
............ /
...
FDREIT FALLOW AlING CATEGORY :I (HA)
....................... AEVERT. FF2 TOIA (HAIVR)
r\ V
1I ~
CONVERT. CF TO IA (HAIYR)
~.
AIlROFOREITRY LAND (HA)
1..-
r-.
............
-"'""'"
....................... CONVERT. IA TO AaROFOIL. (HAIVA)
CLOSED FOREST (HA)
............ -;;;7'
7"' REVElfl'. FF3
TO SA (HAIVR)
..•
FOREST FALLOW AIlING CATEIIORY 3 (HA.)
WORLD RESOURCES INSTITUTE
17
The aging chain structure approximates the growth of trees. As the trees mature, the appropriate amount of land is transferred to the next age class. The growth curve represented is S-shaped, so that the biomass of the first age class is one-sixth of the mature class, and the biomass of the second age class
can be used for fuelwood or more permanent uses, such as poles. At maturity, tree plantations are cleared and replanted. The harvest, once again, can be used for fuelwood, timber, pulpwood, or other uses. In the model, tree plantations are represented as an aging chain. (Figure C-8.) Land can be
is two-thirds. This method approximates volume growth for those categories that require it.
converted from grazed or degraded land or open woodland through project activities. The available fuelwood is calculated as a fraction of the total biomass (average biomass x area) maturing or being
The movement of land from a younger to an older aging category is determined by a constant that represents the time required for the trees to mature. This constant, in part, describes the ecological characteristics of the site. Soil productivity is not explicitly captured in the model, but instead the maturation times are used. A tree plantation planted on degraded soils would have a longer maturation time than a plantation planted on higWy productive soils. This again is a means to simplify the model's structure and data requirements.
harvested for each aging category. The fractions may be large if the plantation is intended solely as a fuelwood source, zero if it is not, or something in between if, for example, the trunks are used for timber and the branches for fuelwood.
Fuelwood and Forest Management
As forested land is converted to agricultural uses, large amounts of biomass are destroyed. Since people can use this biomass to meet their fuelwood needs, the model calculates the fuelwood available from destructive clearing as a fraction of the rate of land converted, multiplied by the difference in
Two main sources of available fuelwood are captured in the LUeS model (Figure C-7):
biomass between the two categories. (See Figures 4 and 5.)
•
Fuelwood available from land conversion that is destructive - that is, where biomass losses are great enough to change the land-use type.
•
Fuelwood available from collection or harvest that is non-destructive.
In extreme circumstances, fuelwood deficits can degrade or destroy forests. This possibility occurs in the model when the available fuelwood is less than the fuelwood requirement. If there is a deficit, this is made up by destructive fuelwood harvesting. (Figure C-9.) The rate of conversion is determined by the size of the previous fuelwood deficit, the fraction of land converted from open woodland, which is the
Fuelwood collection from closed forest and open woodland debris is a small fraction of the biomass of these two categories, multiplied by their respective area. Fuelwood from agroforestry is calculated in a similar manner, but the fraction of wood collected is much higher. Agroforestry systems are often designed to produce large biomass harvests from trees that regrow after cutting. Harvest from tree plantations can be both destructive and non-destructive. As tree plantations mature, they need periodic thinning to produce
optimal growth. The thinnings provide biomass that
ratio of open woodland to total natural forest (Figure C-4), and the difference in biomass between open woodland and grazed or degraded land. If the fuelwood deficit is 10,000 tons, the fraction of open woodland to closed forest is 0.25, and the biomass of open woodland and grazed or degraded land is 125 and 25 tons per hectare, respectively, then the area of open woodland converted to grazed or degraded land from destructive fuelwood collection will be 25 hectares ([10,000 x 0.25] I [125 - 25]).
~
Figure 4. Land Flows to and from Closed Forest
OPEN WOODLAND (HA)
~~
CDNYERSI~ OF CF TO OW (HA/YAY
i\
V r\
~ I\. ~
..... CXI
SHIFTlNlI AlIRICULTURE (HA)
I~
r'"
.............. . /
/,
VREYERSION ow TO CLOSED FOREST (HA/yR)
.
CLOSED FOREST (HA)
.............~
'"
............ CDNYERIION
CONYERSION OF Cf' TO IHIFT. M. (HA/YA)
OF CF TO AlIAOFOA. (HA/YR)
1\ II
I,IcDNYEAIION OF CF TO I\EA.. ADAIC (HA/YA)
~.
PERMANENT AIIAICULTUIW. LAND (HA)
.. P'
AGIROFOAEBTAY LAND (HECTAREI)
Figure 5. Land Flows to and from Open Woodland
---. •
CLOSED FOREST (HA)
TREE PLANTATIONS (HA)
+ CONVERSION OW TO mEE PLANTATIO;IS (HAIYR)
REVERSION OW TO CLOSED FOREST (HAIYR)
... ..... 1
Figure C-3. Agricultural Land Shortfall Is the Difference Between Current Agricultural Land and Future Demand RAnD Dr PRODUC~ DF AGRDFORESTlY TO PERil. AGIIICULTURE
AGIlDFDIlESTRY LAND (HA)
-eI I I I I I
, .... -- .... I
\ REQUIRED AGRICULTURAL LAND (HA)
I \
\
,
I
....... I
I
I I I /
I
I
"
.... .... ,
m
., , ~
I
I
I I
I I J PERIIANENT MRICULTURAL LAND (HA)
I
...
$ll..
... .... --- , . ' ........
/
I I
,-
,. ,-
,.
, ,,-
~
---
.... ....
... ...
...
....
... ,
-.... .... .... ....
,
.... ....
.....
....
-eRATIO OF PIlDDUCTMlY OF SHIFTING MIlIC. TO PERil. AGRICULTURE
\ \
\
\
t SHIFTING AGRICULTURAL LAND (HA)
Figure C-4. Open Woodland Is Converted to Agriculture Based on Predominance and Need
~
FlWmaN OF NEW MRIC. ~ND BROUIHT INTO PERMANENT PRODUCTION
II
AIRICULTUIIAL LAND IHDRTFALL (HA))
\
-.
\
CLOSED FOREST (HA)
..,
.., .., ..,
.., .., ..,
..,
,,-- ..... '
;0.... __ '" /
..,
\
I
/
MAXIMUM PERM. MRIC. LAND (HA)
........... -
00 ......
-........
--- --- ---
~
/ ~
~
~
I
I I \ \
(-
\ OPEN
.OOD~ND
(HA)
--"
,.
.., " .., ..,
.-
.....
.....
.....
.....
,,
/
, \
\
-
\
I
•
.............
/
~
............
CONVERIIDN I ow TO PERI. MRIC. ~ND (HA/YR)
~
-- ------ ... ......
.....
PERMANENT AlRICULTURAL LAND (HA)
~
Figure C-5. In Addition to Predominance and Need, Closed Forest Conversion Is Based on Forest Protection
TIME REQUIIlED TD CONVERT TD AGRIC. LAND (YEARI)
IIAXIIIUII PERil. AIIRIC. LAND (HA)
.
""{
I
\ \
.....
PROTECTED CLOSED FOREST
~ (Xl (Xl
,,
/
,,
....
I I
" " .....
... ........... "
'.~
,
\
FRAC. OF lAND IROUIIHT INTD PERil AGRIC. PRDDUCTION
.....
... ...
/ /
.....
-- -- --
- ............
I I \
J I
/'
I
+---
--...........
... ...
D CLOSED FOREST (HAl
-
-
-
-4
\
..........
.....
..... I
'...
,
........... . / '
............
CONVERS'ON OFCFTD PERil. AGRIC. ~D (HA/YR
AQRICULTURAL LAND SHORTFALL (HA)
.....
....
... ....., .....
""
\
-
--- ...
.....
",
_-
' \
I
I
/ .;
" .... PERIIANENT AIIR'CULTURAL LAND (HA)
Figure C-6. ation and Fallow Period s The Fallow Cycle for Shifting Agricu lture is Based on the Cultiv IIATURATIOII liME OF
IIA'nIRAlIDN TIlliE OF FOREIT FAlLDW
P'IIREIIT P'ALUHr (VIII)
(YEARI)
~
"
;II'
."".-- ... ,
".....
....
/
,
~
/
-_
"
.... .....
....
, \
I
\
I I I I I
...
~
FOREIT FALLOW AGING CATEGORY 3 (HA)
FOREBT FAllOW AGING CATEGORY 2
FOREST FALLOW AGING CATEGORY 1 (HA)
(HA)
, \
, ... -- ,
I I 00
;
I
CO
CULTIVATiON PERIOD (YEARS)
RETURN OF FF2 TO SHIFT AI: (HA/YR)
.,.
I I
,, , , I
-- --
" -_ ------ -- --....
_
-
I
-
....
-
-
\
AGRIC. LAND
~
SHORTFALL (HA)
- --.... .... -- ... -- --" --- " .... ....
.... .....
....
\
....
"
I
I
,/
RAllO OF PRODUCTIvnv OF SHIFT. AGRIC. TO PER'" AGRIC. LAIID
....
....
,,
,
SHIFTINIl AGRICULTURE (HA) RE11REMENT OF SA TO FFI (HA/yR)
~ OJ
MATURATION lillIE OF FOREST FALLOW (YEARS)
" -....
RETURN OF TO SHIFT NJ (HA/YR)
m
;II'
1._ - --
-3 ..--Figure C-7. Sources of Fuelwood Include Debris, Conversion, and Harvest
"" co o
,.
"'" "" "
"
""
"" " "
" "" "
,. " "
"" " ""
" " "
""
,. ""
Figure C-8. Tree Plantations Are Represented by Three Age Classes to Capture Growth
8lLUED OR DE8IlADED LAlID (HA)
DEIIIRED ANNUAL PLNmNG OF TREE PLAIITAnONI (HA/YR)
.-
",
~
CONVERSION
~~m
_
_
_
-
-
--_
,. ,. ,.
,;'
'"
............ IllATURAll0N TillE
~rn
TP (HA/VRI
MATURATION nilE FOR TPI (YRI)
(YRS)
-----r
Y' ~