Aug 31, 2010 - authenticity of the auralizations produced by modeling software is a subject for ..... built with MAX/MSP software running on a Macbook Pro. The.
Proceedings of the International Symposium on Room Acoustics, ISRA 2010 29–31 August 2010, Melbourne, Australia
Evaluation of concert hall auralization with virtual symphony orchestra Jukka Pätynen and Tapio Lokki Aalto University School of Science and Technology, Department of Media Technology, P.O.Box 15400, FI-00076 Aalto, Finland PACS: 43.55.Ka, 43.55.Ta, 43.55.Gx
ABSTRACT Authenticity of the simulation of room acoustics is evaluated by comparing auralizations with real recordings. Impulse responses are recorded in two concert halls with 34 loudspeakers positioned on the stage in the shape of an orchestra and a 3D microphone probe for spatial reproduction. The acoustics of the same concert halls are simulated with acoustics modeling software. B-format impulse responses are calculated by using the identical source and receiver positions as in the real halls. Additionally, two processing methods are applied to the simulated responses in order to decrease the difference in acoustical impression. Objective room acoustic parameters between the real and simulated halls are compared, and a listening test utilizing convolutions with anechoic orchestral music is organized. The results suggest that the subjects can be categorized in two groups having preference of brightness or naturalness. Depending on the music style, auralizations with processed responses are assessed equal or better than the real hall in terms of instrument balance and brightness.
INTRODUCTION Many current acoustic design products offer auralization capabilities. Applicable cases for auralization can be for instance industry and noise transmission, acoustics in public spaces, or ultimately, concert hall design. In the latter use, the requirements for authenticity are very high. Previously, it has been claimed that auralization can provide authentic results with hardly audible differences [1]. In spite of the gradual improvements in the modeling techniques, authenticity of the auralizations produced by modeling software is a subject for debate on the practical field. Presuming that such auralizations have defects, this study aims to resolve the auralization shortcomings with regard to the authenticity, i.e., what are the existing major flaws and what kind of issues should be improved. Evaluation of the auralization quality is a multidimensional problem. An overview discussing various issues, including listening test methodology, reference measurements, anechoic stimuli, modeling, and reproduction, has been published by Lokki and Savioja [2]. Lokki [3] has collected a summary of the previous studies on auralization evaluations. Some recent related research is presented in the following. Related work Choi and Fricke [4] have performed a comparison between two real concert halls and auralizations. Room acoustical parameters were analyzed, and measured and simulated binaural room impulse responses were convolved with a segment of single-channel monaural anechoic music. The convolved stimuli were presented to the subjects with headphones. They found significant differences between subjective preferences for auralizations and recorded music, while the results were inconclusive.
ISRA 2010
Saher et al. [5] have studied the quality of auralization by comparing binaural in-situ recordings and computer simulations of speech in a small room. Subjective descriptors such as "sense of space", "timbre", and "reverberance" were used, and spatial and sound color differences were found between the auralizations and in-situ recordings. Nilsson and Ekman [6] have compared auralizations and in-situ recordings with a single source in a classroom and an auditorium. Subjects assessed the samples by realism, similarity, intelligibility and sound quality. Auralized sound was considered harder, less full, less dull and more metallic than in-situ recordings. Vigeant et al. have presented a comparison between auralizations having various source type and orchestra configurations [7]. Results were investigated by objective parameters and subjective evaluations. Auralizations were found to be more realistic when multiple sources are used instead of a single source. In short, previous research has been concentrating on comparing in-situ recording with an auralization using a single source. On the other hand, comparisons with more complex configurations have been made only between different auralizations. Here, a large orchestra-like sound source is compared between real halls and their auralized counterparts. This paper presents first the used concert halls, the loudspeaker orchestra and their simulated counterparts. Second, two methods devised for improving the realism in auralization are described, after which the objective comparison is summarized. Finally, the listening test method and the obtained subjective results are presented and discussed.
1
29–31 August 2010, Melbourne, Australia 25
20
15
Proceedings of the International Symposium on Room Acoustics, ISRA 2010 10
0m
5
3 6
20
5
19
2
+ P3
22
1 15
7
16
17
4
21
24
+ P2
23
10
18
a)
8030A, and two larger 1032A loudspeakers. 8030A and 1032A loudspeakers were dedicated to the low frequency instruments due to their better response at low frequencies. An overview of the installed loudspeaker orchestra is shown in Fig. 3b.
8 24
11
+ P1
9
12 14
13
Room impulse responses were measured using a GRAS vector intensity probe Type 50 VI-1 [10]. The probe enables the use of different distances between the microphone capsules. Two measurements were performed in each position using 25 mm and 100 mm spacers. The advantage here is that better figure-ofeight directivity patterns can be obtained for extended frequency range compared to the use of a single spacer. The two intensity probe measurements were converted to a pair of B-format responses.
3 6
20
5
19
2
+ P3
22
1 15
17
4
+ P2
21
24
23
16
10
8 24
11 9
+ P1
18
7
b)
12 13
14
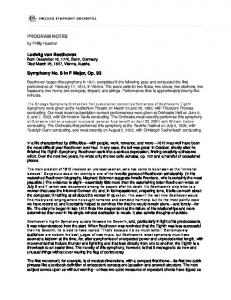
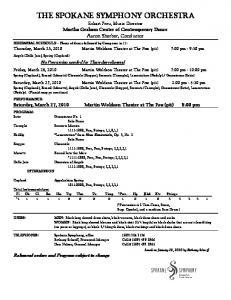
Figure 1: Plans of the concert halls with receiving positions P1-P3. The loudspeaker orchestra layout is shown on the stages. a) Sello hall. b) Konservatorio hall.
HALL MEASUREMENTS Two shoebox-type concert halls are used in this study. The halls are relatively small, but the stages are large enough to accommodate a symphony orchestra. The Sello hall has 397 seats, and the audience area has an ascending section. There is no balcony in this hall. The second hall, Konservatorio, has slightly less seats, 354, on the main floor. The balcony can accommodate 116 listeners. Floor plans of both halls are shown in equal scale in Fig. 1. The most prominent difference between the halls is the more inclined main floor in the Sello hall. In addition, the Konservatorio hall walls have a dense, diffusing structure pattern, while in Sello hall the otherwise smooth walls have extrusions of different sizes (see Fig. 2). The source used in the halls was a loudspeaker orchestra that consists of 34 loudspeakers positioned on a stage in a predefined form of a symphony orchestra (see Fig. 1). The principle of the loudspeaker orchestra is to function as a large source capable of producing repeatable orchestral music. Details of the original version of the loudspeaker orchestra have been previously presented in [8]. Here the loudspeaker orchestra was used for measuring the impulse responses from each of the 24 independent loudspeaker channels. Few improvements were made to the original loudspeaker orchestra concept. Principally, nearly all loudspeakers pointed into the direction of the conductor. Two loudspeakers representing the French horns were aligned to point backwards to the characteristic direction of the instrument bell. In part of the channels representing the string instruments, two loudspeakers shared the same channel, the assisting loudspeaker was on the stage floor pointing upwards. Therefore there were 34 loudspeakers but only 24 channels. This arrangement was chosen for distributing the radiated sound energy more evenly and thus improving the overall directivity closer to that of the real string instruments [9]. The loudspeaker orchestra incorporated 26 Genelec 1029A, six
2
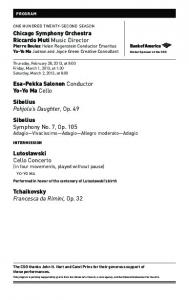
Three receiving positions were used in both halls. The positions were at corresponding distances from the loudspeaker orchestra in both halls. The locations for the receiving positions were also identical in both halls with regard to the loudspeaker orchestra. Thus, the only variable being the surrounding concert hall (see Fig. 1). In the following, the analysis is concentrated mostly into two receiving positions, Sello P1 and Konservatorio P3. In Sello P1 the distance to the sources is small, while in Konservatorio P3 the sound field is very diffuse. Therefore they represent different conditions in hall acoustics. They are also used in the consequent listening test. The performance of the loudspeaker orchestra is shown in Fig. 4. The magnitude responses of music played with the loudspeaker orchestra is compared with an authentic, full-size professional symphony orchestra. The analyzed music piece is a 13 s passage form Beethoven’s Symphony no. 8, 1st movement, bars 13-17 [11]. Both samples were recorded in Sello hall at position P2 without audience. AKG C480K microphone with omnidirectional capsule was used for recording the authentic orchestra [12]. The figure indicates that the magnitude response of the loudspeaker orchestra is comparable to a real symphony orchestra. The fundamental frequency of the lowest notes written in the passage is approximately 52 Hz (G]1 with double basses). The largest difference is found at the lowest octave. The authentic orchestra had six double basses, while the loudspeaker orchestra contained only four double bass tracks. Due to the applied solutions in the source and receiving configurations, the measured room impulse responses are not exactly impulse responses in the standardized sense [13]. However for simplicity, the measured and simulated responses are referred in the following as impulse responses.
HALL SIMULATIONS The acoustic 3-D models were available from both Sello and Konservatorio halls. Odeon software [14] version 10.1 was used to simulate the acoustics of the two concert halls. The models were obtained directly from the acoustic consultants, and the same models were used in the actual design process, e.g. for estimating room acoustical parameters, reflection paths, and simulating energy distribution in the halls. The materials assigned to the major model surfaces were corresponding to wooden floor on joists, and painted concrete for the stage and the walls, respectively. The walls in the Konservatorio were modeled as flat, although in reality there are a diffusing surface (see Fig. 2a). Such surfaces were modeled by using the scattering coefficient of 0.7. The extruding slots in the Sello hall were modeled as such, however, the scattering coefficient of 0.7 was used also in this case (see Fig. 2b). The loudspeaker orchestra was recreated in the Odeon models
ISRA 2010
Proceedings of the International Symposium on Room Acoustics, ISRA 2010
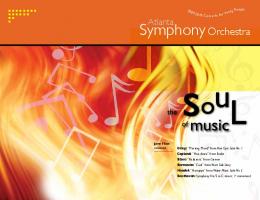
(a) Konservatorio hall, receiving position P3.
29–31 August 2010, Melbourne, Australia
(b) Sello hall, receiving position P3.
Figure 2: Corresponding views of the two measured halls.
(a)
(b)
Figure 3: (a) Odeon 3D rendering of Konservatorio hall, P3. (b) The loudspeaker orchestra in Sello hall as seen from receiving position P1. using the actual positions and orientations for the loudspeakers on the stage. Directivity patterns were measured for each of the three types of loudspeakers, and the directivities were applied to the corresponding point sources in the Odeon model. The average power responses of the measured loudspeakers were confirmed to correspond to the manufacturer specifications [8]. Thus, the same setup existed for real and simulated acoustics. Additionally, the impulse responses from the same positions were also calculated with omnidirectional point sources. Following rendering options were used: Number of rays 50000, Impulse response resolution 1.0 ms, Transition order 2, Desired reflection density 999999/ms. The impulse responses were exported in B-format for spatial reproduction.
IMPULSE RESPONSE PROCESSING In preliminary ad-hoc listening two prominent problems were noticed with the auralized signals when compared to the convolutions with the responses from the real hall. First, depending on the position in the hall, the balance between the instruments was noticed to vary strongly. This was the most pronounced when using natural directivity patterns, whether they were directivities of loudspeakers or actual instruments. Second, the frequency responses were much flatter compared to the measured responses. Especially the high frequencies were pronounced, which resulted in an unnaturally bright timbre in the auralizations. In order to improve the deficiencies observed with informal
ISRA 2010
listening in the auralizations, two methods were devised in order to bring the auralizations closer to the real hall. First, the overall balance between the sources or, instruments, were equalized. This was accomplished by calculating the sound energy of the A-weighted impulse responses per-channel basis. The reference value was obtained from the measured B-format omnidirectional response. Simulated impulse responses from Odeon were amplified or attenuated so that the A-weighted energy was equal to the corresponding reference. This procedure is referred in the following as channel balance correction. Second, filtering was applied for reducing the difference in the frequency responses between the measured and simulated halls. A straightforward method is to design a filter to reduce the difference between the measured and simulated magnitude responses. However, this is not feasible due to the time-varying magnitude responses, i.e. frequency band dependent reverberation time. Such a filtering would result in a very dull sound, as the filter with lowpass characteristics would affect greatly to the direct sound. For this reason, the following filtering approach with time-frequency processing was applied. The corresponding measured and simulated responses were aligned with regard to the direct sound using the omnidirectional B-format channel. Short-time Fourier transform (STFT) was applied to both responses with FFT length of 4096 samples and four-time overlap, producing a spectrogram. Then, a differ-
3
Proceedings of the International Symposium on Room Acoustics, ISRA 2010
Comparison of magnitude responses Sello, P2
−10
15
kb woods
10
−15 −20 −25
5 0
vc
−30
−5
−35
−45 −50
100
1000 Frequency [Hz]
vla
Authentic orchestra Loudspeaker orchestra Odeon, omni0.0 (balance corrected) Odeon, lps0.5, (balance and filtering)
−10 II vl
−40
10k
Figure 4: Comparison of the magnitude responses from a recording of an authentic orchestra and the loudspeaker orchestra at Sello P2. A same passage from Beethoven’s Symphony no. 8 was analyzed in both cases. Lower curves show the corresponding magnitude responses for auralizations with two different types of processed responses (see Table 1). The responses are shown with octave smoothing.
ence magnitude matrix was calculated frame-wise between the two spectgrograms. Moderate smoothing was applied to each difference frame in order to prevent colorations. Finally, each channel of the spatial impulse responses were multiplied in the STFT-domain with the difference spectrogram. In addition, parameter α = [0...1] was used for controlling the strength of the filtering operation. With α = 0 STFT filtering has no effect and with α = 1 the spectrogram of the measured impulse response is transferred in whole to the simulated response. It should be noted that a shorter FFT length would provide better accuracy of the details and individual reflections in the impulse response. However, the low frequencies in the signal after inverse STFT would suffer considerably from FFT lengths below 4096 samples. The chosen values result in a time resolution of 21.3 ms in the processing. Two versions of processing methods combining the channel balance correction and the STFT filtering are used in this study. With the original simulated responses from Odeon using point sources with omnidirectional or loudspeaker directivity pattern, this results in a total of six simulation methods. They are listed in Table 1.
COMPARISON OF OBJECTIVE PARAMETERS Two most obvious differences between the impulse responses from Odeon simulations and the hall measurements were, first, the variation of gain in source positions and, second, the brightness or timbre. In the auralization experiments preceding this
Table 1: List of the simulated impulse responses with applied processing methods. α denotes the strength parameter in STFT filtering method. Title omni omni0.0 omni0.5 lps lps0.0 lps0.5 real
4
20
Source directivity omni omni omni measured LPS measured LPS measured LPS LPS
A-weighted eq. no yes yes no yes yes (reference)
α 0 0 0.5 0 0 0.5 -
−15 I vl
Relative magnitude [dB]
−5
ps
0
Omnidirectional
brass
Loudspeaker dir.
A−weighted difference [dB]
29–31 August 2010, Melbourne, Australia
Sello, P1 Kons., P3
Sello, P1 Kons., P3
−20
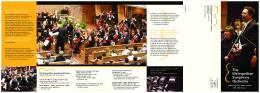
Figure 5: A-weighted level differences in the simulated loudspeaker orchestra with measured loudspeaker directivities and omnidirectional sources. Shown values are in relation to measurements in the halls. Rough grouping of loudspeakers is shown in the left edge. p and s denote percussions and soprano, respectively.
study the instrument balance in the orchestra was noticed to differ greatly. The overall balance of the source points was investigated by calculating A-weighted sound energy from the simulated and measured impulse responses in each loudspeaker channel. The results are shown in Fig. 5. Most of the differences were below 5 dB. However, relative gains for the channels representing the French horns were much higher than in the measurements, especially when using loudspeaker directivities. The worst case, +15 dB, was in position P1 in Sello hall, where the directivity of these sources point away from the receiving position. A generic trend can be noticed from the loudspeaker directivities: the channels having loudspeakers pointing into the direction of the receiver, the estimated gains are lower and vice versa. Generally, the gain differences were not as prominent in simulations having omnidirectional sources. The processing methods that include A-weighted equalization in Table 1 have their impulse responses attenuated or amplified by the respective values in Fig. 5. Hence, for those processed responses all corresponding values are 0 dB. For the brightness, the difference was investigated by calculating the relative mean gain and reverberation time at octave bands over all loudspeaker channels. The results for octave band gain differences are shown in Fig. 6a. Due to the averaging over 24 channels and the difference caused by channel level corrections, the results for the uncorrected methods in the first and fourth columns (omni and lps) are not entirely comparable to the rest of the values. Methods omni and omni0.0 in the two first columns show a strong inclination towards high frequencies. This results from the absence of source power response correction, i.e., source directivity. As indicated by the third columns, the frequency response with STFT filtering (method omni0.5) is considerably closer to the reference. Three rightmost columns in Fig. 6a show the results between channel balance corrected responses with simulated loudspeaker directivities. The overall channel balance over the octave bands is closer to the measured spectrum with original as well as the
ISRA 2010
Proceedings of the International Symposium on Room Acoustics, ISRA 2010
29–31 August 2010, Melbourne, Australia
Sello, P1
Konservatorio, P3
+10.0
+3.9
+7.0
+5.7
+1.9
8k +10.8 +10.2 +4.4
+7.5
+6.8
+2.8
4k
+3.0
+2.6
+1.1
−0.4
−1.0
−0.6
4k +2.8
+2.8
+1.4
−0.2
−0.4
−0.1
2k
+1.6
+1.6
+1.2
−1.3
−1.4
−0.2
2k +0.6
+0.5
+0.4
−1.9
−2.2
−0.9
8 6 4 2
1k
−1.5
−1.5
−0.1
−2.0
−2.0
−0.3
1k −3.1
−3.0
−1.5
−3.7
−3.7
−1.8
500
−2.5
−2.5
−0.4
−1.1
−0.8
+0.2
500 −3.3
−3.3
−1.4
−2.2
−2.0
−1.0
250
−4.5
−4.1
−1.8
−0.8
−0.1
+0.1
250 −4.0
−3.9
−1.7
−0.6
−0.2
+0.1
125
−6.9
−6.2
−4.0
−1.4
−0.5
−1.1
125 −3.8
−3.2
−1.6
+1.1
+1.8
+0.9
0 −2 −4
omni omni0.0omni0.5 lps Method
lps0.0 lps0.5
omni omni0.0omni0.5 lps Method
lps0.0 lps0.5
Relative gain difference [dB]
Octave band [Hz]
10 8k +10.9
−6 −8 −10
(a) Gain difference Konservatorio, P3 ** ** * ** * * 8k +0.16 +0.17 +0.09 +0.18 +0.13 +0.08 1.40
** ** ** * ** ** 4k +0.13 +0.16 +0.13 +0.11 +0.17 +0.14 1.24
4k +0.00 +0.00 +0.02 −0.07 −0.03 +0.00
1.83
2k +0.00 +0.01 +0.01 +0.00 +0.03 +0.01
1.58
* * ** * 2k −0.15 −0.13 −0.08 −0.23 −0.17 −0.10
2.16
* * 1k −0.09 −0.06 −0.03 −0.12 −0.06 −0.05
1.75
* * * * 1k −0.16 −0.13 −0.08 −0.21 −0.16 −0.09
2.26
** ** * ** ** * 500 −0.22 −0.19 −0.16 −0.20 −0.21 −0.17 1.81
500 −0.05 −0.02 −0.02 −0.02 −0.01 −0.02
2.18
* * * 250 −0.06 −0.11 −0.08 −0.03 −0.14 −0.12 1.87
* * ** * 250 +0.18 +0.15 +0.08 +0.24 +0.18 +0.09
2.24
* 125 +0.06 −0.03 −0.02 +0.11 +0.00 +0.03
1.64
125 +0.02 −0.03 −0.01 +0.11 +0.06 +0.04
2.38
real
omni omni0.0omni0.5 lps lps0.0 lps0.5 Method
real
omni omni0.0omni0.5 lps lps0.0 lps0.5 Method
0.5 0.4 0.3 0.2 0.1 0 −0.1
EDT difference [s]
Octave band [Hz]
Sello, P1 **** ***** *** ** **** *** 8k +0.19 +0.22 +0.15 +0.12 +0.21 +0.15 0.85
−0.2 −0.3 −0.4 −0.5
(b) Early decay time difference Figure 6: Comparison of the gain and reverberation time in the halls at octave bands. Values shown in (a) are in relation to the corresponding measured values. JND is 1 dB [13]. Difference to the reference in JNDs for EDT is visualized with the respective number of small dots in (b). Positive values indicate excess gain or reverberation in the simulations. channel balance corrected simulations (lps and lps0.0). However, the 8 kHz octave band still exhibits a noticeable peak in both positions. Again, applying the STFT filtering in the last column brings the spectrum closer to the measured reference. Between 250-4000 Hz, the values are within 0.8 dB in Sello P1 and within 1.9 dB in Konservatorio P3. A similar comparison with early decay times is shown in Fig. 6b. The general trend is that the balance correcting does not change EDT estimates, while the STFT filtering improves values closer to the reference. Compared to the standard 5% JND, responses with the balance correcting and the STFT filtering have differences below 1 JND in many cases (see Fig. 6b). Values for reverberation time follow the same pattern as seen with EDT. However, the effect of the filtering is even more pronounced. The improvement with T30 values is circa 30-50% in both halls. With method lps0.5, the largest deviations from the reference at the 250-4000 Hz octave bands are 0.07 s in Sello P1 and 0.16 s in Konservatorio P3. Although the estimates for T30 show larger improvements, EDT values are shown in Fig. 6 for the reason that the listening test employs continuous signals. EDT is regarded to correspond better with the perceived reverberation during running music [13]. Regarding lateral energy (LF), either the channel balance cor-
ISRA 2010
rection or the STFT filtering do not present any changes in the values, as all B-format channels are treated equally. In Sello P1, LF values have major differences only at the 125 Hz octave band, or at Konservatorio P3 at 250 Hz. These observations are in effect also for clarity (C80). In general, the channel balance correction and STFT filtering can be noticed to have the desired effect on the impulse response energy parameters. For reference, discussions with the involved consultants have revealed that at the time of completing the building of the two halls, the estimates on the gain and reverberation parameters from the simulations proved out to be lower than measured in the finished halls. The same observation is made in this study as well. At the 500-1000 Hz octave bands EDT and T30 estimates were lower in all cases compared to the measured values.
SUBJECTIVE EVALUATION The principal objective in this study is to find the most prominent deficiencies or differences between the auralization and the real hall. As for the subjective evaluation, this could be accomplished by a pair-wise comparison between auralizations and the real hall as a reference. However, the authors decided in favor for a parallel evaluation with a hidden reference, as this could potentially give results where the auralization was thought better than the real hall. With given reference this would
5
29–31 August 2010, Melbourne, Australia
be unlikely. Anechoic stimuli and processing For the listening test, anechoic orchestral recordings were used in the auralizations. As discussed in [11], one musician played all the parts of a particular instrument in the anechoic chamber. Unlike for wind instruments and percussions, this can be considered problematic with the strings. In a typical symphony orchestra, the number of string instrument players can vary greatly from few up to 18 per part. Individual musicians and instruments have their own character, tone and interpretation. This variation was not retained in the recording process. Therefore the string tracks require certain processing in order to improve the authenticity before convolving the tracks with impulse responses for the listening test. A few methods have been proposed in recent auralization studies. For instance, Vigeant et al. have used constant prime number delays up to 23 ms on up to seven copies of a single track [7]. Lokki has applied pitch synchronous overlap-add algorithm and phase scrambling for copied signals [15]. Following the intuitive concept on a string section, the authors have proposed a combination of constant delays and pitch shifting for producing a more natural sound of the strings [16]. This idea has been refined yet further by novel methods. Recently, the authors have collected data on the asynchronous nature of bowing during performance with video tracking. Such data is then utilized to generate pseudo-random time differences with continuous variation for each copied track. The time differences follow the distribution obtained from video tracking. Furthermore, employing recorded signals from various directions and amplitude modulation have been noticed to improve the naturalness of a section sound in informal listening. The convolved string tracks were processed with the combination of methods described above. The original recordings were performed with fixed input gains over the whole recording period [11]. Therefore the balance between instruments should be considered nearly or entirely authentic without any need for adjusting the sound levels. The following two short excerpts of symphonic music were used in the listening test. Simulated string section sizes are indicated as I violins / II violins / violas / cellos / double basses. • W. A. Mozart (1756-1791) An aria of Donna Elvira, Don Giovanni, bars 110-116 (strings: 8/8/6/6/4). Duration 11 seconds. • G. Mahler (1860-1911) Symphony no. 1, 4th movement, bars 11-19 (strings: 16/16/10/8/8). Duration 11 seconds. The excerpts represent very different styles on purpose. Mozart’s aria has a soprano soloist, and represents typical classical style, while Mahler’s symphony is more complex music. In the Mahler the brass section has several short chords. On the contrary, the Mozart passage is more of a flowing type. Listening test setup The listening test was arranged in a large, dimmed, semianechoic environment where the walls and ceiling are of absorbing structure. The reproduction of the stimuli was accomplished with a 2D loudspeaker setup having eight Genelec 1029A loudspeakers with 45 degrees intervals around the subject at 2.0 m radius. The overall output levels at the listening position were matched within ±1 dB and the magnitude responses were inspected for anomalies. B-format impulse responses from the measurements and simulations were first converted to spatial impulse responses for each
6
Proceedings of the International Symposium on Room Acoustics, ISRA 2010
reproduction loudspeaker by using Spatial Impulse Response Rendering [17, 18]. It should be noted that the channel balance correction and the STFT filtering was performed individually to each of the eight spatial responses in order to prevent faults in the spatial conversion. Finally the anechoic samples were convolved with the responses for spatial reproduction. A total of 28 different stimuli were created for the listening test (2 music pieces × 2 receiving positions × 7 cases). The seventh case was the convolution with the measured responses as a hidden reference (see Table 1). One test cycle consisted of four pages, each containing the seven cases. The stimuli were presented to the subjects with a user interface built with MAX/MSP software running on a Macbook Pro. The interface allowed to play the stimuli synchronously in parallel for easy comparison. Selective looping of the stimuli was possible. Subjective evaluation and analysis The evaluation was performed by asking the rating of the stimuli on a single attribute, preference, with the continuous scale of worst—best. The subjects were instructed to concentrate on the acoustics of the stimuli. As the preference can vary much between subjects, verbal and written comments on their assessment criteria were collected after completing each round of the test. The same test was repeated three times in a row with each subject in order to ensure the consistency of the answers. The subjects were not told that the three rounds consisted of the same samples in randomized order. Instead, the subjects were encouraged to use new criteria for each round if necessary. This way it was possible to monitor the learning effect with the stimuli and the refinement of the criteria. Ultimately, the subjective criteria for individual preferences could be resolved and simultaneously gather information on the most prominent differences. Eleven experienced listeners participated into the listening test. Ten of the subjects were males. The subjects were mostly graduate or post-graduate students in acoustics, music and/or spatial audio. All subjects had at least moderate musical experience. With three identical test cycles completed with each subject, this resulted in 33 evaluations for each stimuli. The subjects were instructed to make use of the full scale of worst—best. While most subjects followed this instruction, continuous scaling between 0...1 was applied in order to ensure the use of the full scale. The test results were analyzed with ANOVA and five factors: method in Table 1, hall and position (Sello P1 or Konservatorio P3), music (Mozart or Mahler), test round, and the subject. Results Analysis with Matlab using anovan-function yielded the following results. The subjects’ consecutive test rounds do not have significant differences (F(20, 923) = 0.5, p = 0.97). Significant differences were found with significance level of 0.05 in the main effects of the method (F(6, 923) = 89.49, p = 0), music (F(1, 923) = 4.04, p = 0.045), and subject number (F(10, 923) = 2.21, p = 0.017). The significant differences between subjects and between methods are rather self-explanatory. However, it is interesting to notice that the music is not an insignificant factor. Main effect for method factor is shown in Fig. 7. The means and confidence intervals are based on 132 assessments. Most prominently, the lps method received clearly the worst mean
ISRA 2010
Proceedings of the International Symposium on Room Acoustics, ISRA 2010 Method, mean effect
omni0.0 methods preferred by group 2 exhibit a brighter timbre while lps and lps0.0 preferred by group 1 have a timbre closer to the real hall. Still, even the STFT filtered variants have a considerable level increase at high frequencies.
1
0.8 Normalized score
29–31 August 2010, Melbourne, Australia
In addition to balance and brightness or frequency response, other criteria for preference that are related to spatial impression were stated in a part of the verbal answers. These descriptors include spaciousness, immersiveness or envelopment, breadth, and intimacy. Grouping was also tried based on the statements on spatial criteria. However, no difference was found between such groups.
0.6
0.4
0.2
0 omni omni0.0omni0.5 lps lps0.0 lps0.5 method
real
Figure 7: Mean scores and 95% confidence intervals for the different auralization versions and the real hall.
score. The collected evaluation criteria explains this results. All subjects did mention the instrument balance to be a very important criteria. As shown in Fig. 5, the French horns are greatly emphasized. In Mozart this resulted in a very bad overall balance, as the soloist and the strings were masked by the horns. However, in Mahler the brass section is naturally stronger than in Mozart. The interaction effect between method and music is significant (F(6, 923) = 38.36, p = 0). Large improvement was noticed by balancing the channel levels in method lps0.0. The real halls were assessed just below the other auralizations. This was most probably caused by the relative lack of brightness exhibited in real halls (see Fig. 6a). As the STFT filtering brings the brightness in omni0.5 and lps0.5 closer to that in the real halls, these methods experienced a slight drop in mean scores due to the same reason. Further interactions reveal more detailed features in the results. Interaction between method and subject is significant (F(60, 923) = 11.14, p = 0), but interaction between music and subject is not significant (F(10, 923), p = 0.16). The two receiving positions did not have significant differences in the preference (F(1, 923) = 0.11, p = 0.74). Visual inspection of an interaction plot suggests that the subjects are divided into two groups. This possibility was investigated by categorizing the test rounds for each subject into two groups with k-means clustering. By applying the method in Matlab with correlation distance metric, the subjects formed two defined groups. The different behavior of the groups is particularly visible with Mozart in Fig. 8. The groups rated the methods differently, and the interaction between groups and method yielded significant difference (F(6, 923) = 55.85, p = 0). Also the three-way interaction between methods, groups, and music has significant differences (F(6, 923) = 2.77, p = 0.01). The differences in the group behavior are reflected in the verbal feedback. Besides the instrument balance, group 2 mentioned brightness as an important criteria for preference, while group 1 concentrated more on naturalness. Six and five subjects categorized into groups 1 and 2, respectively. The results for Mahler show that group 2, valuating the brightness, rated the real halls unanimously for the worst. Group 1 preferred auralizations with simulated directivities and processing, but the overall pattern is less pronounced pattern than with Mozart (see Fig. 8). With Mahler, the mean rating for the real halls is also noticeably lower than with Mozart for group 1. The comparison of the magnitude responses with Mahler is presented in Fig. 9, where it can be seen that the spectral balance between omni and lps methods is the opposite on both sides of 1 kHz. Omni and
ISRA 2010
DISCUSSION AND FUTURE DIRECTIONS The results from the listening test reflect well the prior expectations. Especially the assessment by group 1 with Mozart represents accurately the authors’ viewpoint. The low scores for unprocessed omni and lps methods were anticipated due to their excess brightness or poor balance between instruments. The improvement with channel balance correction and STFT filtering was considerable. However, the processed auralizations were not expected to reach an equal mean score with the real halls. The soprano singer could have had a positive influence on the assessment with Mozart, as human voice provides a good reference for the comparisons. The reason for the apparent difference in Mahler is not straightforward. Group 2 follows the trend of clearly preferring bright samples with acceptable balance (omni, omni0.0 and lps0.0). It is possible that the subjects in group 2 have found the attenuation at high frequencies to affect the brass instrument sound too much. The real halls have a noticeably dull sound compared to the unfiltered auralizations. The same reason might be applicable to the assessment by group 1. Methods lps0.0 and lps0.5 that received the best mean scores have a clear, yet not disturbingly bright sound for a concert hall. However, it has to be reminded that the used loudspeaker orchestra provides a magnitude response close to an authentic symphony orchestra (see. Fig. 4). A few subjects in group 1 described that the preference was more difficult to assess with Mahler than with Mozart. On the other hand, comments were received from subjects falling into group 2 stating the opposite. This supports the theory on which the methods omni and omni0.0 received very good scores with Mahler. In this study the preference criteria was dominated by the instrument balance and brightness. In other subjective evaluations on auralization, Nilsson and Ekman have found out that auralized sounds were perceived less dull and more metallic than their real counterparts. Here, the brightness factor suggests a similar outcome. Furthermore, as for evaluating auralized small spaces on timbral and spatial differences, Lokki has stated that timbral characteristics were graded slightly lower than spatial characteristics in comparison to authentic recording [3]. Rindel and Christensen have concluded that the auralization technique would be capable of producing results hardly distinguishable from a real recording [1]. Visual aids, such as photos from the actual concert halls were not used in the subjective evaluation, and the listening positions in the halls were not disclosed to the subjects. This could have influence on the expected clarity and brightness. Studies on the effect of visual stimuli combined to perception of acoustics have been performed e.g. by Hyde [19] and Cabrera et al. [20]. Combining visual and auditory stimuli in a similar test could provide information not only on the quality of auralization but also on generic preference on hall acoustics.
7
29–31 August 2010, Melbourne, Australia
Proceedings of the International Symposium on Room Acoustics, ISRA 2010
Normalized score
Mozart
Mahler
1
1
0.8
0.8
0.6
0.6
0.4
0.4
0.2
0.2 Group 1 Group 2
0
0
omni omni0.0omni0.5 lps lps0.0 lps0.5 Method
real
Group 1 Group 2 omni omni0.0omni0.5
lps lps0.0 lps0.5 Method
real
Figure 8: Mean scores and 95% confidence intervals for the two groups with separated music excerpts. Group 1 preferred natural tone and group 2 preferred brightness. Relative magnitude responses Mahler, Konservatorio P3
15 10 5
Lowest fundamental frequency
20
Loudspeaker frequency response limit
25
(Noise)
Magnitude difference to reference [dB]
30
omni omni0.0 omni0.5 lps lps0.0 lps0.5
0 −5 100
1000 Frequency [Hz]
10k
Figure 9: Difference of magnitude responses in auralization for Mahler in relation to the real hall.
CONCLUSIONS A study comprising of comparisons between authentic halls and auralizations has been presented. The simulations were performed using the same acoustic models as in the actual hall design. The sound source used in the comparisons on objective acoustic parameters and in a subjective evaluation was a setup of 34 loudspeakers on the stage in a shape of an orchestra. Measured source directivities were applied in the simulations. Large deviations were noticed in the objective parameters between the simulations and hall measurements across the source positions on the stage. The subjective evaluation was performed with a listening test with the real hall as a hidden reference. The major evaluation criteria for the preference was established on the instrument balance and frequency response. The subjects could be categorized into two groups according to the preference on the timbre. The first group preferred naturalness whereas the second group preferred a brighter tone. In all cases the auralization was improved by correcting the overall sound level in each point source, i.e. an orchestra instrument. Depending on the preference and the music excerpt, further improvement was gained with filtering in time-frequency domain. At best, the auralizations were considered as good as the real hall.
ACKNOWLEDGMENTS The authors wish to thank Henrik Möller at Akukon Oy for providing the models and for the discussions. The research leading to these results has received funding from the Academy of Finland, project nos. [119092 and 218238] and the European Research Council under the European Community’s Seventh Framework Programme (FP7/2007-2013) / ERC grant agree-
8
ment no. [203636]. J. Pätynen wishes to thank and the Finnish Foundation for Technology Promotion and the Nokia Foundation for funding.
REFERENCES 1 J.H. Rindel and C.L. Christensen. Room acoustic simulation and auralization - how close can we get to the real room? In Proc. Eighth Western Pacific Acoustics Conference, Melbourne, Australia, Apr. 7-9 2003. Keynote Lecture; CD-ROM, 8 pp. 2 T. Lokki and L. Savioja. Evaluation of auralization results. In Forum Acusticum 2005, Budapest, Hungary, Aug. 29 Sep. 2 2005. Paper 471-0. 3 T. Lokki. Physically-based Auralization - Design, Implementation, and Evaluation. PhD thesis, Helsinki University of Technology, Telecommunications Software and Multimedia Laboratory, report TML-A5, 2002. Available at http://lib.hut.fi/Diss/2002/isbn9512261588/. 4 Y. J. Choi and F. R. Fricke. A Comparison of Subjective Assessments of Recorded Music and Computer Simulated Auralizations in Two Auditoria. Acta Acustica united with Acustica, 92(4):604–611, 2006. 5 K. Saher, J.H. Rindel, and L. Nijs. Comparisons between Binaural In-situ Recordings and Auralizations. In 120th Convention of Audio Engeneering Society, Paris, France, May 20-23 2006. Paper no. 6744. 6 M. E. Nilsson and M. Ekman. Perceptual evaluation of a real time auralization tool. In Euronoise 2009, Edinburgh, Ireland, Oct. 26-28 2009. 7 M. Vigeant, L. Wang, and J. H. Rindel. Investigations of orchestra auralizations using the multi-channel multi-source
ISRA 2010
Proceedings of the International Symposium on Room Acoustics, ISRA 2010
8
9
10 11
12
13
14 15
16
17
18
19
20
29–31 August 2010, Melbourne, Australia
auralization technique. Acta Acustica united with Acustica, 94(6):866–882, Dec. 2008. J. Pätynen, S. Tervo, and T. Lokki. A loudspeaker orchestra for concert hall studies. In The Seventh International Conference On Auditorium Acoustics, pages 45–52, Oslo, Norway, October 3-5 2008. Institute of Acoustics. Also published in Acoustics Bulletin 2009, 34(6), pp. 32-37. J. Pätynen and T. Lokki. Directivities of Symphony Orchestra Instruments. Acta Acustica united with Acustica, 96(1): 138–167, 2010. GRAS Type 50VI specifications, 2010. URL: http://www.grasinfo.dk/documents/. J. Pätynen, V. Pulkki, and T. Lokki. Anechoic recording system for symphony orchestra. Acta Acustica united with Acustica, 94(6):856–865, Dec. 2008. AKG CK 62-ULS specifications, 2010. URL: http://www.akg.com/mediendatenbank2/psfile/ datei/50/ULS_Series4055c282bda80.pdf. ISO 3382-1:2009. Acoustics – Measurement of room acoustic parameters – Part 1: Performance spaces. International Standards Organization, 2009. ODEON Room Acoustics Software, 2010. URL: http://www.odeon.dk. T. Lokki. How many point sources is needed to represent strings in auralization? In the International Symposium on Room Acoustics (ISRA’2007), Seville, Spain, Sep. 10-12 2007. Paper P11. T. Lokki and J. Pätynen. Applying anechoic recordings in auralization. In The EAA Symposium on Auralization, Espoo, Finland, Jun. 15-17 2009. J. Merimaa and V. Pulkki. Spatial impulse response rendering I: Analysis and synthesis. J. Audio Eng. Soc., 53(12): 1115–1127, 2005. V. Pulkki and J. Merimaa. Spatial impulse response rendering II: Reproduction of diffuse sound and listening tests. J. Audio Eng. Soc., 54(1):3–20, 2006. J. Hyde. Acoustical intimacy in concert halls: Does visual input affect the aural experience? In Proceedings of the Institute of Acoustics, volume 24, London, England, July 2002. D. Cabrera, A. Nguyen, and Y. Choi. Auditory versus visual spatial impression: a study of two auditoria. In Proc. Tenth Meeting of the Int. Conf on Auditory Display ICAD 04, Sydney, Australia, Jul. 6-9 2004.
ISRA 2010
9