Emotion 2010, Vol. 10, No. 6, 874 – 893
© 2010 American Psychological Association 1528-3542/10/$12.00 DOI: 10.1037/a0020019
Evidence and a Computational Explanation of Cultural Differences in Facial Expression Recognition Matthew N. Dailey
Carrie Joyce
Asian Institute of Technology
University of California, San Diego
Michael J. Lyons
Miyuki Kamachi
Ritsumeikan University
Kogakuin University
Hanae Ishi
Jiro Gyoba
Sendai National College of Technology
Tohoku University
Garrison W. Cottrell
University of California, San Diego Facial expressions are crucial to human social communication, but the extent to which they are innate and universal versus learned and culture dependent is a subject of debate. Two studies explored the effect of culture and learning on facial expression understanding. In Experiment 1, Japanese and U.S. participants interpreted facial expressions of emotion. Each group was better than the other at classifying facial expressions posed by members of the same culture. In Experiment 2, this reciprocal in-group advantage was reproduced by a neurocomputational model trained in either a Japanese cultural context or an American cultural context. The model demonstrates how each of us, interacting with others in a particular cultural context, learns to recognize a culture-specific facial expression dialect. Keywords: facial expressions, cross-cultural emotion recognition, computational modeling
The scientific literature on innate versus culture-specific expression of emotion is large and lively. Over a hundred years ago, Darwin (1872/1998) argued for innate production of facial expressions based on cross-cultural comparisons. Landis (1924), however, found little agreement between participants. Woodworth (1938) and Schlosberg (1952) found structure in the disagreement in interpretation, proposing a low-dimensional similarity space characterizing affective facial expressions. Starting in the 1960s, researchers found more support for facial expressions as innate, universal indicators of particular emotions. Tomkins and colleagues articulated the theory of
basic emotions that could be reliably read from facial expressions (Tomkins, 1962–1963; Tomkins & McCarter, 1964). Ekman and colleagues found cross-cultural consistency in forced choice attribution of emotion to carefully posed expressions in both literate and preliterate cultures (Ekman, 1972; Ekman et al., 1987; Ekman, Sorensen, & Friesen, 1969). Today, researchers disagree on the precise degree to which our interpretation of facial expressions of emotion is universal versus culture-specific (Ekman, 1994, 1999b; Fridlund, 1994; Izard, 1994; Russell, 1994, 1995), but there appears to be consensus that universal factors interact to some extent with culture-specific
Matthew N. Dailey, Computer Science and Information Management, Asian Institute of Technology; Carrie Joyce and Garrison W. Cottrell, Computer Science and Engineering, University of California, San Diego; Michael J. Lyons, College of Image Arts and Sciences, Ritsumeikan University; Miyuki Kamachi, Faculty of Informatics, Kogakuin University; Hanae Ishi, Department of Design and Computer Applications, Sendai National College of Technology; and Jiro Gyoba, Department of Psychology, Tohoku University. This research was supported in part by National Institutes of Mental Health (NIMH) Grant MH57075 to GWC, by National Science Foundation (NSF) Science of Learning Center Grant SBE-0542013 to GWC, by Thailand Research Fund Grant MRG4780209 to MND, by an Advanced Telecommunications Research Institute International (ATR) contract with the Telecommunications Advancement Organization of Japan entitled “Research on Human
Communication,” and a grant by the James S. McDonnell Foundation to the Perceptual Expertise Network, Isabel Gauthier, PI. We are grateful to Paul Ekman for providing us with the Pictures of Facial Affect and JACFEE. We thank Jeffrey Cohn for providing us with the Cohn-Kanade database. We are indebted to Judy Reilly for training the posers in CAFE and FACS-coding their facial expressions. We thank Stephen Lindsay, David Matsumoto, Vicki Bruce, Gary’s Unbelievable Research Unit (GURU), and anonymous reviewers for many helpful comments on previous versions of this article. Nick Butko helped write our stimulus presentation software, and Matthew Michelson helped prepare the CAFE still image stimuli. Correspondence concerning this article should be addressed to Matthew N. Dailey, Computer Science and Information Management, Asian Institute of Technology, P.O. Box 4, Klong Luang, Pathumthani, 12120 Thailand. E-mail:
[email protected] 874
CULTURAL DIFFERENCES IN FACIAL EXPRESSION
875
learning to produce differences between cultures. A number of modern theories (Ekman, 1999a; Russell, 1994; Russell & Bullock, 1986; Scherer, 1992) attempt to account for these universals and culture-specific variations.
bein & Ambady, 2002b, 2003b; Elfenbein, Beaupre´, Le´vesque, & Hess, 2007).
Cultural Differences in Facial Expression Interpretation
Perhaps the most controversial recent attempt to explain cultural variability in facial expression production and interpretation is the encoder-decoder distance hypothesis. Elfenbein and Ambady (2002b) performed a meta-analysis of the data on cross-cultural recognition of emotional expressions across different modalities in studies from 1931–2001. Their main conclusion was that emotions are generally better recognized when posed and judged by members of the same culture. Over 168 studies, participants judging posers from their own culture were an average of 9.3% more accurate than judges from other cultures. This apparent in-group advantage decreased for cultures with more exposure to each other, but was generally unaffected by factors like experimental methodology and the type of emotional stimuli used. There were also two interesting situations in which the patterns were reversed. First, in most of the analyzed studies that included minority ethnic groups within a nation, members of the minority groups tended to have an out-group advantage when observing emotions in majority group members (minorities were more accurate when judging emotions posed by the majority group than vice versa). Also, in a few of the analyzed studies (Biehl et al., 1997; Matsumoto & Assar, 1992; Matsumoto & Ekman, 1988), members of imitated cultures tended to have an out-group advantage when the imitators were from different cultures. For example, Americans tended to be more accurate than Japanese when judging the Japanese posers in the Japanese and Caucasian Facial Expressions of Emotion (JACFEE) data set (Matsumoto & Ekman, 1988), in which both Japanese and Caucasian posers precisely imitate the same prototypical expressions posed according to Facial Action Coding System (FACS) standards defined by Americans. According to Elfenbein and Ambady, display rule and decoding rule theories, which hold that cultural differences in facial expression interpretation arise from differing levels of appropriateness of particular expressions and appraisals in particular situations, cannot by themselves explain the in-group advantage. In a dynamic two-way interaction, matched display and decoding rules could certainly lead to more effective communication. However, in experiments with static emotional stimuli, judges do not have this opportunity. Instead, when a judge is asked to interpret the same expression by posers from different cultures, under display rule and decoding rule accounts, the effect of judge culture should be the same across all poser cultures. The fact that in-group advantages arise even when stimuli are prerecorded independent of the rater’s identity and even in studies with balanced designs, in which raters from two or more cultures each judge stimuli from the other’s culture, indicates that the groups are either processing expressions from different cultures differently or are applying different criteria when judging them. That this apparent affinity between poser and judge seems to be an important factor underlying emotional expression interpretation led Elfenbein and Ambady to postulate that in general, recognition accuracy decreases with physical or cultural distance between the encoder and decoder. Supporting this theory, another study (Elfenbein & Ambady, 2003a) found that cultural distance between poser and encoder was a better predictor of emotion recognition discrepancies than a static view of
The early cross-cultural studies on facial expression recognition focused mainly on the question of universality and the psychophysiological underpinnings of emotion. Few sought to analyze and interpret the cultural differences that came up in those studies. However, a steadily increasing number of studies have focused on the factors underlying cultural differences. These studies either compare the facial expression judgments made by participants from different cultures or attempt to find the relevant dimensions of culture predicting observed cultural differences. Much of the research was framed by Ekman’s “neuro-cultural” theory of emotion (Ekman, 1972), in which universal motor programs for emotional facial expressions might have different elicitors, display rules, and/or consequences because of culture-specific learning. Ekman (1972) and Friesen (1972) proposed display rules as one of the main aspects of emotional facial expression production and interpretation that vary across cultures. An example would be that in some cultures, one should not show displeasure in the workplace. Matsumoto and colleagues have found display rule differences among ethnic groups in the United States (Matsumoto, 1993) and are developing methods to assess individual-level display rule differences (Matsumoto, Yoo, Hirayama, & Petrova, 2005). Along with display rules, researchers have also proposed different decoding rules as a source of cross-cultural variability in facial expression interpretation (Huang, Tang, Helmeste, Shiori, & Someya, 2001; Matsumoto & Ekman, 1989). For example, members of some cultural groups might avoid attributing negative emotions to other people to increase social harmony. Thus far, only limited experimental support for the theory has been found. Another approach to understanding cultural differences in facial expression production and interpretation is to correlate observed differences with dimensions of cultural variability, such as Hofstede’s (1983, 2001) power distance, individualism, masculinity, and uncertainty avoidance, or Matsumoto and colleagues’ status differentiation (Matsumoto et al., 2002). Several studies have found these dimensions diagnostic for explaining differences between broad cultural groups and individuals (Gudykunst & TingToomey, 1988; Matsumoto, 1990; Matsumoto et al., 2002; Matsumoto, Kudoh, & Takeuchi, 1996; Matsumoto, Takeuchi, Andayani, Kouznetsova, & Krupp, 1998; Tanako & Osaka, 1999). One of the confounding factors in studies of emotion across cultures is the effect of language. Matsumoto and Ekman (1989) found no effect of label language in Japanese and American multiscalar intensity ratings, but Matsumoto and Assar (1992) found that bilingual Indian students’ emotion judgments were more accurate with English labels than with corresponding Hindi labels. Other researchers have explored cross-cultural differences in interpretations of cultural artifacts depicting faces (Lyons et al., 2000) and the possibility that, rather than identical motor programs for facial expressions, each culture might develop its own emotional dialect containing variations on a universal theme (Elfen-
Encoder-Decoder Distance
876
DAILEY ET AL.
Hofstede’s dimensions of cultural variability (Hofstede, 1983, 2001). The critical factor could be that judges learn the subtleties of their in-group’s expressive style, or the equivalent of the “other-race effect” observed in face recognition (O’Toole, Deffenbacher, Valentin, & Abdi, 1994), except that the cue for the in-group advantage might be the subtleties of the expressions themselves, rather than race. Matsumoto (2002) criticizes Elfenbein and Ambady’s conclusions on several grounds. First, many of the studies in the metaanalysis used unbalanced stimulus sets, and that makes it difficult to draw any conclusions from the results. An advantage on an unbalanced data set could simply reflect better overall decoding of emotional signals rather than a better understanding of the poser group’s emotional communication. Second, even when the studies had balanced stimulus sets, the stimuli were usually not constructed to have equivalent emotion-signaling properties. If the emotions signaling properties of the two stimulus sets are not equivalent, then the experimenter cannot determine the relative contribution of the poser’s culture and the differences in the signals. In the case of facial expressions of emotion, if a data set contains facial expressions from two cultures but the actual set of muscle movements associated with the emotion categories are different, any differences in interpretation between the two cultures could be the result of different decoding by different cultures, or the result of the differences in the stimuli themselves. Matsumoto therefore recommends normalizing stimuli so that the physical properties of the stimuli related to emotion are exactly equal, and only the cultural identification signal is different. Third, signal clarity was not controlled. Clarity can be affected by the intensity of an emotional expression, by adding noise, or decreasing presentation time. Matsumoto claims that as clarity decreases, accuracy also decreases, so that individual differences, correlated with personality traits, tend to emerge. He concludes that clear stimuli should not be grouped with unclear stimuli when estimating effect sizes. To date, the only cross-cultural stimulus set meeting Matsumoto’s validity criteria is the Japanese and Caucasian Facial Expressions of Emotion (JACFEE), a set of facial expression stimuli including reliably recognized expressions of happiness, sadness, fear, anger, surprise, disgust, and contempt posed by both Japanese and Caucasian models (Matsumoto & Ekman, 1988). The JACFEE contains 56 photographs: eight examples of each of the seven emotion categories portrayed by 56 different posers. The eight examples of each emotional expression were coded using the Facial Action Coding System (FACS; Ekman & Friesen, 1978) to ensure that every expression involved the exact same set of muscle contractions at the same level of intensity. The data set is also balanced so that half of the posers are Caucasian and half Japanese and so that half of the posers are men and half are women. Matsumoto (2002) cites experiments, using JACFEE, in which no in-group advantage was found, as evidence that in-group advantages in other experiments are merely artifacts of flawed experimental methods. Elfenbein and Ambady (2002b), in reply, offer an alternative set of criteria for establishing an in-group advantage. First, evidence for an in-group advantage is strongest when it is found in balanced studies. Second, emotional stimuli should be created inside the cultural context with posers from the culture and preferably with experimenters from the same culture. Third, emotional stimuli should be elicited from the participants rather than instructed or imitated based on “preselected theoretical models.” The authors argue that signal equivalence (Matsumoto’s second criterion for
establishing an in-group advantage) is actually a culture eraser, eliminating any possibility of finding and understanding cultural differences in interpretation of emotional expressions.
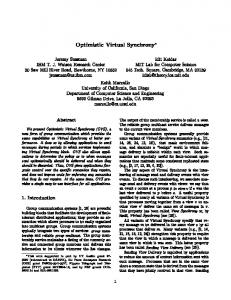
Understanding Cultural Differences Through Computational Modeling We approach the problem of understanding cultural differences both through traditional human studies, in which participants from different cultures are asked to interpret facial expression stimuli for emotional content, and through computational modeling studies, in which hypotheses about the mechanisms underlying observed human behavioral patterns are tested by manipulating a computational model. Consider a situation in which one person seeks to further understand another by observing his or her facial expressions and inferring an underlying emotion. If we assume a set of n discrete, mutually exclusive, and exhaustive emotions C ! !c1, c2, . . . , cn", we can formalize the observer’s task as a Bayesian a posteriori estimation problem: at each point in time t, given an observation (facial image) xt, estimate the posterior probabilities P#ci!xt$, the probability of each category given a face. Using Bayes’ rule, these estimates can be computed based on the product of two quantities, the likelihoods and the priors. The likelihood P# x t!ci$ is the probability of seeing a particular facial expression given the emotion being expressed. This is sometimes called the “appearance model”—a probabilistic description of how each emotional expression is expected to appear. The prior P#ci$ is the probability of a particular emotion being expressed, that is, the frequency of an emotion in a particular cultural context. We assume that our observer learns the likelihood gradually, over the course of a lifetime, but that the priors are more dynamic, with a baseline depending on past experience and modulation according to the current context. Computing the probability of each category given the input this way is called Bayesian inference, which is optimal in the sense that an observer choosing the highest probability category is least likely to make an error in judgment. There is solid evidence linking perception and decision making with Bayes-optimal inference, particularly in psychophysics. Bayesian models have long been used for functional descriptions of perceptual performance (see, e.g., Knill & Richards, 1996, for an overview). More recently, theoretical and experimental work on population coding has provided detailed accounts of how probability distributions can be represented and posterior probability calculations can be performed in the nervous system (Ma, Beck, Latham, & Pouget, 2006). We implement this model through a simple neural network (Figure 1) called EMPATH (Dailey, Cottrell, Padgett, & Adolphs, 2002) that is trained to categorize facial expressions from photographs into the six basic emotions. The network starts with images and processes them in a neutrally plausible way, using a model of the receptive fields of neurons in primary visual cortex, followed by a network that looks for correlations between these neural outputs, forming a more compact representation that encodes facial expression and shape. This is followed by a simple nonlinear perceptron, trained to activate one of six different outputs corresponding to the six basic emotions. If none of the outputs are sufficiently activated (as explained below), then the face is classified as neutral. Through (supervised) training on many examples
877
CULTURAL DIFFERENCES IN FACIAL EXPRESSION
Figure 1.
EMPATH schematic.
pairing facial images with emotion labels, this network changes its connection strengths to produce the correct output for each input. In Bayesian terms, with the correct training rules, the model will directly estimate P#ci!x t$ (Bishop, 1995). That is, the activation level of the six output units will converge on these probabilities. Treating the model as a Bayesian probability estimator leads to clear correspondences in the model for encoder-decoder distance, decoding rules, and display rules. First, we can model encoder-decoder distance by manipulating the level of exposure of the model to the facial expressions of different cultures during training. Because the model’s appearance model P#ci!x t$ depends entirely on the model’s “experience,” that is, what images it is trained upon, if the model is trained primarily on natural Japanese expressions, its classifications will depend on the appearance of the Japanese facial expressions, which in turn are determined to some extent by the cultural variation in Japanese expressions. If the model is then asked to classify prototypical American expressions, it will respond to these based upon its experience, just as we imagine Japanese subjects do. A model trained primarily on Japanese-style facial expressions will have a high distance to American encoders, and vice versa. Because we have complete control over the model’s training environment, we can fit the training environment to the data by varying the percentage of different culture-specific datasets. Second, we can model the way decoding rules within a culture affect facial expression interpretation as modulating the priors one applies in different situations. For example, in a hierarchical culture, it might be very rare for negative emotions to be expressed to a superior, in turn making an observer less likely to interpret a given expression as a negative emotion. This type of influence is straightforward to model as a multiplicative factor on the network’s outputs: Pcult%context#ci !x t$ ! Ptraining#ci!x t$
"
Pcult%context#ci$ Ptraining#ci$
#
(1)
The first factor on the right-hand side of the equation is what the network computes and represents what a person has learned over a lifetime, while the factor in braces, which corresponds to adjustments due to the social situation, can be fit to data. For example, in a situation where a superior is interacting with a subordinate,
this factor could be low for negative expressions from the subordinate and correspondingly higher for the positive categories. We do not attempt to manipulate cultural context during an experiment, so we can make the simplifying assumption that these adjustments are constant over the experiment for participants from a particular culture, leading to an overall cultural bias in interpreting facial expressions in the experiment. Thus, even though the model is simply a network trained to categorize facial expressions, we can use it to model the way decoding rules in a particular culture manifest during an experiment. Third, we can model the effects of display rules within a culture by manipulating the frequency with which the model is exposed to particular categories of facial expressions. For example, in a culture that discourages the display of negative emotions, we might expect that observers would see expressions of those emotions less frequently than expressions of positive emotions and would therefore be less accurate at classifying those expressions. To model this phenomenon, we could decrease the ratio of negative expressions to positive expressions in the model’s training set. The resulting model, after training, would very likely be less accurate at classifying negative expressions than positive expressions. Finally, although we do not pursue it in this article, we can model the effects of language by using multiple, overlapping labels as outputs, based on, for example, a label elicitation study. In this case, the network’s interpretation as a Bayesian classifier is more complex, because of the allowance for multiple, nonmutually exclusive labels (the output activations no longer need to sum to one—rather, each output would correspond to the probability that that particular label could be applied to the input image). This extends the reach of the model, from one limited to the six basic emotions, to one that is more able to capture mixtures of multiple emotions. In any case, we leave this observation for future work, and concentrate here on the six emotions most widely studied in the literature. In this article, we test the validity of EMPATH as a model for human interpretation of facial expressions, and we explore how well the aforementioned manipulations model the effects of culture on facial expression interpretation. To test the validity of the model, we first run an experiment that explicitly tests for in-group advantage, and then we use the data to test the model’s explanation.
Experiments Toward a further understanding of cultural differences in facial expression interpretation, we set out to answer two open questions in the debate on cross-cultural interpretation of facial expressions: • To date, all of the balanced human studies comparing western and east Asian participants’ interpretation of emotional facial expressions have obtained out-group effects, in which westerners are better able to interpret Asian emotional faces than are Asians. Does the lack of in-group effects in western and Asian interpretation of facial expressions falsify the encoder-decoder distance hypothesis for facial expressions? • Thus far, the models that have been proposed to explain cross-cultural differences in facial expression interpretation have been abstract and interpretive rather than computational and predictive. Is it possible to explain cultural differences in facial expression interpretation in terms of a simple neurocomputational model such as that described in Figure 1?
878
DAILEY ET AL.
To answer these questions, we performed two experiments: a human study using a new cross-cultural emotional expression stimulus set, and a computational modeling study exploring the interaction of universal emotional expressions with cultural learning. In Experiment 1, we had participants in Japan and the United States rate the intensity of happiness, sadness, fear, anger, surprise, and disgust in a balanced set of emotional expressions meeting Elfenbein and Ambady’s (2002b) criteria for establishing in-group advantages, for comparison with the results previously obtained by Matsumoto and others using the JACFEE. The data set contains Japanese and Caucasian women posing facial expressions of happiness, sadness, anger, surprise, and disgust. To contrast judges’ interpretations of imitated American expressions versus expressions elicited in the poser’s cultural context, we included both Japanese stimuli from the JACFEE, in which Japanese posers imitated American expressions, and Japanese stimuli that were freely elicited by Japanese experimenters in Japan. The results of the human study exhibit a reciprocal in-group advantage for Japanese and American participants, as predicted by the encoder-decoder distance hypothesis. They thus support the view of the previously discussed signal equivalence requirement as a culture eraser. In Experiment 2, we used the Bayesian model proposed above as embodied by EMPATH (Dailey et al., 2002) to explore possible computational explanations of the results of Experiment 1. We trained multiple EMPATH models to recognize facial expressions in a variety of different cultural contexts, then tested each model on the stimulus set created for Experiment 1. By “different cultural contexts” we mean different sets of facial expression images with different mixes of Japanese and American facial expressions. We found that models trained in a primarily Japanese cultural context best reproduced the Japanese participants’ pattern of responses, and that models trained in a primarily American cultural context best reproduced the American participants’ pattern of responses. These results thus support the hypothesis that our interpretation of facial expressions depends on the interaction of a learning process that slowly tunes our estimates of class-conditional densities and a second process that adapts to the cultural decoding rules via different priors on emotion categories. The model provides a straightforward computational account of cultural differences in emotional expression recognition: they emerge naturally as a consequence of learning to interpret others’ expressions in a specific cultural context.
Experiment 1: Human Interpretation of Facial Expressions In Experiment 1, we collected intensity ratings and forcedchoice emotion classifications on Japanese and Caucasian female facial expressions.
Participants U.S. participants. Fifty students (25 women and 25 men) at the University of California, San Diego, who had not grown up in Asia participated in the study. Their ages ranged from 18 to 26 (mean 20). Eighteen described themselves as East Asian but not Japanese, 17 as Caucasian, 3 as Japanese, 2 as Indian, 2 as Middle Eastern, and 3 as other or mixed. Forty-seven described the culture they grew up in as North American, 2 as Eastern European, and 1 as Middle Eastern. At the end of the experiment, the U.S. participants were given a brief questionnaire aimed at determining their exposure to Asian culture. The distribution of responses was as shown in Table 1. Reflecting the diversity of southern California, the U.S. participants’ responses indicate a moderately high degree of familiarity with Asian culture. Japanese participants. 50 Japanese students (25 women and 25 men) from Tohoku University participated in the study. Their ages ranged from 19 to 27 years (mean & 21.1). All were natives of Japan, and all spoke Japanese as their primary language. These participants answered a demographic questionnaire as shown in Table 2. Overall, these responses indicate a high degree of exposure to westerners via popular culture, but little social interaction. The multicultural diversity of the U.S. sample compared with the relative homogeneity of the Japanese sample might be seen as a confounding factor in the experiment. However, our aim is to compare how members of two different cultures interpret facial expressions. All of the Asian Americans included in the U.S. sample spent their youth in North America. Although they may have assimilated American culture to varying degrees, regardless of their genetic makeup, they share a similar cultural experience with our other U.S. participants, through school, social activity, popular culture, and so on. Furthermore, finding, say, a matched sample of Caucasian judges with little previous direct interaction with Asians would be nearly impossible in southern California,
Table 1 U.S. Participants’ Prior Exposure to Asian Culture in Experiment 1 Question Your primary language How many East Asian movies you see each month How many East Asian families were in your childhood neighborhood How many East Asians are in your current neighborhood Level of fluency in an Asian language Frequency of trips to Asia Amount of time spent living abroad a
Distribution of answers English (33)
Non-English European (2)
Other (5)
East Asian but not Japanese (10)
None (28)
Between 1 and 2 (17)
Between 3 and 5 (2)
6 or more (3)
None (11)
A few (21)
Several (18)
None (0) Not at all (23) Never (38) Never (38)
A few (16) A little (10) One holiday or business trip (5) 1–3 months (5)
Several (34) Quite a bit (10) Several (6) 4–6 months (1)
Fluent (7)a Frequent (1) More than a year (6)
Six participants who selected “East Asian but not Japanese” as their primary language rated their fluency in an Asian language as “Quite a bit” (4) or “A little” (2).
879
CULTURAL DIFFERENCES IN FACIAL EXPRESSION
Table 2 Japanese Participants’ Prior Exposure to Western Culture in Experiment 1 Question Number of western movies you see per month How many western families were in your childhood neighborhood How many western families are in your current neighborhood How well you speak English How often have you traveled overseas How much time have you spent living overseas
Distribution of answers None (12)
1–2 per month (33)
3–5 per month (5)
None (39)
A few (11)
Several (0)
None (37) Not at all (3) Never (36) Never (45)
A few (13) A little (45) One trip (10) 1–3 months (4)
Several (0) Quite a bit (2) A few times (4) 4–6 months (0)
Method Face stimuli. Experiment 1’s intent was to compare U.S. and Japanese responses to emotional facial expressions and test the hypothesis that cultural differences in facial expression interpretation emerge when the expressions are freely elicited in the poser’s own cultural context. For these purposes, we collected facial expression stimuli from the following sources:
2.
JACFEE: Matsumoto and Ekman’s Japanese and Caucasian Facial Expressions of Emotion and Neutral Faces (1988) data set contains 112 photographs. Fifty-six are photos of posers portraying emotional expressions. Each of the 56 posers is a different individual. The remaining 56 photos are of the same 56 individuals portraying a neutral expression. The 56 emotional stimuli include 2 Japanese women, 2 Japanese men, 2 Caucasian women, and 2 Caucasian men for each of the 7 emotions happiness, sadness, fear, anger, surprised, disgust, and contempt. For a given emotional expression, every one of the eight photos has been FACS coded to ensure that they meet Ekman, Friesen, and Hager’s (2002) criteria for prototypical expressions of basic emotions and to ensure that for every image of the same facial expression, every poser is using exactly the same facial actions. Because the JACFEE stimuli were screened for facial expression criteria created by Americans in the United States, we call them “American” expressions regardless of whether the poser is Japanese or Caucasian. The California Facial Expression database (CAFE): CAFE is a data set created at University of California, San Diego.1 CAFE is comprised of posers from southern California portraying happiness, sadness, fear, anger, surprise, and disgust, as well as neutral expressions. CAFE posers were first trained by a FACS expert in a short group session to portray each emotion. Then each poser sat for an individual photo session in which we asked them to portray each emotion in turn. Finally, the expert coded each photograph and screened out the faces not meeting FACS criteria for the emotion in question. Because the CAFE stimuli were screened against the same
Fluent (0) Several (0) More than a year (1)
criteria as the JACFEE stimuli, we also call them “American” expressions. However, note that whereas all JACFEE stimuli for a particular emotion involve exactly the same facial actions, the CAFE posers were allowed to portray an emotion however they pleased, so long as the expression met the FACS expert’s criteria. This means there is more variability across the examples of a particular emotion in CAFE than there is in JACFEE.
and even if it were possible, the group would not be representative of the culture. For these reasons, the only restriction we placed on our ethnically Asian subjects was that they should have grown up in North America.
1.
6 or more (0)
3.
The Japanese Female Facial Expressions (JAFFE) data set: The JAFFE (Lyons, Akamatsu, Kamachi, & Gyoba, 1998) data set contains 217 photos of 10 Japanese female models posing expressions of happiness, sadness, fear, anger, surprise, disgust, and neutrality.2 The expressions were posed without instruction by Japanese participants in Japan, and they were not screened against any standards for emotional facial expressions. We therefore call the JAFFE expressions “Japanese” expressions. Although the JAFFE stimuli are not screened against any emotional expression criteria, note that we did select the specific subset of JAFFE for Experiment 1 according to an intensity criterion described below.
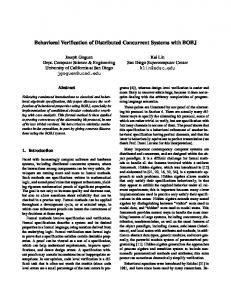
From these three sources, we built the face data set for Experiment 1. The stimuli consisted of 28 Japanese female and 28 Caucasian female posers portraying either a single emotional expression or remaining neutral. The Caucasian posers consisted of the 14 Caucasian women in JACFEE (Matsumoto & Ekman, 1988) and 14 randomly chosen Caucasian women from CAFE. The Japanese stimuli consisted of the 14 Japanese women in JACFEE, the 10 Japanese women in JAFFE portraying sad, afraid, angry, surprised, and disgusted expressions, as well as 4 additional Japanese female posers portraying happy and neutral expressions. The published JAFFE dataset only contains 10 posers, but during the JAFFE photo sessions, Lyons et al. (1998) also acquired photos of 4 additional posers portraying a subset of the expressions. We supplemented the 10 photos selected from JAFFE with neutral and happy expressions from these four posers. We selected the JAFFE stimuli that were rated most intense by Japanese participants in a separate pilot study (not reported here), subject to the constraint that each poser could only appear once in the data set. Figure 2 1 2
See http://www.cse.ucsd.edu/'gary for details on obtaining CAFE. See http://www.kasrl.org/jaffe.html for details on obtaining JAFFE.
880
DAILEY ET AL.
Figure 2. Stimuli for Experiment 1. (a) Images from California Facial Expression database (CAFE). (b) Images are from Japanese Female Facial Expressions (JAFFE). Not shown are 28 images from Japanese and Caucasian Facial Expressions of Emotion (JACFEE), which cannot be reprinted because of copyright restrictions.4
shows the CAFE and JAFFE stimuli used for the experiment (the JACFEE stimuli cannot be reprinted because of copyright restrictions). In anticipation of presenting the same face stimuli to humans and our computational model, we preprocessed all faces according to the requirements of the model. In each face, three points were manually located: the center of the pupil of each eye (the eyes are directed at the camera for all of the stimuli in our dataset) and the midpoint of the bottom of the poser’s top row of teeth. In faces without exposed teeth, the location of this point was estimated.3 Each image was then rotated to make the eyes level, linearly scaled in the horizontal direction so that the eyes were 128 pixels apart, then linearly scaled in the vertical direction so that the mouth and eyes were 136 pixels apart. The resulting image was then cropped to a size of 240 ( 292, with the left eye at row 88, column 56. Finally, the pixel values in each cropped image were then linearly transformed to a mean of 140 and a SD of 40. Procedure. After a brief explanation of the experiment by an experimenter, the 56 stimuli were presented twice, in two blocks. In the first block, participants performed an intensity rating procedure in which the 56 facial expression stimuli were presented individually in random order on a computer screen. The participants were instructed to rate the intensity of happiness, sadness, fear, surprise, anger, and disgust conveyed by each image on a 1–5 scale using the mouse, with 5 being a “very strong display” and 1 being “none at all.” For the Japanese version of the experiment, we used the emotion labels Koufuku, Kanashimi, Osore, Odoroki, Ikari, and Ken’o, respectively.5 The order in which the emotion rating buttons were displayed in the graphical user interface was randomized for each participant but remained constant throughout the experiment. Participants were allowed to examine the face as long as they desired, and once they had rated the intensity of all six emotions, could then press a graphical button to advance to the next face. In the second block, the 56 stimuli were again presented in a different random order, and the participants’ task was a 7-way forced choice decision for each stimulus. The forced-choice block followed the intensity rating procedure to prevent the participants from thinking of the stimuli as portraying one and only one emotion during the intensity rating procedure.
At the end of the experiment, participants answered the questions in the demographic questionnaires as previously described and listed in Tables 1 and 2.
Pilot Study The Experiment 1 stimuli were balanced for poser race, posed expression, and judge culture, but we were concerned about the fact that 75% of the stimuli (the American-style expressions) were selected by a FACS criterion whereas the remaining 25% (the Japanese-style expressions) were selected by an in-group maximum rated intensity criterion. To determine whether this imbalance might bias our participants’ responses, we performed a pilot study in which one group, “Group 1,” (20 U.S. and 20 Japanese participants) rated all 56 of the stimuli in the design just described, and another group, “Group 2” (another 20 U.S. and 20 Japanese participants), rated a 28-stimulus subset of the data. The stimuli for Group 2 were the 14 JACFEE Caucasian stimuli and the 14 JAFFE Japanese stimuli from the full data set. With this change, Group 2’s stimuli were balanced for poser race, posed expression, and judge culture, as well as expression style. Other than the change in the stimulus set for Group 2, the pilot study’s procedure was identical to that previously described for Experiment 1. We subjected the pilot participants’ intensity ratings for the 28 stimuli in common for the two groups to a five-way analysis of variance with the following independent variables: 3
The bottom of the nose is another possible third landmark that is easier to localize, but we find that the top row of teeth gives slightly better results. 4 The JACFEE images not shown are E35, E36, E43, E44, E27, E28, E4, E3, E51, E52, E19, E20, N18, N21, E39, E40, E47, E48, E31, E32, E7, E8, E55, E56, E23, E24, N45, and N53. 5 These are the same labels used by Lyons, Akamatsu, Kamachi, and Gyoba (1998). Although most researchers do not publish the specific labels they use, ours are identical to those of Matsumoto (2005) except that he uses the label Yorokobi (a slightly more transient state of happiness) rather than Koufuku.
881
CULTURAL DIFFERENCES IN FACIAL EXPRESSION
1.
Judge culture (Japanese, American).
2.
Judge group (Group 1 with 56 Stimuli or Group 2 with 28 stimuli).
3.
Dataset (JACFEE vs. JAFFE).
4.
Posed expression (happy, sad, Afraid, Angry, Surprised, Disgusted, neutral).
5.
Rated emotion (happy, sad, Afraid, Angry, Surprised, disgusted).
We predicted no marginal effects or interactions due to the Group variable, and we indeed found no significant effects. We followed up on the null results with an analysis to ensure that the experiment was sufficiently powerful and that the confidence intervals on )2 using Fleishman’s (1980) method included )2 & 0. We concluded that the unbalanced ratio of American-style (FACS-selected) stimuli to Japanese-style (maximum intensity-selected) stimuli in Experiment 1 was unlikely to affect our participants’ responses, and continued with the experiment as described. The 40 Group 1 pilot participants’ data were analyzed with an additional 60 subjects in the Experiment 1 analyses described in the rest of this section.
Matsumoto explains cultural differences in facial expression interpretation in terms of three factors: display rules, decoding ability, and signal clarity. He does not rule out the possibility of in-group advantages in recognition, but suggests that they are unlikely when the emotion signal is clear, as in the JACFEE data set, and that they may be more prevalent when the emotion signal is less clear without being completely ambiguous, when judges “may rely on cues or processes that are idiosyncratic to their cultural group” (Matsumoto, 2002, p. 241). Under Matsumoto’s theory, any evidence of in-group advantage (a poser culture ( judge culture interaction) would be small compared to the main effects of poser culture and judge culture and would be driven by stimuli with relatively weak clarity.
Results Intensity rating results. We subjected the participants’ intensity ratings for the 56 stimuli to a 4-way analysis of variance with rated intensity as the dependent variable and the following predictor variables: 1.
Judge Culture (Japanese, American)
2.
Dataset (JAFFE, JACFEE Japanese, JACFEE Caucasian, CAFE)
3.
Posed Expression (happy, sad, Afraid, Angry, Surprised, Disgusted, neutral)
4.
Rated Emotion (happy, sad, Afraid, Angry, Surprised, disgusted)
Predictions Based on previous studies with JACFEE, we could make some general predictions for the main experiment. In the intensity rating block, we expected a Culture ( Posed ( Rated interaction (Japanese and U.S. participants should attribute different levels of intensity to some of the stimuli), and in the forced-choice rating block, we expected a Culture ( Posed interaction (Japanese and U.S. participants should be more or less accurate on some posed expressions). For the forced-choice block in particular, theories make more specific predictions regarding the effect of the Dataset variable. According to Elfenbein and Ambady’s (2002a, 2002b) concept of in-group advantages, Japanese participants should be more accurate than U.S. participants at judging the expressions of Japanese posers posing Japanese expressions, and similarly, U.S. participants should be more accurate than Japanese participants at judging the expressions of American posers. However, previous balanced cross-cultural studies of Japanese and American interpretations of emotional facial expressions (Biehl et al., 1997; Matsumoto, 1992) have failed to find any such pattern. One explanation lies in these studies’ use of JACFEE. As previously discussed, JACFEE was specifically designed to eliminate any cultural differences in the emotion signal by ensuring that every stimulus for a given emotion category, regardless of poser culture, contains the exact same set of facial actions. Under the criterion of Elfenbein and Ambady, that in-group stimuli should be elicited within the poser’s own culture, the Japanese faces in JACFEE should not be treated as in-group stimuli for the Japanese judges. If a reciprocal in-group advantage does exist for Japanese and U.S. judges, it should manifest when the JAFFE posers (not the JACFEE Japanese posers) are treated as in-group members for Japanese judges.
The results of the analysis of variance (ANOVA) are shown in Table 3. We see immediately that most of the variance in the intensity data is either explained by the Posed ( Rated interaction (55.4%) or attributable to unmodeled factors such as individual judge differences and individual stimulus differences (35.0%). The large effect of the Posed ( Rated interaction comes from the fact that, as expected, for most images, most participants rate the intensity of the posed expression as being higher than the other expressions. The largest effect involving variables other than the posed and rated emotion is the Dataset ( Posed ( Rated interaction (different datasets have different intensity matrices). A visual inspection of the treatment means appeared to indicate that the participants’ rated intensity of the nominal emotion is generally higher for JACFEE than for CAFE or JAFFE. To quantify the support for this hypothesis, we did a separate one-way analysis of variance with the rated intensity of the nominal emotion as a dependent variable and the dataset as a predictor. We found a significant effect (F(3, 4796) & 53.8, p * .001, )2 & .0326). Since this regrouping of the data is a post hoc comparison of linear combinations of cell means in the original analysis, we compared the rated intensities with a Scheffe´ correction (Keppel, 1991) to achieve + FW ! .05 and found the following relative rated intensities: JAFFE " CAFE " JACFEE Japanese ! JACFEE Caucasian That is, for the nominal emotion for each stimulus, our participants attributed more intensity to JACFEE stimuli overall than to
882
DAILEY ET AL.
Table 3 Analysis of Variance on Intensity Ratings in Experiment 1 Source
df
)2
F
p
Culture Dataset Posed Rated Culture ( Dataset Culture ( Posed Culture ( Rated Dataset ( Posed Dataset ( Rated Posed ( Rated Culture ( Dataset ( Posed Culture ( Dataset ( Rated Culture ( Posed ( Rated Dataset ( Posed ( Rated Culture ( Dataset ( Posed ( Rated Error
1 3 6 5 3 6 5 18 15 30 18 15 30 90 90 33264
.0000 .0030 .0408 .0102 .0002 .0008 .0030 .0023 .0029 .5539 .0003 .0010 .0078 .0201 .0066 .3498
0.416 10.094 646.119 193.414 4.951 13.149 56.341 12.273 18.651 1755.963 1.719 6.122 24.685 21.281 7.010 (0.65)
0.5188 *.001 *.001 *.001 0.0019 *.001 *.001 *.001 *.001 *.001 0.0292 *.001 *.001 *.001 *.001
Note.
Values enclosed in parentheses represent mean square errors.
CAFE stimuli, and more intensity to CAFE stimuli than to JAFFE stimuli. There were also significant interactions involving judge culture, though they were small #) 2 " .01$. All of the differences can be summarized by the Culture ( Dataset ( Posed ( Rated interaction. Of the four datasets, our Japanese and U.S. participants differed the most on JAFFE, as measured by the sum of squared differences between the two intensity matrices. First, we compared the two matrices cell-by-cell with 42 F-tests and a family wise Type I error rate + FW ! .05 spread over the 42 comparisons (seven posed expressions ( six rated expressions). We then compared the marginal responses (seven posed expressions , six rated expressions) with 13 F-tests and a family wise Type I error rate + FW ! .05 spread over those 13 comparisons. Finally, we compared the mean intensity for the two judge cultures over all of JAFFE with an F-test and a Type I error rate + ! .05. A summary of these differences is shown in Figure 3. The cells and marginals that were significantly different across cultures are shaded. The Japanese participants attribute more anger to the JAFFE anger stimuli, and they also attribute more disgust to the stimuli overall. However, the American participants attribute more happiness to the JAFFE happy stimuli and more fear to the JAFFE surprise stimuli, and they also attribute more sadness to the stimuli overall. To summarize the main results of the intensity rating block of Experiment 1, we found that • Participants rated the nominal emotion as being less intense in JAFFE than in CAFE, and less intense in CAFE than in JACFEE. • Japanese participants attributed more anger to the angry JAFFE faces and more disgust to the JAFFE faces overall, but U.S. participants attributed more sadness to the JAFFE faces overall, more happiness to the happy JAFFE faces, and more fear to the surprised JAFFE faces. We now turn our attention to the second block of Experiment 1, in which participants made a 7-way forced-choice decision for each stimulus. Forced-choice accuracy results. We coded each decision participants made in the forced-choice rating block as “correct” or “in-
correct” based on the nominal posed expression for the stimulus, then performed a three-way analysis of variance with correctness as the dependent variable and the following predictor variables: 1.
Judge Culture (Japanese, American)
2.
Dataset (JAFFE, JACFEE Japanese, JACFEE Caucasian, CAFE)
3.
Posed Expression (happy, sad, afraid, angry, surprised, disgusted, neutral)
Posed H M F A S D N Mean
H 3.22 1.04 1.01 1.07 1.23 1.02 1.49 1.44
M 1.39 2.96 2.79 1.45 1.03 1.82 1.47 1.84
Rated F A 1.15 1.09 1.62 1.55 3.85 1.37 1.18 3.71 1.59 1.13 1.54 2.32 1.23 1.27 1.74 1.78 Japanese
S 1.16 1.11 3.21 1.01 4.92 1.18 1.11 1.96
D 1.21 2.10 2.84 2.36 1.06 4.01 1.14 2.10
Mean 1.54 1.73 2.51 1.80 1.83 1.98 1.29 1.81
Posed H M F A S D N Mean
H 4.00 1.06 1.03 1.05 1.13 1.04 1.66 1.57
M 1.17 3.49 2.17 2.58 1.12 2.58 1.60 2.10
Rated F A 1.13 1.06 1.82 1.61 4.39 1.30 1.28 2.87 2.84 1.18 1.56 2.63 1.29 1.37 2.04 1.72 American
S 1.64 1.20 3.18 1.09 4.90 1.40 1.17 2.08
D 1.03 1.36 2.37 1.78 1.40 2.91 1.14 1.71
Mean 1.67 1.76 2.41 1.78 2.10 2.02 1.37 1.87
Figure 3. Average intensity matrices for Japanese and American subjects on the Japanese Female Facial Expressions (JAFFE) stimuli used in Experiment 1. Rows correspond to the posed emotion and columns correspond to the rated emotion. Emotion labels H & happy; M & sad; F & afraid; A & angry; S & surprised; and D & disgusted. Significantly different means are shaded in both matrices. Japanese subjects attribute more disgust to the stimuli, and American subjects attribute more sadness and fear to the stimuli.
CULTURAL DIFFERENCES IN FACIAL EXPRESSION
The results of the ANOVA are shown in Table 4. Although most of the variance in accuracy is unexplained by the model, we do observe several statistically significant effects. The effects can be best understood by closely examining the Culture ( Dataset ( Posed interaction. We performed a post hoc analysis using the Tukey correction for all pairwise comparisons (Keppel, 1991) to maintain a family wise Type I error rate of + FW ! .05. Figure 4 shows the Culture ( Dataset ( Posed interaction in detail. The confidence intervals are for the cell means and include the between-subjects variance (Loftus, 2002). The interaction can be further understood through separate consideration of the marginal Culture ( Dataset and Culture ( Posed interactions. For both interactions, we again used Tukey’s correction for all pairwise comparisons. The U.S. participants’ levels of accuracy for each data set were related as follows: JAFFE " CAFE " Japanese JACFEE ! Caucasian JACFEE For the Japanese participants, the accuracy levels were slightly different:
! JACFEE Caucasian The U.S. participants’ level of accuracy for each nominal emotion category was related as follows: A " S
The pattern was again different for the Japanese participants: F " D " A " M ! N " S ! H The Japanese participants were more accurate on the surprise stimuli, whereas the U.S. participants were more accurate on anger, sadness, and fear. Qualitatively, examination of the results shown in Figure 4 indicates that our Japanese participants’ responses to the JACFEE Japanese stimuli are much more similar to their responses to the CAFE and JACFEE Caucasian stimuli than to their responses to the JAFFE stimuli. As previously discussed, this might mean that our Japanese participants regard the JAFFE posers as in-group members but the Japanese JACFEE posers as out-group members. To address this issue quantitatively, we regrouped the stimuli into Table 4 Analysis of Variance on Accuracy of Forced Choice Responses in Experiment 1 Source Culture Dataset Posed Culture Culture Dataset Culture Error
( ( ( (
Dataset Posed Posed Dataset ( Posed
an “American” style expression group containing the FACSselected CAFE, Caucasian JACFEE, and Japanese JACFEE stimuli, and a “Japanese” style expression group containing only the JAFFE stimuli. To determine if the U.S. participants had an overall advantage for the American expressions and the Japanese participants had an overall advantage for the Japanese expressions, we performed a 2-way analysis of variance with the dependent measure being correctness and the predictors being (a) judge culture and (b) expression style (American or Japanese). The results of the ANOVA are shown in Table 5. The Culture ( Expression Style interaction is a small but significant effect, shown in detail in Figure 5a. The confidence intervals are for the cell means and include the between-subjects variance (Loftus, 2002). Because the regrouping and reanalysis is a post hoc comparison of linear combinations of cell means in the original design, we applied the Scheffe´ correction for all possible linear contrasts (Keppel, 1991). We found that the Japanese participants were more accurate than the U.S. participants on JAFFE, and the U.S. participants were more accurate than the Japanese participants on the FACS-selected stimuli.
Discussion
CAFE " JAFFE " JACFEE Japanese
D " F ! A ! N ! M ! S " H,
883
df
)2
F
p
1 3 6 3 6 18 18 5544
.0054 .0124 .1034 .0086 .0147 .0451 .0347 .7758
38.73 29.44 123.10 20.58 17.47 17.92 13.77 (0.13)
*.001 *.001 *.001 *.001 *.001 *.001 *.001
Note. Values enclosed in parentheses represent mean square errors.
We consider each of the main findings of our Experiment 1 analysis in turn. We first found that the JAFFE stimuli were rated as less intense overall than the CAFE stimuli, and the CAFE stimuli were rated as less intense overall than the JACFEE stimuli. In Matsumoto’s terms, this means that the JAFFE and CAFE stimuli have less signal clarity than the JACFEE stimuli, so we should expect to see more evidence of cultural differences on the JAFFE and CAFE stimuli. Indeed, the differences between Japanese and American intensity ratings were largest for JAFFE. In most cases, the U.S. participants attributed more intensity to the JAFFE faces than did the Japanese participants. This is not surprising in light of previous findings (Ekman et al., 1987; Matsumoto & Ekman, 1989) that Americans attribute more intensity to emotional faces than Asians do. Ekman et al. (1987) found that participants from Japan, Hong Kong, and Indonesia tended to attribute less intensity to happiness, surprise, and fear in Caucasian faces than did Westerners. Matsumoto and Ekman (1989) similarly found that Americans tended to attribute more intensity to JACFEE faces than did Japanese participants, regardless of whether the face in question was Asian or Caucasian. More surprising in the current experiment is that the Japanese participants attributed more anger to the angry JAFFE faces and more disgust to the JAFFE faces overall. We attribute this to the fact that, in contrast to previous studies, we have Japanese judges rating Japanese-style expressions. We reject the hypothesis that Japanese participants, because of decoding rules or other influences, are simply less likely to attribute intense emotion to others. The Japanese participants may be picking up on subtle culturespecific signals in the data. In the forced-choice block of Experiment 1, as shown in Figure 5a, we found reciprocal in-group advantages for Japanese participants judging Japanese-style expressions and U.S. participants judging American-style expressions. This study is the first to demonstrate an in-group advantage for Japanese over Western
884
DAILEY ET AL.
1.0
Mean Accuracy
0.8
0.6
Japanese raters US raters 0.4
0.2
0.0
C J J A C C J F
H
C J J A C C J F
M
C J J A C C J F
F
C J J A C C J F
A
C J J A C C J F
S
C J J A C C J F
D
C J J A C C J F
N
Figure 4. Culture ( Dataset ( Posed interaction in Experiment 1. Dataset labels CC & CAFE (Caucasians); JC & Japanese and Caucasian Facial Expressions of Emotion (JACFEE; Caucasians); JJ & JACFEE (Japanese); AF & Japanese Female Facial Expressions (JAFFE; Japanese). Error bars denote 95% confidence intervals.
participants using facial photograph stimuli. Crucially, the grouping of posers was cultural, not racial. Consistent with Elfenbein and Ambady’s (2002b) criteria for establishing in-group advantages, the advantage was observed when, in the analysis, we treated the Japanese posers in JAFFE as in-group members for the Japanese judges and the Japanese posers in JACFEE as in-group members for the U.S. judges. For comparison, consider Figure 5b, in which we perform the same type of analysis, but group the stimuli by poser race rather than poser culture. When we combine the expressions of the Japanese posers in JACFEE with the JAFFE expressions, the Japanese participants’ advantage disappears. The JAFFE stimuli were freely elicited in a Japanese cultural context, whereas the JACFEE expressions were posed in an American cultural context. At the same time, consistent with Matsumoto’s (2002) suggestions about signal clarity and accuracy, we found that the JAFFE stimuli were rated less intense overall and that participants’ accuracy was lower on JAFFE than on JACFEE. However, the lower intensity of the JAFFE stimuli only resulted in lowered accuracy for the U.S. judges, not the Japanese judges. The Japanese judges were just as accurate on the JAFFE stimuli as on the CAFE and JACFEE stimuli (Figure 5a). Past studies using the Japanese JACFEE faces as in-group stimuli for Japanese participants have failed to find in-group advantages and have been used to argue against a direct role for cultural learning in the interpretation of facial expressions (Matsumoto, 2002). In contrast, our results demonstrate that the Table 5 Analysis of Variance of in-Group Advantages in Experiment 1 Source
df
)2
F
Culture Expression style Culture ( Expression style Error
1 1 1 5596
.0000 .0040 .0075 .9831
2.36 22.68 42.85 (0.1653)
p .1244 0 0
Note. Values enclosed in parentheses represent mean square errors.
requirement for posers from different cultures to portray the exact same set of facial muscle movements is, as Elfenbein and Ambady (2002a) put it, a “culture eraser.” A closer examination of the Culture ( Dataset ( Posed interaction in Figure 4 shows that the in-group advantage for the Japanese participants is driven by their improved accuracy over U.S. participants on the JAFFE anger and disgust stimuli. Indeed, the four JAFFE stimuli for which the Japanese advantage was greatest were the four anger and disgust stimuli. Two of these stimuli are shown in Figure 6. The facial movement in these faces is clearly less intense than in the Japanese JACFEE faces, yet they nevertheless send a clear signal to a majority of the Japanese participants. In the case of the JAFFE fear stimuli, however, the pattern is actually reversed—U.S. participants were more accurate than Japanese participants on the JAFFE fear stimuli. This is consistent with many studies finding reduced agreement among nonWesterners on fear stimuli. For example, Ekman and Friesen’s (1971) study with the Fore of New Guinea found that participants, when told a particular story about someone feeling fearful then asked to select the photograph consistent with the story, selected a surprise photo 67% of the time. In another study asking Japanese and American participants to rate emotional intensity in the JACFEE faces (Matsumoto & Ekman, 1989), 50% of Japanese participants rated surprise most intense in the JACFEE fear faces. In our own data, 68% of the Japanese participants rated the intensity of surprise as equal to or greater than that of fear in the JACFEE fear faces. Similar results have been found in other studies, especially with JACFEE (Matsumoto, 1992; Russell, Suzuki, & Ishida, 1993; Shioiri, Someya, Helmeste, & Tang, 1999). In the case of JAFFE, the models reported difficulty producing fear expressions, and some of the resulting faces are barely distinguishable from neutral. Nevertheless, on the set of JAFEE fearful faces selected for the current experiment, U.S. participants were more accurate than they were on other negative JAFFE expressions, and
885
CULTURAL DIFFERENCES IN FACIAL EXPRESSION
*
0.8 0.6 0.4 0.2 0.0
b
Japanese American Expressions Expressions
*
1.0
1.0
0.8 0.6 0.4 0.2 0.0
Japanese Posers
Japanese model American model
c Mean Accuracy
*
Mean Accuracy
Mean Accuracy
a 1.0
Japanese raters US raters
Caucasian Posers
*
*
0.8 0.6 0.4 0.2 0.0
Japanese American Expressions Expressions
Figure 5. In-group advantages in Experiments 1 and 2. Error bars represent 95% confidence intervals. Significantly different with Scheffe´ correction and +FW & .05. (a) Culture ( Expression Style interaction in Experiment 1. Japanese participants exhibit an in-group advantage on Japanese expressions, and U.S. participants exhibit an in-group advantage on American expressions. (b) The reciprocal in-group advantage is not found in an equivalent analysis by poser race. Japanese and U.S. participants are equally accurate on expressions of Japanese posers; U.S. participants exhibit an advantage over Japanese participants on expressions of Caucasian posers. (c) Culture ( Expression style interaction in Experiment 2. Model participants exhibit the same reciprocal in-group advantages shown in (a).
they were more accurate than Japanese participants. This consistent difficulty producing and recognizing fearful faces but not angry or disgusted faces may be partly explained by the fact that Japanese people report feeling less fear of strangers than Americans or Europeans (Scherer, Matsumoto, Wallbott, & Kudoh, 1988) and by Japan’s status-differentiating culture (Matsumoto et al., 2002) in which it might be appropriate to display negative emotions such as anger and disgust but not fear toward lowerstatus others. Putting the intensity rating and forced choice data together, it is interesting to note that as rated intensity on the nominal emotion increases, so does accuracy— both the Japanese and Caucasian faces in JACFEE were rated more intense than the CAFE and
Figure 6. Images for which Japanese and American accuracy differed the most in Experiment 1. (a) A Japanese Female Facial Expressions (JAFFE) angry face. The mean anger intensity rating was 2.97 compared with 3.62 for angry faces overall. 82% of Japanese participants and 34% of American participants correctly classified the face as “angry.” (b) A JAFFE disgusted face. The mean disgust intensity was 3.07 compared with 3.86 for disgusted faces overall. 66% of Japanese participants and 18% of American participants correctly classified the face as “disgusted.”
JAFFE faces on the nominal emotion, and both Japanese and U.S. participants were more accurate at classifying the JACFEE stimuli than the CAFE or JAFFE stimuli. In terms of our computational model (Figure 1), this may mean that the JACFEE stimuli represent exemplars near peaks of the class-conditional likelihoods P# x t!ci$. On this view, the peaks of the distributions would be relatively stable across cultures, whereas stimuli in regions far from the peaks would be rated less intense and lead to lower accuracy but would also allow for culture-specific variations on the larger theme. Because JAFFE was acquired through free elicitation of emotional facial expressions from Japanese posers in a Japanese cultural context, it is very likely to include such culture-specific variations in facial expression style, if they exist. This could explain the higher intensities that our Japanese participants attribute to the JAFFE anger stimuli, and it could also explain the reciprocal in-group advantage we obtain when we treat the JAFFE stimuli as in-group data for the Japanese participants and the JACFEE stimuli as in-group data for the U.S. participants, regardless of poser race. The results of Experiment 1 thus suggest a strong role for learning facial expression styles within cultures. In Experiment 2, we use a computational model to explain the cultural differences observed in Experiment 1. We find that the participants’ pattern of responses can be explained as a consequence of learning to interpret others’ expressions in a specific cultural context, represented in the model first as a particular mix of facial expressions and expression styles during learning, and second as differing response biases being applied during interpretation.
Experiment 2: Modeling Interpretation of Facial Expressions In Experiment 1, we found several differences in the way Japanese and U.S. participants interpret emotional facial expressions. It is difficult, however, to determine the causes of these differences, because so many interacting factors contribute to the
886
DAILEY ET AL.
participants’ responses. In Experiment 2, we apply EMPATH (Dailey et al., 2002) toward a better understanding of the results of Experiment 1. With EMPATH, unlike our human participants, all of the factors contributing to a response are under our control and can be manipulated independently. To the extent that experimental manipulations produce patterns similar to the human data, we can infer analogous influences underlying human performance. We do not manipulate all of the possible factors underlying our participants’ facial expression interpretations. We focus instead on factors that model the influence of culture-specific display rules, encoder-decoder distance, and culture-specific decoding rules: • To model culture-specific display rules, we manipulate judges’ previous experience with different categories of facial expressions. • To model the effects of encoder-decoder distance, we manipulate judges’ previous experience with different styles of facial expressions. • To model the effects of culture-specific decoding rules, we manipulate judges’ response biases for particular emotion categories. We assume that a judge’s previous experience affects his or her sensitivity in detecting a particular emotional signal, and that different groups of judges may bring different response biases with them into the experiment, reflecting their expectations about the prevalence of emotions in the world and in the experimental context. EMPATH is just a pattern classifier trained on a set of images containing facial expressions then tested on a different set of images containing posers never seen during training. By training, we mean that the model is presented with a face as input (which corresponds to presenting the face as a pattern of activation across a set of input units, like pixels in a camera), and attempts to classify that face into one of six categories by activating output nodes corresponding to the six categories. The output units are activated by weighted connections between the input and the output. If the model activates the wrong output, say “Happy,” when the face is in fact “Sad,” then the training algorithm adjusts the connection strengths between the inputs and the outputs in order to reduce the error in the output. So, in the example given, it would lower the connection strengths to the “Happy” output (the ones that led to it being incorrectly activated), and raise the connection strengths to the “Sad” output from the input stimulus. In this way, the model learns over many presentations to differentiate the facial expressions from one another. The detailed procedure is given in the Methods section. To model two groups of participants’ differing previous experience with facial expressions, we can simply build two different classifiers with different training sets. To model a participant group’s response biases, we can first train our system with uniform priors over the categories and stimuli, then reweight its outputs according to different priors over the categories in order to improve the fit to the data. The model can then respond as if it assumes, say, that happiness is twice as likely as sadness in the world. Based on the results of Experiment 1, especially the reciprocal in-group advantage shown in Figure 5a, we hypothesize that more training on Japanese-style expressions might produce a model that behaves more like a Japanese participant on the test stimuli, and
that more training on American-style expressions might produce a model that behaves more like a U.S. participant. In the following sections, we describe our model, experimental methods, and modeling results, followed by a discussion of their implications for the human data.
Method The model. EMPATH is shown schematically in Figure 1. It has been described in detail elsewhere (Dailey et al., 2002)6; here we describe it briefly. At the input level, stimuli are represented as cropped, aligned, grayscale images. At the next level, the perceptual level, we filter the image with a rigid grid of overlapping 2D Gabor filters (Daugman, 1985) in quadrature pairs at five scales and eight orientations. A Gabor filter is simply an oriented sinusoidal grating modulated by a Gaussian envelope. They act as edge detectors and have been shown to accurately model the receptive fields of simple cells in primary visual cortex (Jones & Palmer, 1987). When we combine paired sine-shaped and cosine-shaped filters at each location, scale, and orientation, we obtain a so-called Gabor magnitude representation that is often used as a simplifying model of the spatial responses of complex cells in the early visual system (Lades et al., 1993). At the next level, the gestalt level, the high-dimensional Gabor representation is reduced to a lowerdimensional representation via principal components analysis (PCA), a commonly used optimal linear compression technique (see, e.g., Kirby & Sirovich, 1990; Turk & Pentland, 1991). At the final level, the category level, the input is classified into one of six categories corresponding to the six “basic” emotions originally portrayed in Ekman and Friesen’s (1976) Pictures of Facial Affect (POFA). The categorization is accomplished by a simple statistical model known as a generalized linear model in statistics or a perceptron in neural networks. The system is trained by error correction to predict the posterior probabilities P#ci!x j$, where the ci are the categories happy, sad, afraid, angry, surprised, and disgusted, and xj is the gestalt-level representation of input stimulus j. In previous research we have found this model to provide straightforward explanations of participant behavior in experiments on facial expression perception and recognition. Face stimuli. In addition to the 56 test stimuli used in Experiment 1, we assembled a large collection of training images from several sources:
6
1.
JAFFE: we used all 217 images of the 10 Japanese female posers in JAFFE for training EMPATH. Ten of these stimuli had also been used to test human participants in Experiment 1, but we ensured that no classifiers were both trained and tested on the same individuals (see the “Training procedure” section below for training and testing details).
2.
CAFE: During video sessions, according to the FACS expert trainer, 11 of 60 posers (5 female, 6 male) met FACS criteria for all 6 emotional expressions. Seventyseven images of these 11 posers were selected for training EMPATH. Two of these 11 posers’ faces were also
The system is also similar to one proposed by Lyons, Budynek, and Akamatsu (1999).
CULTURAL DIFFERENCES IN FACIAL EXPRESSION
used with the human participants in Experiment 1, but as with JAFFE, we again ensured that no classifiers were both trained and tested on these individuals. The 11 posers included 7 Caucasians, 2 east Asians (one of Korean descent and one of Chinese descent), and 2 of unknown descent (most likely from the Pacific region). 3.
JACFEE: We used all 48 happy, sad, afraid, angry, surprised, and disgusted stimuli as well as the 56 neutral stimuli from JACFEE/JACNeuF (Matsumoto & Ekman, 1988). (Only the 8 JACFEE stimuli portraying contempt were left out.) The posers included 28 different Japanese and 28 different Caucasian individuals, half female and half male. The 28 female posers in JACFEE were also used with the human participants in Experiment 1, but we again ensured that no classifiers were both trained and tested on the same individuals.
4.
Cohn-Kanade: Because the JAFFE, CAFE, and JACFEE data sets are relatively small, to improve the robustness and accuracy of the trained EMPATH classifiers, we selected an additional set of 48 examples of Caucasians portraying happy, sad, afraid, angry, surprised, and disgusted expressions from the publicly released version of the Cohn-Kanade database (Kanade, Cohn, & Tian, 2000). This database consists of 97 posers performing various combinations of facial action units in 481 video sequences of varying length beginning from a neutral expression. We selected stills from the endpoints of 48 sequences. Because not all of the sequences in the database portray facial actions meeting FACS criteria for the emotional facial expressions, and few of the posers portray all 6 basic emotional expressions, our 48-image subset of the Cohn-Kanade database contains 19 unique actors.
Each stimulus was coded according to three variables: • Racial group: “Japanese” in the case of JACFEE Japanese and JAFFE, or “non-Japanese” in the case of CAFE, JACFEE Caucasian, and Cohn-Kanade; • Expression style: “American” in the case of CAFE, JACFEE, and Cohn-Kanade, or “Japanese” in the case of JAFFE; • Posed emotion: Happy, sad, afraid, angry, surprised, disgusted, or neutral. Stimulus normalization. To create a consistent dataset for EMPATH to learn from, we rotated, scaled, and cropped all 462 JAFFE, CAFE, JACFEE, and Cohn-Kanade training and testing images as already described for Experiment 1. One additional preprocessing step was necessary due to the variability in lighting conditions and backgrounds across the four databases. Statistical learning methods have difficulty generalizing to examples from a distribution that is systematically different from the training distribution. Lighting differences are an example of this, so we attempted to ensure that the face sets had similar pixel distributions in the face region with a simple histogram equalization technique. For each image, we masked off the face outline, including the hairline, and computed the cumulative distribution of the pixel values within the unmasked face interior. From these distributions we computed the average distribution over all the faces then
887
mapped each face’s interior pixel values to the mean distribution. In other (unpublished) work, we have found this technique to be useful when a classifier is trained on one database and expected to generalize to other databases. EMPATH training. Our first task was to produce a version of EMPATH able to classify the 56-stimulus test set for Experiment 1 with a high level of accuracy, so that we would then have some freedom to manipulate the parameters to better fit the Japanese and American human data. However, we should not train the classifier on the same data that was shown to participants in Experiment 1. Because the raters had never seen the faces before, their task was to generalize their prior knowledge of facial expressions to a new set of faces. To accurately model the experiment, then, our classifiers should similarly not be tested on the same data they are trained on. But if we were to exclude all 56 test individuals from the classifier’s training set, there would not be enough stimuli left to achieve good classification accuracy. To solve this problem, we partitioned the 56stimulus test set into 14 sets, each containing 4 of the Experiment 1 stimuli: 1 from JAFFE, 1 from CAFE, 1 Japanese face from JACFEE, and 1 Caucasian face from JACFEE. We further constrained each partition to contain no more than one example of each emotional expression, but otherwise, the partitions were chosen arbitrarily. For each of the 14 partitions of the test set, we trained 10 different classifiers with different random training sets, for a total of 140 classifiers. The training set for each classifier was chosen at random, subject to the constraint that none of the four individuals in the classifier’s test set could be used during training. Because for a given classifier, only four posers were removed from the pool of possible training stimuli, each classifier could be trained on a large number of stimuli without contaminating the test. This technique, called cross-validation, is a common way to test machine learning algorithms when training data is limited. After the training and test set for a particular EMPATH classifier is selected, we further reserve some of the training data as a hold out set. This is because iterative learning methods such as gradient descent tend to overlearn the training set; using a hold out set to determine when to stop training prevents this. We select a different random hold out set for every classifier. For our baseline EMPATH model, we used the following breakdown for the training and hold out sets: • Hold out set: 1 random individual (7 expressions each) from CAFE, 1 random individual (7 expressions each) from JAFFE, and 7 random stimuli (7 different expressions) from JACFEE, for a total of 21 stimuli. • Training set: 8 random individuals (7 expressions each) from CAFE, 8 random individuals (7 expressions each) from JAFFE, 42 random stimuli (6 examples of each of 7 expressions) from JACFEE, and all 48 Cohn-Kanade stimuli, for a total of 202 stimuli. Once the test set, hold out set, and training set are fixed for a particular EMPATH classifier, processing can begin as shown in Figure 1. Each input-level (image) pattern is processed to obtain a high-dimensional perceptual-level representation, the previously described Gabor magnitude representation of the image. Each element of the 40,600 perceptual-level pattern is z-scored to a mean of 0 and a variance of 1 over the entire data set so that each element has an equal opportunity to contribute. We then compute
888
DAILEY ET AL.
the principal component eigenvectors of the training set and determine k, the number of eigenvectors required to account for 85% of the training data’s variance (typically, k is approximately 120). We then project all of the perceptual-level data (training set, hold out set, and test set) onto the subspace spanned by the top k principal component eigenvectors then z-score the projections, again using the means and variances calculated over the training set. These k-dimensional projections are EMPATH’s gestalt-level representations of the training, hold out, and test images. Finally, a standard single layer, six-output, feed-forward neural network is trained to minimize error on the training set until accuracy on the hold out set is maximized. We use stochastic gradient descent and the cross-entropy error criterion (Bishop, 1995). After each neural network is trained, we save its weights and test its generalization to its test set. That is, for each test set item x j, we obtain predictions P#ci!x j$, with c1 & H (happy), c2 & M (sad), c3 & F(afraid), c4 & A (angry), c5 & S (surprised), and c6 & N (neutral). EMPATH does not explicitly represent neutral faces with a separate category; rather, neutrality is assumed to be an absence of any emotional expression. To accomplish this, the training target for an emotional face is a binary vector, for example -0
0
1
0
0
0.
for a Fearful Face, and the Training Target for Neutral Faces Is the Uniform Vector
$
1 6
1 6
1 6
1 6
1 6
1 6
%
The final output of the training procedure is a 560 ( 6 matrix of classifier responses, because there are 56 test stimuli and 10 classifiers tested on each test stimulus. The use of binary targets is suboptimal in the sense that some faces are more representative of a given emotion than others. Better agreement with the human data could in principle be obtained by training the model on human responses. In that case, though, we would be “building in” the biases of one particular group of participants. Binary targets avoid that issue, so that any emergent agreement between network and human responses can be attributed to perceptual properties of the stimuli rather than the way the networks were trained. Prior experience manipulation. Based on previous experiments with EMPATH, we expected the baseline model just described to perform fairly well at classifying the test stimuli from Experiment 1. However, the particular mix of facial expression categories, poser races, and expression styles we chose was to an extent arbitrary, reflecting the availability of data more so than any prior theories about the composition of our human participants’ “training sets.” Given the results of Experiment 1, we hypothesized that the Japanese participants had more prior exposure to expressions like those in JAFFE, that U.S. participants had more prior exposure to expressions like those in JACFEE and CAFE, and that the two participant groups had different prior exposure to some facial expression categories. To determine the extent to which these kinds of factors might produce model “participants” more like our Japanese or U.S. human participants, we performed separate experiments with different mixtures of expressions, poser races, and expression styles. Recall that we model the effects of display rules by modulating EMPATH’s exposure to different categories of emotions and that
we model cultural distance by modulating EMPATH’s exposure to different styles of expressions. We also added exposure to different races as an additional variable to see if it had an effect. The baseline model was trained on most of the data available to us without repeating any * poser, emotion / pairs in any of the training sets, so all of our manipulations took the form of subsampling one or more categories of stimuli during model training. We defined the following parameter space to model participants’ differing prior experience: • Exposure to happy faces: eH 0 !.5, .75, 1.0" • Exposure to sad faces: eM 0 !.5, .75, 1.0" • Exposure to afraid faces: eF 0 !.5, .75, 1.0" • Exposure to angry faces: eA 0 !.5, .75, 1.0" • Exposure to surprised faces: eS 0 !.5, .75, 1.0" • Exposure to disgusted faces: eD 0 !.5, .75, 1.0" • Exposure to Japanese faces (JACFEE Japanese, JAFFE): eJR 0 !.5, .6, .7, .8, .9, 1.0" • Exposure to non-Japanese faces (JACFEE Caucasian, CAFE, Cohn-Kanade): eNJ 0 !.5, .6, .7, .8, .9, 1.0" • Exposure to American-style expressions (JACFEE, CAFE, Cohn-Kanade): eAS 0 !.5, .6, .7, .8, .9, 1.0" • Exposure to Japanese-style expressions (JAFFE): eJS 0 !.5, .6, .7, .8, .9, 1.0" These 10 parameters allow for 944,784 possible mixtures of training set patterns. An exposure level of 1.0 means all of the patterns in a category for the baseline model are retained in the manipulated training set. An exposure level ec " 1.0 * 1.0 for category c means when a pattern is selected for inclusion in a classifier’s training set, if it is in category c, we only use the pattern with probability ec. For example, if eJS ! .5, each classifier will be trained on an average of 28 JAFFE faces rather than 56. Response bias and neutral threshold manipulation. Recall that we model decoding rules by modulating EMPATH’s response bias for each emotion. Response bias is a shift in the criterion one uses to make a decision. To model this shift mathematically, we assume it reflects a change in one’s estimate of the prior probability P#ci$ of seeing a given emotion category ci. A participant’s actual response will of course also depend on the visual stimulus. We assume participants’ intensity and forced-choice responses are functions of their estimates of P#ci!x j$, the posterior probability of emotion class ci given a stimulus x j. The posterior and prior are related by Bayes’ rule: given stimulus x j, the posterior probability of emotion ci is P#ci!x j$ !
P# x j!ci$P#ci$ P# x j$
(2)
where P# x j!ci$ is the class-conditional probability of the stimulus and P#ci$ and P# x j$ are priors for emotion i and stimulus j. Our classifiers estimate P#ci!x j$ directly under the assumption of training priors Pold#ci$. These priors are uniform for our baseline model, but they differ from the uniform distribution whenever some of the emotion exposure parameters ec introduced in the previous section are less than 1. In either case, to obtain an estimate P#ci!x j$ under different priors, we simply normalize each of the classifier’s outPnew#ci$ old puts by a factor bi ! #ci$. As will be explained below, P we fit the parameters bi directly to the human data using least squares.
CULTURAL DIFFERENCES IN FACIAL EXPRESSION
Because Experiment 1 included a forced-choice decision including a seventh category choice (neutral), we needed to model participants’ seven-way forced choice decisions based on six posterior category probability estimates. The simplest way to accomplish this is with a winner-takes-all model, in which we assume participants calculate P#ci!x j$ based on some set of priors then find the category c* with the highest posterior probability c* !
argmax biP#ci!x j$ ci
(3)
Then, we assume participants apply the decision rule
"
c* Category# x j$ ! Neutral
if bc * P#c* !x j$ # 1 N, otherwise
(4)
The threshold 1 N is a free parameter. If the estimated probability of the most probable class, say “surprise,” is greater than 1 N, we respond with the emotional category “surprise,” but otherwise, the estimated probability of the surprise category is too small, and we respond with the “neutral” category decision. Winner-takes-all is a straightforward way to model an individual participant’s forced choice responses. But in fact, we want to model the entire population’s decisions, not just a single participant’s, so instead of winner-takes-all, we form the vector
& '
bHP#H⎪x j$ bMP#M⎪x j$ bFP#F⎪x j$ -Vi#x j$. 7(1 ! bAP#A⎪x j$ bSP#S⎪x j$ bDP#D⎪x j$ 1N
(5)
representing the value of each possible decision, then apply the multinomial logit choice model P#ci⎪x j$ !
e2Vi#x j$
(
k
e2Vk#x j$
(6)
for the entire population’s seven-way forced choice behavior. Altogether, with six response bias factors bH, . . . , bD, the neutral threshold 1 N, and the logit gain parameter 2, we have a total of eight parameters that must be fitted to the human data. However, there are only seven intrinsic parameters, since the final vector of decision probabilities is constrained to sum to 1.
Results Baseline model. We first trained the baseline model consisting of 140 classifiers using most of the available training data, as previously described. We found that k, the number of gestalt-level dimensions accounting for 85% of the variance at the perceptual level, was approximately 120, though k varied somewhat for different random training sets. The ensemble’s winner-takes-all test set accuracy on the 48 emotional stimuli from Experiment 1 was 88.3%. With a neutral threshold 1 N ! .33, the ensemble’s winner-take-all accuracy in the 7-way decision over all 56 stimuli was 82.7%. In principle, it would be possible to estimate the neutral threshold automatically using hold out data, but we did not do so, since we planned to fit the threshold directly to the human data later. The model’s forced
889
choice accuracy was quite good compared to the human participants in Experiment 1: the Japanese participants’ accuracy was 75.6%, and the U.S. participants’ accuracy was 81.6%. In a preliminary analysis of the model’s winner-takes-all performance in comparison with human participants, we found one serious outlier. One of the two CAFE stimuli portraying surprise (stimulus ID 033_s1) was classified as surprise by 89% of our human participants (both U.S. and Japanese), but all 10 of the EMPATH classifiers tested on this stimulus classified it as a fearful face. Indeed, the participants saw weak fear in the image (rated intensity of 2.16 compared to 4.53 for surprise), but EMPATH saw this stimulus as more similar to the fearful stimuli in its training set than to the surprise stimuli in its training set.7 This was the only stimulus for which EMPATH’s modal response was different from that of the human participants. To prevent this outlier from adversely skewing our parameter estimates, we excluded it from all of the analyses reported below. Using the unfitted model’s estimates of P#ci!x j$ for the 6 emotion categories and 55 test stimuli, we fit the 8 parameters of the decision model (Equation 6) to the Japanese and U.S. participants’ accuracy data separately, using the BFGS quasi-Newton algorithm implemented in Matlab (The Mathworks, Inc., 2002). The optimization’s objective was to find the parameters minimizing the sum squared difference between the predicted and observed human accuracies on each of the seven categories happy, sad, afraid, angry, surprised, disgusted, and neutral. Note that even though the number of parameters exceeds the number of data points to be fit, the parameters interact nonlinearly, so in general there is no solution and error minimization still applies. Both the “Japanese” and “American” versions of the baseline model fit their human populations’ per-emotion accuracies fairly closely; the model fit to the Japanese data achieved a root mean squared error (RMSE) of .0102, and the model fit to the American data achieved a RMSE of .0923. However, the pair of models did not exhibit the in-group effect found in Experiment 1 and shown in Figure 5a. Thus, in our model, decoding rules are not by themselves sufficient to explain the in-group advantage observed in Experiment 1. In the next section, we show how the previously described training set manipulations (aimed at modeling display rules and encoder-decoder distance) do indeed lead to models that do exhibit the in-group advantages from Experiment 1. Training set manipulation. We performed a search in the previously described 10-dimensional space describing the mixture of expressions, styles, and races comprising EMPATH’s training set. The objective of this search was to find the training set mixture best predicting the Judge Culture ( Expression Style interaction (Figure 5a) after the 8-parameter response bias model was fit to the subjects’ marginal emotion category accuracies. The training mixture search procedure was to begin at the baseline model, do a line search along every variable, choose the best fit so far, and repeat. We measured the difference between model and participants by the root mean squared difference between the participants’ and model’s performance on two categories of stimuli: the American-style 7 This may be because of a less pronounced jaw drop (AU 26) in picture 033_s1 compared with the other surprise stimuli. Also, the wrinkles on this poser’s forehead because of AUs 1 and 2 have a curved appearance, which EMPATH could confuse with the effects of the brows coming together (AU 4) as is typical in fearful expressions.
890
DAILEY ET AL.
stimuli in JACFEE and CAFE and the Japanese-style stimuli in JAFFE. The pair of models best predicting these category means should exhibit the in-group advantages observed in Experiment 1, and the composition of the training sets for these two models should reflect differences in the prior experience of the corresponding participant populations. The results of the search are shown in Table 6. The “Baseline Japanese” and “Baseline American” refer to the baseline model described above, with response biases fit to the Japanese or American per-emotion accuracy data. So that we could perform the same ANOVA on the model as we did on the human data, we used the Japanese and American models’ posterior probability estimates to generate 100 model Japanese and 100 model American participants’ responses to the stimuli. This is done by flipping a 7-sided weighted coin 100 times for each stimulus. The American model participants’ mean accuracies for each of the 55 test stimuli fit the American human participants’ mean accuracies with r2 & .2654; the Japanese model participants’ means fit the human means with r2 & .2986. We compared the models with the same analysis of variance performed in Table 5 and Figure 5a. The results of the model analysis are shown in Table 7 and Figure 5c. As expected, given the results of Table 6, our model Japanese participants were more accurate on the Japanese-style expressions, and our model American participants were more accurate on the American-style expressions.
Discussion In the introduction to this article, we described three factors that potentially affect facial expression interpretation in different cultures: encoder-decoder distance, display rules, and decoding rules. We model encoder-decoder distance by manipulating the amount of training our model has on a specific culture’s expressions. More training corresponds to lower distance, and less training corresponds to greater distance. A model trained on fewer American style expressions than another model would have a higher encoder-decoder distance for American-style expressions, and a model trained on fewer Japanese style expressions would have a higher encoder-decoder distance for Japanese-style expressions. Indeed, referring to Table 6, we see that the best model of the Japanese raters and the best model of the U.S. raters differ along the encoder-decoder distance dimension. The Japanese models were each trained, on average, on 54 Japanese style faces (100% of the JAFFE training data with 75% subsampling of the angry faces) and 92.4 American style faces (60% of the nonJapanese faces and 100% of the JACFEE Japanese faces with 75%
Table 7 Analysis of Variance of Model In-Group Advantages in Experiment 2 Source
df
)2
F
p
Culture Expression style Culture ( Expression style Error
1 1 1 10,996
.0002 .0023 .0041 .9909
2.04 25.52 45.98 (.1771)
.153 *.001 *.001
Note. Values enclosed in parentheses represent mean square errors.
subsampling of the angry faces), whereas the American models were each trained, on average, on 30.2 Japanese style faces (90% ! 60% of the JAFFE training data) and 143.9 American style faces. Overall, then, the Japanese models were trained on 78.8% more Japanese-style faces than the American models, and the American models were Trained on 55.7% more American-style faces than the Japanese models. These results are consistent with the hypothesis that different cultures evolve different styles of emotional expression, each a dialect of a universal language. We model display rules by manipulating the frequency of each emotion category in the training sets for each model population. Referring to Table 6, the best model of the U.S. raters had a uniform mixture of emotion categories in its training set, while the best model of the Japanese raters had a training set mixture in which the angry faces were subsampled at a rate of 75%. The model thus suggests that the Japanese participants have had less prior exposure to angry faces than their American counterparts. This would be consistent with the concept of display rules discouraging the expression of negative emotions in Japanese culture (see, e.g., Matsumoto et al., 1998). Looking more closely at the behavioral data, we see that Japanese participants were less accurate than U.S. participants on anger overall, but they were more accurate than U.S. participants on the JAFFE anger stimuli. When the anger stimulus is posed by a Japanese person in a Japanese cultural context (as was the case for the JAFFE stimuli), Japanese participants readily detect the anger signal and classify the stimulus as angry. Combined with the modeling data, this suggests that authentic Japanese-style anger expressions are rare but highly salient. If Japanese culture is indeed status differentiating (Matsumoto et al., 2002), detecting anger coming from higher-status others would be very important. We model decoding rules by manipulating the model’s response biases (priors) for each emotion category at classification time.
Table 6 Results of Search for Optimal Training Set Composition Response biases (relative to training set) Model Baseline Japanese Baseline American Best Japanese Best American Note.
Non-Japanese Japanese American Japanese Display rule RMSE faces faces style style manipulation Happy .0102 .0923 .0035 .0206
100% 100% 60% 100%
100% 100% 100% 90%
100% 100% 100% 100%
100% 100% 100% 60%
None None Anger 75% None
0.2279 0.1317 0.1419 0.1863
Sad
Afraid
Angry
0.1394 0.2267 0.2115 0.1768
0.0970 0.1788 0.1247 0.1805
0.1124 0.1741 0.2161 0.1781
Surprised Disgusted 0.2548 0.1279 0.1605 0.1347
Display rule manipulation corresponds to lower frequency of exposure to one or more emotion categories in the training set.
0.1187 0.1609 0.1453 0.1347
891
CULTURAL DIFFERENCES IN FACIAL EXPRESSION
Referring again to Table 6, in the optimal response bias results, we see that the Japanese model places large priors on sadness and anger, compared to its training set, whereas the American model places large priors on happiness, sadness, fear, and anger. The result that the Japanese model has a high response bias on anger is particularly interesting in light of the display rule results just mentioned. The best model of the Japanese raters is one that sees angry expressions rarely during training but is also one that monitors for angry expressions actively at classification time. This is again consistent with the theory of Japanese culture as status differentiating (Matsumoto et al., 2002). Furthermore, the result that the Japanese model has high response biases for both anger and sadness might indicate monitoring for negative expressions as a deviation from the norm in a homogeneity-sensitive (Triandis, 1995) or interdependent (Markus & Kitayama, 1991) society. Taken together, the results of our manipulations lead us to the conclusion that no one theory or factor accounts for cultural differences in facial expression interpretation. Rather, encoderdecoder distance, display rules, decoding rules, and other factors we did not model no doubt interact in a holistic way to produce a pattern of systematic differences among cultures. Our modeling experiments are a step toward untangling and understanding these interacting effects. As an example of the interdependence of the factors underlying cross cultural differences in facial expression interpretation, consider the cultural differences in recognition of fearful expressions found in our behavioral data and many other experiments in the literature. The Japanese model raters are inaccurate on fearful expressions compared to the American model raters because of (a) the perceptual similarity between fear and other negative expressions, (b) the overall smaller training set, and (c) a relatively low response bias for fear. Since fearful expressions are perceptually similar to other negative expressions, a large number of examples are required to train a model to distinguish them. As the training set size decreases (note from Table 6 that the Japanese models are trained on fewer faces overall, due to subsampling of non-Japanese and angry faces) the models’ performance on fear degrades faster than it does on easier expressions. These effects are exacerbated by the low response bias for fear, also shown in Table 6. Extrapolating from the model to the human population, we would say that in Japan, fearful expressions are neither frequent enough nor salient enough to warrant monitoring for them. This is in contrast to the previously discussed results on anger and sadness—anger and sadness expressions are surely more important than fearful expressions in day-to-day social communication, and this may be even more so in a culture which is more status differentiating (Matsumoto et al., 2002) and less fearful (Scherer et al., 1988) than western cultures. Our results point to the need for further study of the relationship between expression and recognition of fear and its role in social communication across cultures. Finally, we should point out that although the Model U.S. and Japanese participants exhibited the same interaction between judge culture and expression style as the human participants, at a more detailed level, there were also differences between the models and humans. On a per-stimulus basis, the American model only accounted for 26.5% of the variance in the U.S. participant data, and the Japanese model only accounted for 30.0% of the variance in the Japanese participant data. As an example, from the human data shown in Figure 4, we might expect that our model of the Japanese
raters would be less accurate at classifying the JAFFE fear faces than our model of the American raters. However, in the experiment it turned out that both model populations classified the two JAFFE fear stimuli in the test set with 100% accuracy. Similarly, as previously explained, one of the CAFE surprise stimuli had to be dropped from the analysis because 100% of the models classified it as fear. In general, the model participants perform more similarly to each other than human participants do. This is because ultimately, all of our models are trained on different subsets of the same training set containing less than 400 images. Obtaining model populations with performance as diverse as human populations would require a much larger and more diverse training set, mirroring the diversity of individual human experience.
Conclusion In this article, we have proposed a new computational model and methodology for analysis of cross-cultural differences in interpretation of emotional facial expressions. The model is based on Bayes-optimal inference using a set of class-conditional probability distributions and a set of priors, both of which are modified through experience and context. In two experiments, we have demonstrated reciprocal in-group advantages for Japanese and American judges of emotional facial expressions and shown, with the model, how the differences might arise in different cultural learning environments. The Japanese in-group advantage occurs when the Japanese stimuli in JACFEE are analyzed as out-group stimuli rather than in-group stimuli. This is consistent with Matsumoto and colleagues’ null results in testing for in-group advantages with JACFEE (Matsumoto, 2002); however, by contrast, our findings also support the view that cultural differences in emotional expression are best studied with stimuli elicited as naturally and freely as possible within the poser’s cultural context (Elfenbein & Ambady, 2002a). Is it actually possible for the Japanese participants to determine, consciously or unconsciously, that the JACFEE Japanese stimuli portray out-group members and treat them as such? The answer might be yes; in a recent study, Marsh, Elfenbein, and Ambady (Marsh, Elfenbein, & Ambady, 2003) found that American participants were not only above chance at classifying the nationality (Japanese or American) of the ethnically Japanese posers in JACFEE, but also more accurate at the task when using the JACFEE emotional images as opposed to the corresponding neutral stimuli from the same posers. This result was obtained even though the JACFEE emotional stimuli were originally carefully prepared to eliminate any trace of individuality in the expressions. Comparing the training set mixtures for our best Japanese and best American EMPATH models, we found that the Japanese pattern of responses is reproduced by EMPATH when it is trained on fewer non-Japanese faces, fewer angry faces, more Japanese faces, and more Japanese-style expressions. This is a satisfying explanation of the results of Experiment 1. But more generally, it is a parsimonious explanation of the culturally dependent aspects of facial expression recognition in that only a few factors (prior exposure to expression styles, emotion categories, and racial groups, along with differing response biases) are necessary to explain the subtle differences in facial
892
DAILEY ET AL.
expression interpretation between cultures. We find that while many aspects of production of facial expressions may be innate and universal across cultures, there are subtle differences in the gestures used in different cultures, and the system responsible for recognizing and interpreting those facial gestures is strongly dependent on learning. As the recognition system learns through experience in the context of a specific culture, subtle differences in expression lead to systematic differences in interpretation across cultures. Our results thus indicate that learning such culture-specific variations in facial gestures is the critical factor underlying the in-group advantage in emotional expression recognition. We have found that EMPATH is a powerful tool for exploring hypotheses about human behavior in facial expression experiments. In future research, we hope to employ it toward a more detailed understanding of the critical facial features humans use to make judgments about emotion in faces and the subtle differences in facial expression styles.
References Biehl, M., Matsumoto, D., Ekman, P., Hearn, V., Heider, K., Kudoh, T., et al. (1997). Matsumoto and Ekman’s Japanese and Caucasian Facial Expressions of Emotion (JACFEE): Reliability data and cross-national differences. Journal of Nonverbal Behavior, 21, 3–21. Bishop, C. M. (1995). Neural networks for pattern recognition. Oxford: Oxford University Press. Dailey, M. N., Cottrell, G. W., Padgett, C., & Adolphs, R. (2002). EMPATH: A neural network that categorizes facial expressions. Journal of Cognitive Neuroscience, 14, 1158 –1173. Darwin, C. (1998). The expression of the emotions in man and animals (3rd ed.). New York: Oxford University Press. (Original work published 1872) Daugman, J. G. (1985). Uncertainty relation for resolution in space, spatial frequency, and orientation optimized by two-dimensional visual cortical filters. Journal of the Optical Society of America A, 2, 1160 –1169. Ekman, P. (1972). Universals and cultural differences in facial expressions of emotion. In J. Cole (Ed.), Nebraska Symposium on Motivation 1971 (pp. 207–283). Lincoln, NE: University of Nebraska Press. Ekman, P. (1994). Strong evidence for universals in facial expressions: A reply to Russell’s mistaken critique. Psychological Bulletin, 115, 268 –287. Ekman, P. (1999a). Basic emotions. In T. Dalgleish & M. Power (Eds.), Handbook of cognition and emotion (pp. 45– 60). New York: Wiley. Ekman, P. (1999b). Facial expressions. In T. Dalgleish & M. Power (Eds.), Handbook of cognition and emotion (pp. 301–320). New York: Wiley. Ekman, P., & Friesen, W. (1976). Pictures of facial affect. Palo Alto, CA: Consulting Psychologists Press. Ekman, P., & Friesen, W. (1978). Facial action coding system: A technique for the measurement of facial movement. Palo Alto, CA: Consulting Psychologists Press. Ekman, P., & Friesen, W. V. (1971). Constants across cultures in the face and emotion. Journal of Personality and Social Psychology, 17, 124 –129. Ekman, P., Friesen, W. V., & Hager, J. C. (2002). FACS investigator’s guide. Salt Lake City, UT: A Human Face. Ekman, P., Friesen, W. V., O’Sullivan, M., Chan, A., DiacoyanniTarlatzis, I., Heider, K., et al. (1987). Universals and cultural differences in the judgments of facial expressions of emotion. Journal of Personality and Social Psychology, 53, 712–717. Ekman, P., Sorensen, E. R., & Friesen, W. V. (1969). Pan-cultural elements in facial displays of emotions. Science, 164, 86 – 88. Elfenbein, H., & Ambady, N. (2002a). Is there an in-group advantage in emotion recognition? Psychological Bulletin, 128, 243–249. Elfenbein, H., & Ambady, N. (2002b). On the universality and cultural
specificity of emotion recognition: A meta-analysis. Psychological Bulletin, 128, 203–235. Elfenbein, H., & Ambady, N. (2003a). Cultural similarity’s consequences: A distance perspective on cross-cultural differences in emotion recognition. Journal of Cross-Cultural Psychology, 34, 92–110. Elfenbein, H., & Ambady, N. (2003b). When familiarity breeds accuracy: Cultural exposure and facial emotion recognition. Journal of Personality and Social Psychology, 85, 276 –290. Elfenbein, H., Beaupre´, M., Le´vesque, M., & Hess, U. (2007). Toward a dialect theory: Cultural differences in the expression and recognition of posed facial expressions. Emotion, 7, 131–146. Fleishman, A. (1980). Confidence intervals for correlation ratios. Educational and Psychological Measurement, 40, 659 – 670. Fridlund, A. (1994). Human facial expression: An evolutionary view. San Diego: Academic Press. Friesen, W. V. (1972). Cultural differences in facial expressions in a social situation: An experimental test of the concept of display rules. Unpublished doctoral dissertation, University of California, San Francisco. Gudykunst, W., & Ting-Toomey, S. (1988). Culture and affective communication. American Behavioral Scientist, 31, 384 – 400. Hofstede, G. (1983). Dimensions of national cultures in fifty countries and three regions. In J. Deregowski, S. Dziurawiec, & R. Annis (Eds.), Expiscations in cross-cultural psychology (pp. 335–355). Lisse: Swets & Zeitlinger. Hofstede, G. (2001). Culture’s consequences: Comparing values, behaviors, institutions, and organizations across nations (2nd ed.). Thousand Oaks, CA: Sage. Huang, Y., Tang, S., Helmeste, D., Shiori, T., & Someya, T. (2001). Differential judgement of static facial expressions of emotions in three cultures. Psychiatry and Clinical Neurosciences, 55, 479 – 483. Izard, C. E. (1994). Innate and universal facial expressions: Evidence from developmental and cross-cultural research. Psychological Bulletin, 115, 288 –299. Jones, J. P., & Palmer, L. A. (1987). An evaluation of the two-dimensional Gabor filter model of receptive fields in cat striate cortex. Journal of Neurophysiology, 58, 1233–1258. Kanade, T., Cohn, J., & Tian, Y. (2000). Comprehensive database for facial expression analysis. In Proceedings of the fourth IEEE international conference on automatic face and gesture recognition (pp. 46 –53). Grenoble, France: IEEE Computer Society. Keppel, G. (1991). Design and analysis: A researcher’s handbook (3rd ed.). Upper Saddle River, NJ: Prentice Hall. Kirby, M., & Sirovich, L. (1990). Application of the Karhunen-Loeve procedure for the characterization of human faces. IEEE Transactions on Pattern Analysis Machine Intelligence, 12, 103–108. Knill, D., & Richards, W. (Eds.). (1996). Perception as Bayesian inference. New York: Cambridge University Press. Lades, M., Vorbru¨ggen, J. C., Buhmann, J., Lange, J., von der Malsburg, C., Wu¨rtz, R. P., et al. (1993). Distortion invariant object recognition in the dynamic link architecture. IEEE Transactions on Computers, 42, 300 –311. Landis, C. (1924). Studies of emotional reactions: II. General behavior and facial expression. Journal of Comparative Psychology, 4, 447–509. Loftus, G. (2002). Analysis, interpretation, and visual presentation of experimental data. In Stevens’ handbook of experimental psychology (3rd ed., Vol. 4, pp. 339 –390). New York: Wiley. Lyons, M. J., Akamatsu, S., Kamachi, M., & Gyoba, J. (1998). Coding facial expressions with Gabor wavelets. In Proceedings of the third IEEE international conference on automatic face and gesture recognition (pp. 200 –205). Nara, Japan: IEEE Computer Society. Lyons, M. J., Budynek, J., & Akamatsu, S. (1999). Automatic classification of single facial images. IEEE Transactions on Pattern Analysis and Machine Intelligence, 21, 1357–1362. Lyons, M. J., Campbell, R., Plante, A., Coleman, M., Kamachi, M., &
CULTURAL DIFFERENCES IN FACIAL EXPRESSION Akamatsu, S. (2000). The Noh mask effect: Vertical viewpoint dependence of facial expression perception. Proceedings of the Royal Society of London B, 267, 2239 –2245. Ma, W. J., Beck, J. M., Latham, P. E., & Pouget, A. (2006). Bayesian inference with probabilistic population codes. Nature Neuroscience, 9, 1432–1438. Markus, H., & Kitayama, S. (1991). Culture and the self: Implications for cognition, emotion, and motivation. Psychological Review, 98, 224 – 253. Marsh, A., Elfenbein, H., & Ambady, N. (2003). Nonverbal “accents”: Cultural differences in facial expressions of emotion. Psychological Science, 14, 373–376. Matsumoto, D. (1990). Cultural similarities and differences in display rules. Motivation and Emotion, 14, 195–214. Matsumoto, D. (1992). American-Japanese cultural differences in the recognition of universal facial expressions. Journal of Cross-Cultural Psychology, 23, 72– 84. Matsumoto, D. (1993). Ethnic differences in affect intensity, emotion judgments, display rule attitudes, and self-reported emotional expression in an American sample. Motivation and Emotion, 17, 107–123. Matsumoto, D. (2002). Methodological requirements to test a possible in-group advantage in judging emotions across cultures: Comment on Elfenbein and Ambady (2002) and evidence. Psychological Bulletin, 128, 236 –242. Matsumoto, D. (2005). Scalar ratings of contempt expressions. Journal of Nonverbal Behavior 29, 91–104. Matsumoto, D., & Assar, M. (1992). The effects of language on judgments of universal facial expressions of emotion. Journal of Nonverbal Behavior, 16, 85–99. Matsumoto, D., Consolacion, T., Yamada, H., Suzuki, R., Franklin, B., Paul, S., et al. (2002). American-Japanese cultural differences in judgements of emotional expressions of different intensities. Cognition & Emotion, 16, 721–747. Matsumoto, D., & Ekman, P. (1988). Japanese and Caucasian facial expressions of emotion (JACFEE) and neutral faces (JACNeuF) [slides]. San Francisco: Intercultural and Emotion Research Laboratory, Department of Psychology, San Francisco State University. Matsumoto, D., & Ekman, P. (1989). American-Japanese cultural differences in intensity ratings of facial expressions of emotion. Motivation and Emotion, 13, 143–157. Matsumoto, D., Kudoh, T., & Takeuchi, S. (1996). Changing patterns of individualism and collectivism in the United States and Japan. Culture and Psychology, 2, 77–107. Matsumoto, D., Takeuchi, S., Andayani, S., Kouznetsova, N., & Krupp, D. (1998). The contribution of individualism vs. collectivism to crossnational differences in display rules. Asian Journal of Social Psychology, 1, 147–165.
893
Matsumoto, D., Yoo, S., Hirayama, S., & Petrova, G. (2005). Development and validation of a measure of display rule knowledge: The Display Rule Assessment Inventory. Emotion, 5, 23– 40. O’Toole, A., Deffenbacher, K., Valentin, D., & Abdi, H. (1994). Structural aspects of face recognition and the other-race effect. Memory & Cognition, 22, 208 –224. Russell, J. A. (1994). Is there universal recognition of emotion from facial expression? A review of the cross-cultural studies. Psychological Bulletin, 115, 102–141. Russell, J. A. (1995). Facial expressions of emotion: What lies beyond minimal universality? Psychological Bulletin, 118, 379 –391. Russell, J. A., & Bullock, M. (1986). Fuzzy concepts and the perception of emotion in facial expressions. Social Cognition, 4, 309 –341. Russell, J. A., Suzuki, N., & Ishida, N. (1993). Canadian, Greek, and Japanese freely produced emotion labels for facial expressions. Motivation and Emotion, 17, 337–351. Scherer, K. (1992). What does facial expression express? In K. Strongman (Ed.), International review of studies on emotion (Vol. 2, pp. 139 –165). Chichester, United Kingdom: Wiley. Scherer, K., Matsumoto, D., Wallbott, H., & Kudoh, T. (1988). Emotional experience in cultural context: A comparison between Europe, Japan, and the USA. In K. Scherer (Ed.), Facets of emotion: Recent research. Hillsdale, NJ: Erlbaum. Schlosberg, H. (1952). The description of facial expressions in terms of two dimensions. Journal of Experimental Psychology, 44, 229 –237. Shioiri, T., Someya, T., Helmeste, D., & Tang, S. W. (1999). Misinterpretation of facial expression: A cross-cultural study. Psychiatry and Clinical Neurosciences, 53, 45–50. Tanako, Y., & Osaka, E. (1999). An unsupported common view: Comparing Japan and the U.S. on individualism/collectivism. Asian Journal of Social Psychology, 2, 311–341. The Mathworks, Inc. (2002). Matlab optimization toolbox [computer software]. Natick, MA: The Mathworks, Inc. Tomkins, S. S. (1962–1963). Affect, imagery, consciousness (Vols. 1–2). New York: Springer. Tomkins, S. S., & McCarter, R. (1964). What and where are the primary affects? Some evidence for a theory. Perceptual and Motor Skills, 18, 119–158. Triandis, H. (1995). Individualism and collectivism. Boulder, CO: Westview Press. Turk, M., & Pentland, A. (1991). Eigenfaces for recognition. Journal of Cognitive Neuroscience, 3, 71– 86. Woodworth, R. S. (1938). Experimental psychology. New York: Holt.
Received March 9, 2009 Revision received April 23, 2010 Accepted April 29, 2010 "


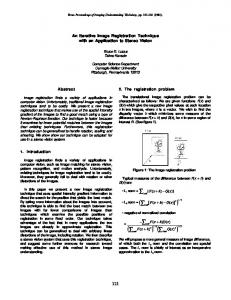


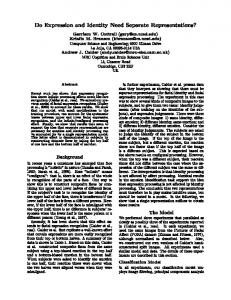


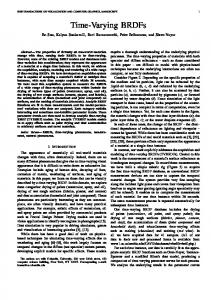
![ModelSim Tutorial - UCSD CSE [PDF]](https://m.moam.info/img/260x300/modelsim-tutorial-ucsd-cse-pdf_64799306098a9e495b8b45ed.jpg)