Human Biology Volume 85 Issue 1 Special Issue on Revisiting the "Negrito" Hypothesis
Article 12
11-27-2013
Evolution of the Pygmy Phenotype: Evidence of Positive Selection from Genome-wide Scans in African, Asian, and Melanesian Pygmies Andrea Bamberg Migliano Department of Anthropology, University College London, London, UK,
[email protected]
Irene Gallego Romero Leverhulme Centre for Human Evolutionary Studies, Department of Biological Anthropology, University of Cambridge, Cambridge, UK
Mait Metspalu Department of Evolutionary Biology, University of Tartu and Estonian Biocentre, Tartu, Estonia
Matthew Leavesley Archaeology Department, James Cook University, Cairns, Australia
Luca Pagani Leverhulme Centre for Human Evolutionary Studies, Department of Biological Anthropology, University of Cambridge, Cambridge, UK See next page for additional authors
Follow this and additional works at: http://digitalcommons.wayne.edu/humbiol Recommended Citation Migliano, Andrea Bamberg; Romero, Irene Gallego; Metspalu, Mait; Leavesley, Matthew; Pagani, Luca; Antao, Tiago; Huang, Da-Wei; Sherman, Brad T.; Siddle, Katharine; Scholes, Clarissa; Hudjashov, Georgi; Kaitokai, Elton; Babalu, Avis; Belatti, Maggie; Cagan, Alex; Hopkinshaw, Bryony; Shaw, Colin; Nelis, Mari; Metspalu, Ene; Mägi, Reedik; Lempicki, Richard A.; Villems, Richard; Lahr, Marta Mirazon; and Kivisild, Toomis (2013) "Evolution of the Pygmy Phenotype: Evidence of Positive Selection from Genome-wide Scans in African, Asian, and Melanesian Pygmies," Human Biology: Vol. 85: Iss. 1, Article 12. Available at: http://digitalcommons.wayne.edu/humbiol/vol85/iss1/12
This Open Access Article is brought to you by DigitalCommons@WayneState. It has been accepted for inclusion in Human Biology by the editorial board. For more information, please contact
[email protected].
Evolution of the Pygmy Phenotype: Evidence of Positive Selection from Genome-wide Scans in African, Asian, and Melanesian Pygmies Abstract
Human pygmy populations inhabit different regions of the world, from Africa to Melanesia. In Asia, shortstatured populations are often referred to as "negritos." Their short stature has been interpreted as a consequence of thermoregulatory, nutritional, and/or locomotory adaptations to life in tropical forests. A more recent hypothesis proposes that their stature is the outcome of a life history trade-off in high-mortality environments, where early reproduction is favored and, consequently, early sexual maturation and early growth cessation have coevolved. Some serological evidence of deficiencies in the growth hormone/insulinlike growth factor axis have been previously associated with pygmies’ short stature. Using genome-wide single-nucleotide polymorphism genotype data, we first tested whether different negrito groups living in the Philippines and Papua New Guinea are closely related and then investigated genomic signals of recent positive selection in African, Asian, and Papuan pygmy populations. We found that negritos in the Philippines and Papua New Guinea are genetically more similar to their nonpygmy neighbors than to one another and have experienced positive selection at different genes. These results indicate that geographically distant pygmy groups are likely to have evolved their short stature independently. We also found that selection on common height variants is unlikely to explain their short stature and that different genes associated with growth, thyroid function, and sexual development are under selection in different pygmy groups. Keywords
Pygmies, Negritos, Evolution, Phenotype, Genotype, Natural Selection, Convergent Adaptation Authors
Andrea Bamberg Migliano, Irene Gallego Romero, Mait Metspalu, Matthew Leavesley, Luca Pagani, Tiago Antao, Da-Wei Huang, Brad T. Sherman, Katharine Siddle, Clarissa Scholes, Georgi Hudjashov, Elton Kaitokai, Avis Babalu, Maggie Belatti, Alex Cagan, Bryony Hopkinshaw, Colin Shaw, Mari Nelis, Ene Metspalu, Reedik Mägi, Richard A. Lempicki, Richard Villems, Marta Mirazon Lahr, and Toomis Kivisild
This open access article is available in Human Biology: http://digitalcommons.wayne.edu/humbiol/vol85/iss1/12
Evolution of the Pygmy Phenotype: Evidence of Positive Selection from Genome-wide Scans in African, Asian, and Melanesian Pygmies 1
* IRENE GALLEGO ROMERO,2 MAIT METSPALU,3 MATTHEW 2 5 5 LEAVESLEY, LUCA PAGANI, TIAGO ANTAO, DA-WEI HUANG, BRAD T. SHERMAN, 2 2 3 6 KATHARINE SIDDLE, CLARISSA SCHOLES, GEORGI HUDJASHOV, ELTON KAITOKAI, AVIS 6 2 2 2 2 BABALU, MAGGIE BELATTI, ALEX CAGAN, BRYONY HOPKINSHAW, COLIN SHAW, MARI 3 3 3,7 5 3 NELIS, ENE METSPALU, REEDIK MÄGI, RICHARD A. LEMPICKI, RICHARD VILLEMS, 2† 2,3† MARTA MIRAZON LAHR, AND TOOMAS KIVISILD ANDREA BAMBERG MIGLIANO, 4
2
Abstract Human pygmy populations inhabit different regions of the world, from Africa to Melanesia. In Asia, short-statured populations are often referred to as “negritos.” Their short stature has been interpreted as a consequence of thermoregulatory, nutritional, and/or locomotory adaptations to life in tropical forests. A more recent hypothesis proposes that their stature is the outcome of a life history trade-off in high-mortality environments, where early reproduction is favored and, consequently, early sexual maturation and early growth cessation have coevolved. Some serological evidence of deficiencies in the growth hormone/insulin-like growth factor axis have been previously associated with pygmies’ short stature. Using genome-wide single-nucleotide polymorphism genotype data, we first tested whether different negrito groups living in the Philippines and Papua New Guinea are closely related and then investigated genomic signals of recent positive selection in African, Asian, and Papuan 1
Department of Anthropology, University College London, London, UK. Leverhulme Centre for Human Evolutionary Studies, Department of Biological Anthropology, University of Cambridge, Cambridge, UK. 3 Department of Evolutionary Biology, University of Tartu and Estonian Biocentre, Tartu, Estonia. 4 Archaeology Department, James Cook University, Cairns, Australia. 5 Laboratory of Immunopathogenesis and Bioinformatics, Clinical Services Program, SAIC-Frederick Inc., National Cancer Institute at Frederick, Frederick, MD. 6 University of Papua New Guinea, Port Moresby, Papua New Guinea. 7 Genetic and Genomic Epidemiology Unit, Wellcome Trust Centre for Human Genetics, University of Oxford, Oxford, UK. *Correspondence to: Andrea Bamberg Migliano, Department of Anthropology, University College London, London WC1E 6BT. E-mail:
[email protected]. † These authors contributed equally to the manuscript and share the senior authorship. Research was developed at the Leverhulme Centre for Human Evolutionary Studies, Department of Biological Anthropology, University of Cambridge, and at the Department of Evolutionary Biology, University of Tartu and Estonian Biocentre. 2
Human Biology, February–June 2013, v. 85, no. 1–3, pp. 251–284. Copyright © 2013 Wayne State University Press, Detroit, Michigan 48201-1309 KEY WORDS: PYGMIES, NEGRITOS, EVOLUTION, PHENOTYPE, GENOTYPE, NATURAL SELECTION, CONVERGENT ADAPTATION.
252 /
MIGLIANO ET AL.
pygmy populations. We found that negritos in the Philippines and Papua New Guinea are genetically more similar to their nonpygmy neighbors than to one another and have experienced positive selection at different genes. These results indicate that geographically distant pygmy groups are likely to have evolved their short stature independently. We also found that selection on common height variants is unlikely to explain their short stature and that different genes associated with growth, thyroid function, and sexual development are under selection in different pygmy groups.
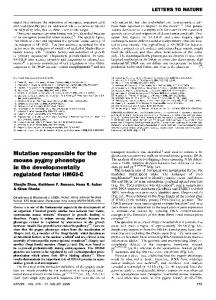
The term negrito has been used in the literature to refer to short-statured huntergatherers living in Asia, Southeast Asia, and Melanesia (Andaman Islands, Peninsula Malaysia, and the Philippines). The term pygmy has sometimes been used to refer to short-statured populations in Africa, but in other publications, the term pygmy is used to refer to short-statured populations in general (both in and outside of Africa). Here we are concerned with the evolution of short stature in human populations; we use the term pygmy to refer to all the short-statured populations, and when necessary to distinguish Asian and Melanesian groups, we use the term negrito. We do not intend to imply common origin when applying the terms pygmy and negrito; we use the terms to describe a particular phenotype. Pygmy populations, characterized by their extremely short adult stature (average adult male height < 155 cm; Cavalli-Sforza 1986; Migliano et al. 2007), exist in Africa, the Andaman Islands, Peninsula Malaysia, the Philippines, and Papua New Guinea (Figure 1). While early researchers speculated that existence of short-statured peoples in scattered locations across the world (known as pygmies in the west of the Old World and negritos in the east) was associated with a single primordial migration of pygmy peoples, recent work has shown that, by and large, short-statured populations worldwide are more closely related to their neighbor populations than they are to one another (Endicott et al. 2003; HUGO Pan Asian SNP Consortium 2009). However, the relatedness among different pygmy groups in Asia and Melanesia is less clear, and the great degree of admixture between pygmies and neighbor nonpygmy populations in the Philippines and Malaysia might have weaken signals of ancestral communalities (Heyer et al. this issue; Jinam et al. 2012; Scholes et al. 2011; Rasmussen et al. 2011). A diverse body of evidence supports the view that short stature in African and Asian pygmies is not caused by poor nutrition but has a distinct genetic basis (Migliano et al. 2007; Perry and Dominy 2009). Independently from whether “negrito phenotypes” have evolved once or a few times convergently, various adaptive hypotheses have been put forward to explain the phenotype, relating it to locomotion in dense tropical forests (Turnbull 1986), reduced heat production in hot and humid environments (Cavalli-Sforza 1986), or low caloric intake (Shea and Bailey 1996). None of these hypotheses, however, fully explains the observed range of height variation in populations living in hot tropical forests. Moreover, the fact that some pygmy-sized populations live in nontropical cool and dry environments contradicts these hypotheses (Diamond 1991). An alternative hypothesis proposes
Figure 1. Locations of pygmy populations in Africa, Asia, and Oceania included in this study. Pictures are included for populations for which samples were collected for this study.
Evolution of the Pygmy Phenotype / 253
254 /
MIGLIANO ET AL.
that short stature itself is not an adaptation but, rather, a consequence of a trade-off between growth and reproduction in high-mortality environments, where selection for early reproduction (to ensure reproduction before death) leads to early sexual maturation, early growth secession, and, consequently, short stature (Migliano et al. 2007). Although it is possible that a combination of different selective pressures led to the evolution of extreme short stature and that different populations suffered different selective pressures (Perry and Dominy 2009), the life-history hypothesis is the only explanation that has been shown to affect reproductive fitness in pygmies (Migliano et al. 2007). Recent advances in genomics allow the search for signatures of natural selection (Sabeti et al. 2006; Voight et al. 2006; Pickrell et al. 2009) and, consequently, enable us to track the adaptive history of human populations in the recent past, even if those adaptations no longer contribute with the populations’ reproductive fitness. Furthermore, genomics might allow us to explore whether similar phenotypes (such as the short stature of different pygmy groups) are likely to have evolved convergently or are a result of a shared common ancestry. Previous genetic studies on the history of pygmy populations, using mitochondrial DNA, Y-chromosome, or autosomal markers, have shown that these populations are not uniquely related (Endicott et al. 2003; Thangaraj et al. 2005; Reich et al. 2009). Within Africa, demographic modeling using approximate Bayesian computation suggests that western African and eastern groups of Central African pygmies separated from local nonpygmy groups 60–70 kya and from each other around 20 kya (Verdu et al. 2009; Patin et al. 2009; Batini et al. 2011). The evolutionary history of negrito populations outside Africa has been much less explored. Although negritos in the Malay Peninsula and the Philippines have been shown to be genetically more similar to their local neighboring populations than to one another (Thangaraj et al. 2005), little is known about other negrito populations within Asia and Melanesia. The adaptive evolution of the pygmy phenotype is even less understood. Studies show that in Africa, genes of the growth hormone/insulinlike growth factor (GH/IGF) signaling pathway (IGF2R, PIK3R3) and the thyroid hormone pathway (TRIP4, IYD) are under selection in Biaka and Mbuti pygmies, leading to the suggestion that these genetic variants may explain the evolution of short stature among African pygmies (Pickrell et al. 2009; Herráez et al. 2009). Recently, genes such as DOCK3, associated with height variation in Europeans, and CISH, a growth hormone inhibitor, have been associated with height variation in western African pygmies (Jarvis et al. 2012; Lachance et al. 2012). Here, we investigate three questions regarding the evolution of human pygmies: (1) Do different negrito populations share a private history? (2) Did their extreme short stature evolve independently? (3) Among those groups of genes that have been previously associated with particular aspects of the pygmy phenotype, which, if any, have been under positive selection in pygmy populations? To address these questions, we have generated genome-wide genotyping data from three Philippine pygmy groups and their nonpygmy neighbors, as well as two pygmy groups from different regions of the Papuan Highlands and their nonpygmy neighbors (see Figure 1, Table S1, Appendix). A total of 113 individuals from these
Evolution of the Pygmy Phenotype / 255
five pygmy groups and neighboring populations were genotyped using Illumina HumanHap 610K arrays (see Appendix). The data were analyzed in combination with similar data available for 728 samples from the Human Genome Diversity Panel (HGDP)–Centre d’Etude du Polymorphisme Humain (CEPH) Human Genome Diversity Cell Line Panel (Li et al. 2008), including two African pygmy groups (Biaka and Mbuti) (see Appendix).
Material and Methods Populations and Sampling Strategy Philippines. From the Philippines, three groups of pygmies were included in the analyses: the Aeta, the Batak, and the Agta. The Appendix provides a short description of these groups, sample collection, and their similar phenotypes. The new data on the Aeta, Batak, and Agta presented in this article were obtained during two seasons of fieldwork in 2007 and 2008. Aeta and Batak individuals were measured to record their variation in body size, and extensive interviews were conducted in order to record the genealogies and the levels of relatedness between individuals; saliva samples were collected using Oragene DNA Self-Collection Kits (DNA Genotek, ON, Canada), after informed consent. Besides the negrito groups, the analyses also included samples from the Tagbanua tribe, “phenotypically Asian” small-scale agriculturalists from Palawan island, with an estimated population of 181,567 people by the National Commission on Indigenous Peoples (NCIP) (Cariño 2012). We also included Filipinos from Zambales Province and from the Casiguran municipality in Aurora Province, who lived in the areas surrounding the Agta and Aeta territory (see Appendix and Table S1). Papua New Guinea. From Papua New Guinea two groups of pygmies were included in the analyses, one from the Koinambe village in the Western Highlands Province, and the other from Kosipe mission in the Goilala District of Central Province. Saliva samples and body measurements were also collected for nonpygmy individuals from the Western Highlands Province: speakers of Trans-New Guinea languages, with no ascendants from the Jimi River area (see Appendix and Table S1). Sampling. Data collection in the Philippines and Papua New Guinea took place during July and August 2007 and July and August 2008. Saliva samples were collected as part of a larger anthropological project recording phenotypes and demography of the different pygmy groups (coordinated by A.B.M.; samples in the Philippines collected by A.B.M., K.S., C.S., and K.T.; in Papua New Guinea, by A.B.M., M.L., E.K., C.S., and A.B.). Permits for sampling were obtained from the National Research Institute in Papua New Guinea and from the NCIP in the Philippines (the two governmental organizations responsible for regulating research on the local indigenous peoples in those countries).
256 /
MIGLIANO ET AL.
Ethics. Approval was obtained from the University of Cambridge, following local approvals by the governments of the two countries involved in the studies. We obtained ethical clearance from the NCIP for the Philippine sample and from the National Research Institute for the Papuan samples. Approval was also obtained at the local community level, from the elders’ committee in each of the locations, and informed consent was obtained from all participants (written in their own languages) after a presentation of the research objectives in Tagalog for the Philippine populations and in Pidgin for Papuan populations. Samples from the HGDP-CEPH Human Genome Diversity Cell Line Panel From the 938 unrelated individuals of the 51 global populations in the HGDPCEPH panel included in analyses by Li et al. (2008), 38 populations (728 individuals) were selected to represent the relevant world regions (see Appendix for selection criteria). The HGDP-CEPH panel includes two groups of pygmies, the Biaka (western Africa) and the Mbuti (eastern Africa), which are used in the comparisons with negritos. Genotyping and Quality Control. Around 150 samples were collected for each of the pygmy populations, from which a subset of unrelated individuals (ascertained through genealogies) were selected for genotyping (see Appendix and Table S1 for genotyped samples). Samples were genotyped with Human610-Quadv1.0 BeadChips on the Illumina platform with standard protocols and BeadStudio GT Module, version 3.1 (Illumina, CA, USA), was used to assign genotypes. The new data were combined with a subset of the publicly available HGDP genotypes (Li et al. 2008). We used PLINK version 1.05 (Purcell et al. 2007) for data management and quality control and to exclude from selection scans individuals related by identity-by-descent values higher than 0.125 (see Appendix). Structure-like Analysis We ran ADMIXTURE (Alexander et al. 2009) with random seed number generator on the linkage disequilibrium (LD)-pruned data set 100 times at K = 2 to K = 10. Several “structure-like” algorithms are available for capturing population genetic structure in large multilocus data sets. These model-based approaches construct a predefined number (K) of “ancestral populations” (defined by allele frequencies at all loci) and simultaneously assign respective ancestry proportions for each sample in the study. Compared with the original Bayesian approach (Pritchard et al. 2000; Falush et al. 2003), recent maximum-likelihood approaches have pronounced computational advantages (Tang et al. 2005; Li et al. 2008; Alexander et al. 2009) that make them more suitable for inferring structure in large data sets. Following an established procedure (Rasmussen et al. 2010; Behar et al. 2010), we examined the log-likelihood scores (LLs) of the individual runs and found that the maximum difference between LLs in the 10% fraction of the runs with the highest LLs was minimal (80% frequency), and iHS is better at detecting alleles at moderate frequencies (40–80%) (Voight et al. 2006). Both statistics were calculated using tools available at http://
258 /
MIGLIANO ET AL.
hgdp.uchicago.edu. Genetic distances between markers were calculated using the HapMap genetic map (Frazer et al. 2007). It is important to note, however, that we focus here on relatively recent positive selection processes (no more than 40 kya) (Pritchard and Di Rienzo 2010; Sabeti et al. 2007); other biological processes involved in the evolution of pygmy phenotypes may not be identified in this study because of methodological limitations. Following quality control, we phased all 477,950 autosomal SNPs overlapping with HapMap3 data using Beagle version 3.3.2 (Browning and Browning 2007). For phasing African data we used HapMap Yoruba trios, and for phasing non-African data we used HapMap CEU trio data. Genetic distances between markers were calculated using the HapMap genetic map (Frazer et al. 2007). For iHS, ancestral and derived states for each SNP were established by comparison with the UCSC snp128OrthoPanTro2RheMac2 table taken from the Ensembl variation database (Chen et al. 2010). Data were split into contiguous nonoverlapping 200-kb windows and normalized as described in Pickrell et al. (2009), resulting in a final set of ~13,000 data points for each population or population pair that spans most of the autosomal genome. The highest XP-EHH score in a window and the fraction of SNPs in a window with an iHS score > |2| were used as test statistics; windows with fewer than 15 SNPs were excluded from further analyses for this statistic. Windows were ranked as described in Pickrell et al. (2009), and the top 1% and 5% outliers for each comparison were examined as detailed below (see Appendix). XP-EHH requires two populations; because the African Mandenka, Yoruba, and Bantu farmers have clustered together in previous analyses of population structure (Li et al. 2008; Rosenberg et al. 2002), they were grouped together in our analyses and used as the outgroup population for all comparisons; HGDP Europeans were used as the outgroup for analyses where the focal population was African farmers. We calculated XP-EHH scores for Mbuti and Biaka pygmies; for the Aeta and Batak from the Philippines; for the Han Chinese and Cambodians combined; and in Papua New Guinea, for the Koinambe pygmies and for Papuan nonpygmies, drawn both from our own samples (nonpygmies from the Western Highlands Province) and from the HGDP-CEPH panel (Papuans). XP-EHH scores will vary according to the reference population; this allows for using different reference populations (which shared a common ancestral with the negrito groups at different times in the past) to infer the adaptive trajectory of the different negrito groups. Therefore, we also calculated XP-EHH scores for the pygmies outside Africa using as reference groups their closest related nonpygmy groups (i.e., Han Chinese combined with Cambodians for the Aeta and Batak, and Papuan nonpygmies for Koinambe pygmies). These local comparisons are likely to reveal complete selective sweeps that happened more recently after the separation of pygmies and nonpygmies in each geographic region (see Appendix). iHS scores were calculated for Mbuti and Biaka pygmies and the combined African farmer groups; Aeta and Batak from the Philippines; the combined Han Chinese and Cambodians; the combined Koinambe and Kosipe pygmies from Papua New Guinea (iHS analyses require a larger sample size than XP-EHH [Pickrell et
Evolution of the Pygmy Phenotype / 259
al. 2009], so Kosipe and Koinambe pygmies had to be combined for iHS analyses); and for Papuan nonpygmies (see Appendix). Shared Windows Calculations. We calculated the percentage of shared windows across populations in the extreme tails of iHS and XP-EHH distributions (1% and 5%), by comparing the number of windows at the 1% of the population of interest that was also present in the 5% tail of distribution in the other populations, as described in Pickrell et al. (2009). The shared top XP-EHH signals of selection for these populations are shown in Table 1. We have also calculated percentages of shared windows for XP-EHH scores for the pygmies using local reference populations (see Table S3). iHS percentages of shared windows among populations are shown in Table 1. Enrichment Analyses. We first subjected the results of the top 1% iHS and XP-EHH signals to enrichment analysis of Gene Ontology (GO) terms using a modified algorithm in DAVID (Huang et al. 2009), exploring the functional annotation of the 200-kb windows that were used in selection scanning. In order to avoid biases due to physical clustering of functionally related genes (Lee and Sonnhammer 2003; Huang et al. 2009), in these analyses the GO terms that appeared twice or more per window when found associated with different genes were considered only once in our analyses (see Table S11). Enrichment analysis was done per window. We applied hypothesis-free enrichment analysis on the outliers of the iHS and XP-EHH scans for positive selection in different pygmy groups, looking for enrichment of GO terms. We also performed targeted searches for genes previously associated with height in nonpygmy populations, development of sexual characteristics, thermoregulation, GH/IGF pathway, and thyroid function (see Tables S4–S7 and S12 for gene lists). For genes included in the lists for each category, see the Appendix. Calculating Enrichment. For all pygmy and nonpygmy populations included in the iHS and XP-EHH analysis, we used Fisher’s exact test (Fisher 1922) to perform searches for gene enrichment of GO terms and the targeted gene lists on all genes in the top 1% windows of the iHS and XP-EHH test statistic distributions. We tested for enrichment of windows rather than genes associated with each of the phenotypes of interest; we used windows in order to correct for positional clustering (Huang et al. 2009). Top 20 Signals Analyses. We manually checked all genes present in the windows with the top 20 signals for the iHS and XP-EHH analyses (Tables S8–S10) and their association with the phenotypes of interest. Analyses of SNPs Associated with Height Variation. In a recent meta-analysis of genome-wide association studies of a combined 183,727 individuals, 180
260 /
MIGLIANO ET AL.
genetic loci were reported to influence adult height (Lango Allen et al. 2010). Of these, 51 were directly genotyped in our data, and for another 91 markers we were able to find a proxy SNP on the basis of LD with the height-associated marker (r2 = 0.8) using SNAP tool (www.broadinstitute.org/mpg/snap/). We grouped all pygmy samples in the Philippines as one group, and all pygmy samples in Papua New Guinea into another group, and compared them with local nonpygmy groups. For each group we determined allele frequencies and genotype counts using PLINK. We used Fisher’s exact test and the chi-square test to assess whether negrito and non-negrito groups differ in allele frequencies at the 142 height-associated loci (Table S13).
Results and Discussion Pygmy Populations Have Independent Evolutionary Histories in Each Continent. In order to assess the genetic relatedness of Asian, Melanesian, and African pygmy populations, we surveyed the genome-wide SNP variation in 111 pygmies (from the seven pygmy populations) and 730 nonpygmy samples using principal component analysis (PCA). A plot of the first two principal components shows clustering of individuals according to their geographic origin (Figure 2a). All pygmy groups cluster with nonpygmies in their geographic region: the Aeta, Batak, and Agta from the Philippines cluster with other Southeast Asians, and the Kosipe and Koinambe pygmies cluster with other Papuans and Island Melanesians. We further assessed the population structure (Figure 2b) of the pygmy groups against global reference populations using the ADMIXTURE approach (see Appendix) (Alexander et al. 2009). African and Asian pygmies are separated already at K = 2, along with their taller neighboring populations. At K = 4 and K = 5, Papuan and Philippine clusters, respectively, are distinguished from continental Asians, again with no discrete distinction between neighboring pygmy and nonpygmy groups. However, nonpygmy groups from the Philippines consistently show higher frequency of the mainland Asian ancestry component than do the three Philippine pygmy populations. Despite their isolation and small population sizes, the Aeta, Batak, and Agta show genomic heterozygosity values similar to other populations in East Asia (data not shown). From K = 8 to K = 10 (Figure 2b), a separation emerges between the Philippine Aeta and Batak, where both groups are characterized by an ancestry component dominant in, but not restricted to, either of the populations. This is consistent with the fact that Aeta and Batak inhabit different islands in the Philippines (Luzon and Palawan, respectively). In contrast, the Agta (inhabiting the opposite extreme of Luzon Island from the Aeta), who were undistinguishable from the Batak until K = 7, do not acquire a largely population-specific ancestry component. Instead, starting from K = 8, their ancestry palette consists of roughly 45% Aeta, 25% Batak, and 25% continental Asian ancestry components. The nonpygmy Filipinos show somewhat different
Evolution of the Pygmy Phenotype / 261 Table 1. Percentage of Shared Windows in the Top 1% and 5% Tails of the XP-EHH and iHS Distributions among Populations 1% XP-EHH
5% a
Aeta pygmies Batak pygmies Han/Cambodians Koinambe pygmies PNG nonpygmies Biaka pygmies Mbuti pygmies IHS
Aeta pygmies Batak pygmies Han + Cambodians Koinambe + Kosipe Papuans + PNG Biaka Mbuti Bantus + Mandenkas + Yorubas (BMY)
AETA
BATAK
HAN/CAM
KOI
PAPUANS
BIAKA
MBUTI
0.54
0.57 0.66
0.28 0.25 0.21
0.31 0.28 0.26 0.66
0.05 0.07 0.05 0.09 0.07
0.08 0.05 0.04 0.10 0.07 0.26
0.57 0.54 0.25 0.32 0.10 0.05
0.61 0.32 0.26 0.12 0.12
0.23 0.23 0.09 0.11
0.68 0.07 0.07
0.07 0.07
0.19
AETA
BATAK
HAN/CAM
KOI/KOS
PAPUANS
BIAKA
MBUTI
BMY
0.11
0.07 0.11
0.04 0.04 0.07
0.10 0.07 0.11 0.44
0.04 0.10 0.07 0.17 0.12
0.07 0.09 0.10 0.07 0.02 0.08
0.04 0.08 0.08 0.13 0.09 0.11 0.10
0.04 0.06 0.07 0.08 0.07 0.06
0.12 0.04 0.08 0.04 0.09
0.11 0.11 0.15 0.11
0.38 0.09 0.06
0.10 0.10
.018
0.03
0.06
0.12
0.08
0.10
0.10
0.11
Papuans + PNG = combined Papua New Guinea nonpygmies. a XP-EHH values were calculated using African reference group, including HGDP data for Yoruba, Mandenka, and Bantu samples.
combinations of same three ancestral components. It is notable that the pairwise genome-wide FST genetic distance between the Aeta and Batak (0.092) is greater than that between the Biaka and Mbuti African pygmies (0.051) and comparable to differences between West and East Eurasian populations, such as French versus Han Chinese (FST = 0.10; see Table S2). In Papua New Guinea, the genetic distances between populations, regardless of their average height, are less pronounced (all FST < 0.06) than in the Philippines. Despite the fact that the two pygmy groups are phenotypically similar and speak languages of the same linguistic family (see Appendix and Table S1), Koinambe pygmies are more closely related to their nonpygmy neighbors (Figure 2a, Table S2) than to Kosipe pygmies. The FST distances we observe between Philippine and New Guinean pygmies (0.18–0.19) are comparable to the lower range of differences seen between African and non-African populations. Overall, these results suggest that African, Philippine, and Papuan pygmies are genetically more similar to their taller neighboring populations than they are to one another and that there is no detectable ancestry component that might relate
Figure 2. Genetic distances between pygmies and their geographic neighbors. (A, this page) PCA analysis showing genetic distance of different pygmies and nonpygmies worldwide. (B, opposite page) ADMIXTURE analysis showing pygmies in the context of their neighboring populations.
A
262 / MIGLIANO ET AL.
B
Evolution of the Pygmy Phenotype / 263
264 /
MIGLIANO ET AL.
pygmy populations across broad geographic regions. Within different continents, the pattern of genetic differentiation between pygmies and nonpygmies is variable—greatest in the Philippine Aeta and Batak (discrimination at K = 5 in the ADMIXTURE analysis), followed by African pygmies (K = 7), and undetectable in Melanesia (up to K = 10). These analyses were based on summary genome-wide analyses of total genetic similarities. However, it is possible that pygmy populations across the world might share signs of a unique common ancestry in just a few genes that underlie their short stature. Alternatively, the genetic basis of short stature in pygmies might be explained by convergent evolution at many height-related genes. We therefore went on to explore whether there is any evidence for signals of positive selection (selective sweeps) being shared between different pygmy populations. Genetically Distinct Pygmy Populations from Africa, Asia, and Melanesia Share Fewer Positive Selection Signals with Each Other Than with Their Geographic Neighbors. We used two long-range haplotype methods for detecting partial (iHS) (Voight et al. 2006) and complete selective sweeps (XPEHH) (Sabeti et al. 2006) to assess whether different pygmy groups share signatures of recent positive selection in similar parts of the genome (see Table S1 and Appendix for population descriptions). XP-EHH uses a reference population (see Appendix for further discussion), which allowed us to employ different references to infer the adaptive trajectory of the various pygmy groups. Percentages of genomic windows that are shared among these populations are shown in Table 1. As expected from their more recent population divergence, groups outside Africa share more than 20% of complete sweep signals (Table 1). Nevertheless, Asian and Papuan pygmies do not share more windows with each other than with nonpygmy groups. For instance, the Aeta and Batak each share more windows with the Han Chinese/Cambodian sample than between themselves. Since the XP-EHH method is designed to identify signals of complete selective sweeps, which can persist for tens of thousands of years, the high level of sharing outside Africa may partly result from selective sweeps in the ancestral Asian population. The fact that most of the top 20 XP-EHH signals observed in the Aeta, Batak, and Koinambe pygmies occur as top 5% signals in their neighbors (Table S7) suggests that no major selection signals are uniquely shared between pygmy populations in different continents. Therefore, using a distantly related African population as the reference group might not be sufficiently sensitive to reveal local adaptations in Southeast Asian and Papuan pygmies. In order to differentiate between such ancestral processes and selection that might be specific to pygmy groups, we also calculated the XP-EHH scores for the pygmies outside Africa using their most closely related nonpygmy groups as reference populations (i.e., Han Chinese/Cambodians for the Aeta and Batak, and Papuan nonpygmies for the Koinambe pygmies; Table S10). These local comparisons are likely to reveal complete selective sweeps that occurred more recently, after the separation of pygmies and nonpygmies in each geographic region. We observed only a small proportion of selection signals being shared between the Aeta and
Evolution of the Pygmy Phenotype / 265
Batak (23–25%; Table S3), despite their similar phenotypes and environment. This result reinforces the findings from our ADMIXTURE analysis and suggests that these two populations have experienced long-term independent demographic and adaptive histories. In terms of partial selective sweeps, the top iHS signals (Table 1) show very little top 1% versus top 5% signal sharing between pygmy groups across continents, typically less than 10%. Within continents, shared signals among pygmies are only slightly greater than between continents, with the highest value of 18% observed between the Mbuti and Biaka. Comparing the extent of shared selection signals between pygmy groups within a region and between pygmies and their neighbors reveals the highest shared signal among Papuan pygmy and nonpygmy groups. These results again complement those of the PCA and ADMIXTURE analyses by suggesting a recent common adaptive history of all the Papuan populations studied here, independent of their body size. The fact that pygmies do not share more signals of positive selection among themselves than with nonpygmy populations suggests that, despite their overall phenotypic similarity, adaptation in each pygmy population could be the result of selection acting on different genes. Pygmies in Africa, Asia, and Melanesia Have Different Genes under Selection Associated with Similar Phenotypes. We first subjected the results of the top 1% iHS and XP-EHH signals to enrichment analysis of GO terms using a modified DAVID algorithm that circumvents gene clustering problem by considering the 200-kb windows rather than genes as units of enrichment analyses (see Appendix for details). Consistent with previous reports on global populations (Herráez et al. 2009), we found that terms related to immunity, neural development, and metabolic processes are enriched in several pygmy groups, albeit with minimal overlap of specific enriched GO terms. Previous study has found genes related to reproduction and steroid hormone synthesis to be enriched in western pygmies (Jarvis et al. 2012). East African and Papuan pygmies both show significant enrichment of terms related to sexual development and reproduction, while Papuan pygmies also show enrichment of terms related to growth (Table S11). These GO terms bear relevance to the evolutionary hypotheses that have been proposed to explain pygmy height. In order to investigate the selective forces that may have been particularly likely to lead to short stature, we examined in detail allelic differentiation and enrichment of genes associated with the relevant phenotypes (among the strongest signatures of selection of genes in the pygmies). We have tested for enrichment of genes previously associated (in Europeans and Asians) with height variation, growth (genes of the GH/IGF pathways), sexual development and puberty (to account for the possibility that short stature in pygmies could be a by-product of selection for early reproduction), thyroid function, and thermoregulation (see Tables S4–S7 for gene lists). We tested each population of pygmies for enrichment of windows (genomic 200-kb windows) containing genes associated with the relevant
266 /
MIGLIANO ET AL.
phenotypes (growth, sexual development, thyroid function, thermoregulation, and height). We analyzed windows containing SNPs significantly associated with these phenotypes, represented in the top 1% tail of distributions for iHS and XP-EHH tests. In the case of XP-EHH, we used regional nonpygmy populations as reference groups (see Appendix for descriptions of reference populations). Genes Related to Height, Growth, and Thyroid Function. The combined frequency of the common alleles at 31 loci associated with height variation in Europeans (Aulchenko et al. 2009) does not differentiate pygmies from their nonpygmy neighbors (Figure 3). The Philippine Aeta appear genotypically as the shortest population analyzed, while African Biaka pygmies carry one of the world’s highest frequency of the “tall” alleles. These results are consistent with those of Pickrell et al. (2009) and Jarvis et al. (2012), who failed to find an enrichment of SNPs with high FST between Bantus and West African pygmies among the loci associated with height variation in Europe. Our analyses of 142 loci associated with height variation in the GIANT consortium data (Lango Allen et al. 2010) revealed 32 SNPs in Philippines and 10 SNPs in Papua New Guinea with significant allele frequency differences (p < 0.05) between negrito and non-negrito groups (Table S13). Considering the observed allele frequency differences at other loci across the genome, however, these results do not indicate enrichment but, rather, the existence of population structure: when taking random sets of 142 markers over the genome for Philippine pygmy and nonpygmy groups, 55.3% of the time we observed 32 or more SNPs with p-values < 0.05. If using more stringent threshold of p < 1 × 10⁻⁵, two height-associated markers passed the threshold, but again, by random sampling of the genome we observed two or more low p-value markers in 14.7% of the tests. Also, the number of markers at which pygmies had lower frequency of the taller height-associated allele did not differ significantly from the opposite case (Table S13). Although several height genes appeared among the top 20 selection hits in pygmy groups (e.g., ZFAT was the second strongest iHS signal among Papuan pygmies), the combined set of 180 genomic loci associated with height variation in either European or Asian populations (Table S4) did not appear significantly enriched in our scans of positive selection in any of the pygmy populations. Furthermore, the loci that appeared in the top 1% of the selection signals in individual pygmy groups did not show any overlaps across populations (Table 2). These results indicate that the set of common SNPs currently believed to determine (an admittedly small fraction of) height heritability (Lango Allen et al. 2010; Aulchenko et al. 2009; Shriner et al. 2009; Okada et al. 2010; Yang et al. 2010) has contributed only weakly—if at all—to the evolution of short stature in pygmy populations worldwide. Furthermore, they suggest that any such potential contributions of these small effects have affected different genes in different pygmy groups. In spite of not finding genes significantly explaining height differences between pygmies and their nonpygmy neighbors, ADMIXTURE results indicate that adult height is heritable in the Philippine pygmies, as Becker et al. (2011) found
Evolution of the Pygmy Phenotype / 267
Figure 3. Combined frequency (%) in pygmy and nonpygmy populations of the “tall” allele of 31 SNPs associated with height variation. The 31 SNPs for which the genotype data were available for given populations and their tall versus short height-associated allele assignments were taken from Aulchenko et al. (2009). Pygmy populations in the present study are shown in light gray.
for African pygmies. Our results show that individuals with higher proportions of Asian ancestry (nonpygmy neighbors) are significantly taller than individuals with higher proportions of “negrito” ancestry (Figure 4). The proportion of “negrito ancestry” estimated using ADMIXTURE (yellow component in K = 5) significantly explains 49.6% and 49.8% of the height variability of women and men, respectively, in our Philippine samples (Figure 4c), while the proportion of “Asian ancestry” (orange component in K = 8) explains 35.7% and 45.5% of the adult height variation in men and women, respectively (data not shown). Therefore, a small number of genes with major effects may be involved in the evolution of extreme short stature in pygmies. Notably, in the case of the Aeta, two genes among the top 20 iHS signals have been implicated in pathological syndromes causing dwarfism: mutations in the RNU4ATAC gene are a cause of microcephalic osteodysplastic primordial dwarfism type 1 (He et al. 2011), and disruptions in NAALADL2 have been associated with Amsterdam dwarfism (Tonkin et al. 2004). Other such largeeffect genes in the GH/IGF signaling pathways (Table S12) have already been implicated in the pygmy phenotype. Low serum levels of GH/IGF-pathway proteins have been observed in Philippine (Davila et al. 2002), Papuan (Davila et al. 2002),
HEIGHT VARIATION (TABLE S4,
iHS data. XP-EHH data (using continental reference populations).
a
b
CLPBb
PLCG1b
SHH,a BCL2L11,b NOBOXb
rs6569648,a rs6473015,a rs6714546b
Mbuti, Democratic Republic of Congo
SULT1B1,b TRIP4,b CREB1b
IGF2R,a GHITMb
AGTR1,a SOD2,a TNFRSF11A,a ECE1,a AVPR1Ab
NR4A3,b MED30,b FOXE1b
PDGFRA,a MAS1a
rs4665736,a rs806794,a rs9456307b
Biaka, Central African Republic
RPS6KA1b
JAK2,a CSNK2A2b
KCNMA1,a GUCY1A3,b CSDA,b NRIP1b KCNJ8,a PTGS1,b CACNA1Cb
GH/IGF (TABLE S12, 71 WINDOWS)
TRPA1,a CIRBP,b GCLCb
LHCGR,a IMMP2La
DAPP1,b CSDA,b CCNE1,b COPS2b NRIP1b
THYROID FUNCTION (TABLE S6, 71 WINDOWS)
rs12680655,a rs12474201a FOXO3,b COL9A3b
rs10748128,a rs8052560,a rs2629046b rs7567288,a rs2341459,a rs17346452,a rs1325598a
180 SNPS)
RESPONSE TO THERMAL STIMULUS AND THERMOREGULATION (TABLE S7, 282 WINDOWS)
Kosipe/Koinambe, Papua New Guinea
Batak, Philippines
Aeta, Philippines
PYGMY POPULATION
DEVELOPMENT OF SEXUAL CHARACTERISTICS AND AGE OF SEXUAL MATURATION (TABLE S5, 194 WINDOWS)
Table 2. Top 1% iHS and XP-EHH Signals in Pygmies Related to Height, Thermoregulation, Thyroid Function, Sexual Development, and GH/IGF axis.
268 / MIGLIANO ET AL.
Evolution of the Pygmy Phenotype / 269
and African pygmies and are associated in the latter with the absence of adolescent growth spurt (Merimee et al. 1987). Baka and Biaka pygmies show low levels of serum GH binding protein, IGF-1, and GH receptor protein after puberty (Merimee et al. 1987; Bozzola et al. 2009). Jarvis et al. (2012) found SNPs near genes in the IGF-1 pathway to be under selection in western African pygmies. Our analysis of pygmy versus nonpygmy FST differences shows that, although there is no general overrepresentation of genes of the GH/IGF axis under selection in pygmies, there are a few genes with alleles that are highly differentiated between pygmy groups and their nonpygmy neighbors. These include GHRHR in the Mbuti, IGF2R and IGF2BP2 in the Biaka, IGF2BP3 in both the Aeta and Batak, and CSNK2A1 in both Koinambe and Biaka (Figure 5). Our selection analyses (iHS and XP-EHH) show that some of these genes have been the focus of natural selection in pygmies (Table 2). For instance, the IGF2R gene is among the top 20 iHS windows in the Biaka (Table S9), and other GH/IGF genes appear in the top 1% of different pygmy groups (Table 2), such as RPS6KA1 in the Aeta, JAK2 and CSNK2A2 in the Papuan pygmies, PLCG1 in the Mbuti, and GHITM in the Biaka. In the context of our results on population histories presented above, this indicates that different genes in the GH/IGF pathway may be involved in the convergent evolution of extreme short stature in pygmy populations in different continents. Convergent evolution of short stature within Africa is supported by anatomic differences between western and eastern pygmies (Rozzi and Sardi 2010). However, given that differences in caloric intake, regulation of timing of growth cessation, and timing of growth spurts are all regulated by alterations in the GH/IGF axis, it is not possible to infer from these results exactly which phenotypes have been the targets of selection. Genes involved in the thyroid hormone pathway (TRIP4, IYD) have similarly been identified among the primary signals of selection in Biaka and Mbuti pygmies (Herráez et al. 2009). Herráez et al. (2009) suggested that selection on these genes in African pygmies is the result of a nutritional iodine deficiency in tropical forests, which leads to short stature. We therefore tested genes involved in thyroid function for enrichment in each of the pygmy populations (using genes from 71 genomic loci; Table S7). Three thyroid function genes were found both in Biaka and Mbuti XP-EHH top 1% lists, but in neither population was the enrichment significant, nor did the two pygmy populations share the same genes. Interestingly, the topmost XP-EHH signal in Biaka (Table S8) mapped to one of thyroid function genes, FOXE1. Batak and Koinambe pygmies showed no thyroid function genes in their top 1% of either selection tests, and only one gene was observed in case of the Aeta (Table 2). These results indicate that thyroid-related hormones might play a role in determining pygmies’ stature but, also, that this effect may be largely limited to African pygmies. As with the GH/IGF pathway, thyroid hormones are involved in diverse metabolic processes, such as directly regulating growth during adolescence (Gothe et al. 1999), regulating heat production and thermoregulation (Beard et al. 1990), and regulating the timing of puberty and lactation (Anasti et al. 1995). These
270 /
A
B
MIGLIANO ET AL.
Evolution of the Pygmy Phenotype / 271
C
Figure 4. Correlation between “pygmy ancestry” proportion and adult height in the Philippine populations. (A, opposite) The percentage of “pygmy ancestry proportion” in each of the Philippine pygmy (Aeta, Batak, and Agta) and nonpygmy (Tagbanua, Zambales, and Casiguran) populations was estimated using ADMIXTURE (K = 5) (yellow component). (B, opposite) Average proportions of K = 4 component per population. NAN, NAN Melanesian. (C, above) Correlation between individual adult height and K = 5 ancestry component for men (blue; n = 43, r = 0.706, r2 = 0.498, p < 0.001) and women (green; n = 27, r = 0.704, r2 = 0.496, p < 0.001).
results shed light upon possible genetic mechanisms leading to the evolution of short stature in pygmies. In order to explore further the possible selective pressures behind these genetic mechanisms, we tested enrichment in selection analyses for genes that are directly related to thermoregulation and sexual development. Thermoregulation-Related Genes. No significant enrichment was found in any of the pygmy groups for genes involved in thermoregulation (282 genomic loci were included in the test; Table S6). Among the top 20 signals (Tables S8– S10), we observed two thermoregulation genes (MSTN and FOCS2) in Batak and
272 /
MIGLIANO ET AL.
Figure 5. FST values for genes of the GH/IGF pathways for pygmies in relation to their nonpygmy neighbors. Maximum pairwise FST values of 200-kb windows containing GH/IGF gene products previously associated (Table S12) with short stature (black circles) and other GH/IGF genes (gray circles) are shown on the background of the empirical genome-wide distribution of FST in the given population pairs (bars). The two dashed lines indicate the cutoff points of the 5% and 1% tails of the empirical distribution.
Evolution of the Pygmy Phenotype / 273
one gene (PPARA) in the Aeta (also ranking third in Koinambe) as the topmost XP-EHH genes. The CLPB gene ranked second in Mbuti and Biaka pygmies, and other genes associated with thermoregulation appear in the top 1% signals of the selection analyses (Table 2, Table S8). Selection Acting on Genes Related to Sexual Development. We tested for enrichment of genes implicated in the development of primary and secondary sexual characteristics and puberty in the top 1% tail of the selection analyses for all pygmy groups (a total of 194 genomic windows with relevant GO term association were included; Table S5). None of the populations showed significant enrichment; however, in the XP-EHH scans that used African references (Table S8), two top 20 hits at sexual development windows were shared by at least two pygmy groups—one at the progesterone receptor gene in Aeta and Batak, and the DMRT1 and DMRT3 genes shared by Aeta, Batak, and Kosipe/Koinambe. The DMRT1 gene guards the male testis cells from differentiation into female cells, and DMRT3 regulates transcription during sexual development (Matson and Zarkower 2012). In iHS and XP-EHH scans on local references, we observed selection signals at 13 additional genes related to sexual development, but each signal occurred in only one pygmy population. These results reinforce the results of the general analysis for GO terms, which showed significant enrichment for sexual development and reproduction in both Papuan and Mbuti (East Africa) pygmies. Our results also agree with Jarvis at al. (2012) and Lachance et al. (2012), who found that genes involved in neuroendocrine signaling pathways related to reproduction were the only pathway enriched in selection analyses for the western African pygmy population. One gene previously associated with age at menarche, DAPP1 (Liu et al. 2009; Ong et al. 2009), is also found in the top 1% of selection signals in the Aeta. Thus, genes involved in sexual development are enriched in two pygmy groups (Mbuti and Koinambe; Table S11), and similar results have previously been found in a third pygmy population (Baka, Bakola, and Bedzan combined samples from Cameroon; Jarvis et al. 2012), which offer some support to the hypothesis (although more evidence is needed) that short stature in pygmy populations might have evolved as a consequence of selection for other phenotypes. Finally, a few other results and caveats from the selection scans deserve attention. First, the top 20 strongest signals for the selection analyses in different pygmy groups present regions of the genome that are not known to contain protein-coding genes; some of these regions are shared among different populations (Tables S8 and S9). The functional significance of such regions has yet to be determined. Second, sharing in the top 20 signals among different pygmy groups is rare, but some important patterns are revealed: CSMD1, an important regulator of inflammation of the nervous systems and epithelial tissues (Kraus et al. 2006), appears among the top 20 iHS signals in the Aeta, Biaka, and Mbuti, and in the XP-EHH analysis using continental reference for all pygmy groups (Tables S9 and S10). CDC42SE2, involved in immunological synapses (Chen et al. 2006), was among the top 20 iHS
274 /
MIGLIANO ET AL.
signals in both Mbuti and Biaka, and CRHR2, which plays an important role in coordinating endocrine and behavioral responses to stress and immune challenges (Refojo et al. 2011), was among the top 20 XP-EHH signals in the Batak and among the top 1% in the Aeta. Third, many different genes involved in immune response, such as cytokines, appear individually among the top 20 signals in different pygmy groups. Sharing of important immunity genes in the top 20 signals among different pygmy groups across continents suggests that immunity-related genes might have been important in the evolution of the pygmy phenotype, due to either living in high-mortality environments (Migliano et al. 2007), or trade-offs between immunity and growth (Jarvis et al. 2012).
Conclusions The foremost finding from this study is the very low overlap of genes under selection among different groups of pygmies, even within continents. This result indicates that if the phenotype evolved under positive selection, the targeted genes were different in each population. We therefore conclude that, even within geographic regions—for example, in Africa (Mbuti and Biaka) or the Philippines (Aeta and Batak)—the evolution of the human pygmy phenotype has occurred in a convergent manner. If the pygmy phenotype evolved in a convergent manner, there is no clear evidence of the selective pressures involved, as the genes found to be under selection in the different populations studied here are likely to be involved in different pathways and phenotypes. However, as Jarvis et al. (2012) found for western African pygmies, we found significant enrichment for genes related to sexual development and reproduction in both Papuan and Mbuti (eastern African) pygmies. These findings suggest that the short stature of different pygmies in West and East Africa and Papua New Guinea might have evolved as a by-product of selection for fast life histories in these populations (Migliano et al. 2007). We were able to detect only weak evidence for selection on genes associated with height variation in pygmy populations, leading to the conclusion that these genes are unlikely to explain short stature in different pygmy populations in Africa, Asia, and Oceania. Classical explanations for pygmies’ short stature such as locomotion in closed forests and thermoregulation (Cavalli-Sforza 1986; Turnbull 1986) imply direct selection for short stature. The lack of enrichment for height-related genes indicates that short stature among pygmies is more likely to be a by-product of other biological processes. Pygmies in different continents are exposed to high loads of infectious diseases and thus have very high mortality rates (Migliano et al. 2007); therefore, trade-offs between immunity responses and growth would be expected (Jarvis et al. 2012). Different immunity-related genes appear in our top 20 selection signals for all pygmy groups, offering some support to this hypothesis. However, because targets of selection from standing variation, polygenic adaptations, and older selective processes (>40 kya) are difficult to identify (Pritchard and Di Rienzo 2010; Sabeti et al. 2007), we cannot discard
Evolution of the Pygmy Phenotype / 275
the possibility that other biological processes involved in the evolution of pygmy phenotype were not identified in this study because of current methodological limitations. Finally, this work does not cover the possibility that small body size is an ancestral trait in all populations that left Africa (in which case, selection scans would not detect any signal).
Supplementary Tables. Supplementary Tables S1–S13 are available at www.ucl.ac.uk/ anthropology/people/academic_staff/a_migliano. Funding. This project was funded by a Clare College fellowship, a Newnham Gibbs travel fellowship, and the Leverhulme Programme Grant/Hunter-Gatherers Resilience to A.B.M.; a Natural Environment Research Council (NERC)/Environmental Factors in the Chronology of Human Evolution and Dispersal Programme (EFCHED) grant to M.M.L.; the E.U. European Regional Development Fund through the Centre of Excellence in Genomics and Estonian Basic Research grant SF0182474 to R.V.; and Tartu University grant PBGMR06901 to T.K. Acknowledgments. We thank all the participants in this study who donated their DNA; the National Commission on Indigenous Peoples and Department of Environment and Natural Resources in the Philippines; the National Research Institute in Papua New Guinea; Lilia Dagsaan, Herman Manduy, and Jim Robins for fieldwork support; and J. C. J. Barna and the University of Cambridge School of the Biological Sciences Computing Facility for help in computational analyses.
Received 21 September 2012; revision accepted for publication 30 April 2013.
Literature Cited Alexander, D. H., J. Novembre, and K. Lange. 2009. Fast model-based estimation of ancestry in unrelated individuals. Genome Res. 19:1,655–1,664. Amselem, S., P. Duquesnoy, O. Attree et al. 1989. Laron dwarfism and mutations of the growth hormone-receptor gene. N. Engl. J. Med. 321:989–995. Anasti, J. N., M. R. Flack, J. Froehlich et al. 1995. A potential novel mechanism for precocious puberty in juvenile hypothyroidism. J. Clin. Endocrinol. Metab. 80:276–279. Aulchenko, Y. S., M. V. Struchalin, N. M. Belonogova et al. 2009. Predicting human height by Victorian and genomic methods. Eur. J. Hum. Genet. 17:1070–1075. Ayling, R. M., R. Ross, P. Towner et al. 1997. A dominant-negative mutation of the growth hormone receptor causes familial short stature. Nat. Genet. 16:13–14. Batini, C., J. Lopes, D. M. Behar et al. 2011. Insights into the demographic history of African pygmies from complete mitochondrial genomes. Mol. Biol. Evol. 28:1,099–1,110. Beard, J. L., M. J. Borel, and J. Derr. 1990. Impaired thermoregulation and thyroid function in irondeficiency anemia. Am. J. Clin. Nutr. 52:813–819. Becker, N. S., P. Verdu, A. Froment et al. 2011. Indirect evidence for the genetic determination of short stature in African pygmies. Am. J. Phys. Anthropol. 145:390–401.
276 /
MIGLIANO ET AL.
Behar, D. M., B. Yunusbayev, M. Metspalu et al. 2010. The genome-wide structure of the Jewish people. Nature 466:238–242. Bluthgen, N., K. Brand, B. Cajavec et al. 2005. Biological profiling of gene groups utilizing Gene Ontology. Genome Inform. 16:106–115. Bozzola, M., P. Travaglino, N. Marziliano et al. 2009. The shortness of pygmies is associated with severe under-expression of the growth hormone receptor. Mol. Genet. Metab. 98:310–313. Browning, S. R., and B. L. Browning. 2007. Rapid and accurate haplotype phasing and missing-data inference for whole-genome association studies by use of localized haplotype clustering. Am. J. Hum. Genet. 81:1,084–1,097. Cariño, J. K. 2012 Country technical notes on Indigenous People’s issues: Republic of the Philippines. International Fund for Agricultural Development. www.ifad.org/english/indigenous/pub/documents/tnotes/philippines.pdf. Cavalli-Sforza, L. L. 1986. African Pygmies. New York: Academic Press. Chen, X., X. Wang, S. Hossain et al. 2006. Haplotypes spanning SPEC2, PDZ-GEF2 and ACSL6 genes are associated with schizophrenia. Hum. Mol. Genet. 15:3,329–3,342. Chen, Y., F. Cunningham, D. Rios et al. 2010. Ensembl variation resources. BMC Genomics 11:293. Cioffi, F., R. Senese, P. de Lange et al. 2009. Uncoupling proteins: A complex journey to function discovery. Biofactors 35:417–428. Davila, N., B. T. Shea, K. Omoto et al. 2002. Growth hormone binding protein, insulin-like growth factor-I and short stature in two pygmy populations from the Philippines. J. Pediatr. Endocrinol. Metab. 15:269–276. Diamond, J. M. 1991. Why are pygmies small? Nature 354:111–112. Domené, H. M., S. V. Bengolea, H. G. Jasper et al. 2005 Acid-labile subunit deficiency: Phenotypic similarities and differences between human and mouse. J. Endocrinol. Invest. 28:43–46. Early, J. D., and T. N. Headland. 1998. Population Dynamics of a Philippine Rain Forest People: The San Ildefonso Agta. Gainesville: University Press of Florida. Eder, J. F. 1987 On the Road to Tribal Extinction: Depopulation, Deculturation, and Adaptive WellBeing among the Batak of the Philippines. Berkeley: University of California Press. Endicott, P., M. Gilbert, C. Stringer et al. 2003. The genetic origins of the Andaman Islanders. Am. J. Hum. Genet. 72:178–184. Falush, D., M. Stephens, and J. K. Pritchard. 2003. Inference of population structure using multilocus genotype data: Linked loci and correlated allele frequencies. Genetics 164:1,567–1,587. Fang, P., D. Schwartz, B. D. Johnson et al. 2009. Familial short stature caused by haploinsufficiency of the insulin-like growth factor I receptor due to nonsense-mediated messenger ribonucleic acid decay. J. Clin. Endocrinol. Metab. 94:1,740–1,747. Fisher, R. A. 1922. On the Interpretation of X2 from contingency tables and the calculation of P. J. R. Stat. Soc. 85:87. Fofanova-Gambetti, O. V., V. Hwa, S. Kirsch et al. 2009. Three novel IGFALS gene mutations resulting in total ALS and severe circulating IGF-I/IGFBP-3 deficiency in children of different ethnic origins. Horm. Res. 71:100–110. Frazer, K., A. D. G. Ballinger, D. R. Cox et al. 2007. A second generation human haplotype map of over 3.1 million SNPs. Nature 449:851–861. Frederich, R. C., B. Löllmann, A. Hamann et al. 1995. Expression of ob mRNA and its encoded protein in rodents. Impact of nutrition and obesity. J. Clin. Invest. 96:1,658–1,663. Friedlaender, J. S., F. R. Friedlaender, F. A. Reed et al. 2008. The genetic structure of Pacific Islanders. PLoS Genet. 4:e19. Godowski, P. J., D. W. Leung, L. R. Meacham et al. 1989. Characterization of the human growth hormone receptor gene and demonstration of a partial gene deletion in two patients with Laron-type dwarfism. Proc. Natl. Acad. Sci. USA 86:8,083–8,087. Gothe, S., Z. Wang, L. Ng et al. 1999. Mice devoid of all known thyroid hormone receptors are viable but exhibit disorders of the pituitary-thyroid axis, growth, and bone maturation. Genes Dev. 13:1,329–1,341.
Evolution of the Pygmy Phenotype / 277 Hancock, A. M., D. B. Witonsky, A. S. Gordon et al. 2008. Adaptations to climate in candidate genes for common metabolic disorders. PLoS Genet. 4:e32. He, H., L. Liyanarachchi L., K. Akagi et al. 2011. Mutations in U4atac snRNA, a component of the minor spliceosome, in the developmental disorder MOPD I. Science 332:238–240. Herráez, L. D., M. Bauchet, K. Tang et al. 2009. Genetic variation and recent positive selection in worldwide human populations: evidence from nearly 1 million SNPs. PLoS One 4:e7888. Heyer, E., M. Georges, M. Pachner, and P. Endicott. 2013. Genetic diversity of four Filipino negrito populations from Luzon: Comparison of male and female effective population sizes and differential integration of immigrants in Aeta and Agta communities. Hum. Biol. 85:189–208. Holmes, R., R. Montemagno, J. Jones et al. 1997. Fetal and maternal plasma insulin-like growth factors and binding proteins in pregnancies with appropriate or retarded fetal growth. Early Hum. Dev. 49:7–17. Hondares, E., M. Rosell, F. J. Gonzalez et al. 2010. Hepatic FGF21 Expression is induced at birth via PPARa in response to milk intake and contributes to thermogenic activation of neonatal brown fat. Cell Metab. 11:206–212. Hosack, D. A., G. Dennis, B. T. Sherman et al. 2003. Identifying biological themes within lists of genes with EASE. Genome Biol. 4:R70. Huang, D. W., W. B. T. Sherman, and R. A. Lempicki. 2009. Systematic and integrative analysis of large gene lists using DAVID bioinformatics resources. Nat. Protoc. 4:44–57. Hubisz, M. J., D. Falush, M. Stephens et al. 2009 Inferring weak population structure with the assistance of sample group information. Mol. Ecol. Resources 9:1,322–1,332. HUGO Pan-Asian SNP Consortium. 2009. Mapping human genetic diversity in Asia. Science 326:1,541–1,545. Hwa, V., G. Haeusler, K. L. Pratt et al. 2006. Total absence of functional acid labile subunit, resulting in severe insulin-like growth factor deficiency and moderate growth failure. J. Clin. Endocrinol. Metab. 91:1,826–1,831. Jarvis, J. P., L. B. Scheinfeldt., S. Soi et al. 2012 Patterns of ancestry, signatures of natural selection, and genetic association with stature in western African pygmies. PLoS Genet. 8:e1002641. Jinam, T. A., L. C. Hong, M. E. Phipps et al. 2012. Evolutionary history of continental South East Asians: “Early train” hypothesis based on genetic analysis of mitochondrial and autosomal DNA data. Mol. Biol. Evol. 29:3,513–3,527. Kajimura, S., P. Seale, and B. M. Spiegelman. 2010. Transcriptional control of brown fat development. Cell Metab. 7:257–262. Kofoed, E. M., V. Hwa, B. Little et al. 2003 Growth hormone insensitivity associated with a STAT5b mutation. N. Engl. J. Med. 349:1,139–1,147. Kraus, D. M., G. S. Elliott, H. Chute et al. 2006. CSMD1 is a novel multiple domain complementregulatory protein highly expressed in the central nervous system and epithelial tissues. J. Immunol. 176:4,419–4,430. Lachance, J., B. Vernot, C. C. Elbers et al. 2012. Evolutionary history and adaptation from highcoverage whole-genome sequences of diverse African hunter-gatherers. Cell 150:457–469. Lango Allen, H. L., K. Estrada, G. Lettre et al. 2010. Hundreds of variants clustered in genomic loci and biological pathways affect human height. Nature 467:832–838. Lee, J. M., and E. L. L. Sonnhammer. 2003. Genomic gene clustering analysis of pathways in eukaryotes. Genome Res. 13:875–882. Lewis, M. P. 2009. Ethnologue: Languages of the World. Dallas, TX: SIL International. Li, J. Z., D. M. Absher, H. Tang et al. 2008. Worldwide human relationships inferred from genomewide patterns of variation. Science 319:1,100–1,104. Liu, Y. Z., Y. F. Guo, L. Wang et al. 2009. Genome-wide association analyses identify SPOCK as a key novel gene underlying age at menarche. PLoS Genet. 5:e1000420. Matson, C. K., and D. Zarkower. 2012. Sex and the singular DM domain: Insights into sexual regulation, evolution and plasticity. Nat. Rev. Genet. 13:163–174.
278 /
MIGLIANO ET AL.
Merimee, T. J., J. Zapf, and B. Hewlett. 1987. Insulin-like growth factors in pygmies. The role of puberty in determining final stature. N. Engl. J. Med. 316:906–911. Migliano, A. B., L. Vinicius, and M. M. Lahr. 2007. Life history trade-offs explain the evolution of human pygmies. Proc. Natl. Acad. Sci. USA 104:20,216–20,219. Nei, M. 1978. Estimation of average heterozygosity and genetic distance from a small number of individuals. Genetics 89:583–590. Okada, Y., Y. Kamatani, A. Takahashi et al. 2010. A genome-wide association study in 19 633 Japanese subjects identified LHX3-QSOX2 and IGF1 as adult height loci. Hum. Mol. Genet. 19:2,303–2,312. Ong, K. K., C. E. Elks, S. Li et al. 2009. Genetic variation in LIN28B is associated with the timing of puberty. Nat. Genet. 41:729–733. Patin, E., G. Laval, L. B. Barreiro et al. 2009. Inferring the demographic history of African farmers and pygmy hunter-gatherers using a multilocus resequencing data set. PLoS Genet. 5:e1000448. Patterson, N., A. L. Price, and D. Reich. 2006. Population structure and eigenanalysis. PLoS Genet. 2:e190. Perry, G. H., and N. J. Dominy. 2009. Evolution of the human pygmy phenotype. Trends Ecol. Evol. 24:218–225. Petkovic, V., M. Godi, A. V. Pandey et al. 2010. Growth hormone (GH) deficiency type II: A novel GH-1 gene mutation (GH-R178H) affecting secretion and action. J. Clin. Endocrinol. Metab. 95:731–739. Phillips, J. A., III, B. L. Hjelle, P. H. Seeburg et al. 1981. Molecular basis for familial isolated growth hormone deficiency. Proc. Natl. Acad. Sci. USA 78:6,372–6,375. Pickrell, J. K., G. Coop, J. Novembre et al. 2009. Signals of recent positive selection in a worldwide sample of human populations. Genome Res. 19:826–837. Pritchard, J. K., and A. Di Rienzo. 2010. Adaptation—not by sweeps alone. Nat. Rev. Genet. 11:665– 667. Pritchard, J. K., M. Stephens, and P. Donnelly. 2000. Inference of population structure using multilocus genotype data. Genetics 155:945–959. Purcell, S., B. Neale, K. Todd-Brown et al. 2007. PLINK: A tool set for whole-genome association and population-based linkage analyses. Am. J. of Hum. Genet. 81:559–575. Rasmussen, M., X. Guo, Y. Wang et al. 2011. An Aboriginal Australian genome reveals separate human dispersals into Asia. Science 334:94–98. Rasmussen, M., Y. Li, S. Lindgreen et al. 2010. Ancient human genome sequence of an extinct PalaeoEskimo. Nature 463:757–762. Refojo, D., M. Schweizer, C. Kuehne et al. 2011. Glutamatergic and dopaminergic neurons mediate anxiogenic and anxiolytic effects of CRHR1. Science 333:1,903–1,907. Reich, D., K. Thangaraj, N. Patterson et al. 2009. Reconstructing Indian population history. Nature 461:489–494. Rosenberg, N. A., J. K. Pritchard, J. L. Weber et al. 2002. Genetic structure of human populations. Science 298:2,381–2,385. Rozzi, F. V. R., and M. L. Sardi. 2010. Diversity among African pygmies. PLoS One 5:e13620. Sabeti, P. C., S. F. Schaffner, B. Fry et al. 2006. Positive natural selection in the human lineage. Science 312:1,614–1,620. Sabeti, P. C., P. Varilly, B. Fry et al. 2007. Genome-wide detection and characterization of positive selection in human populations. Nature 449:913–918. Scholes, C., K. Siddle, A. Ducourneau et al. 2011. Genetic diversity and evidence for population admixture in Batak negritos from Palawan. Am. J. Phys. Anthropol. 146:62–72. Shea, B. T., and R. C. Bailey. 1996. Allometry and adaptation of body proportions and stature in African pygmies. Am. J. Phys. Anthropol. 100:311–340. Shriner, D., A. Adeyemo, N. P. Gerry et al. 2009. Transferability and fine-mapping of genome-wide associated loci for adult height across human populations. PLoS One 4:e8398.
Evolution of the Pygmy Phenotype / 279 Tang, H., J. Peng, P. Wang et al. 2005. Estimation of individual admixture: Analytical and study design considerations. Genet. Epidemiol. 28:289–301. Thangaraj, K., G. Chaubey, T. Kivisild et al. 2005. Reconstructing the origin of Andaman Islanders. Science 308:996. Tonkin, E. T., M. Smith, P. Eichhorn et al. 2004. Giant novel gene undergoing extensive alternative splicing is severed by a Cornelia de Lange-associated translocation breakpoint at 3q26.3. Hum. Genet. 115:139–148. Turnbull, C. M. 1986. Survival factors among Mbuti and other hunters of the equatorial rain forest. In African Pygmies, L. L. Cavalli-Sforza, ed. New York: Academic Press, 103–123. Verdu, P., F. Austerlitz, A. Estoup et al. 2009. Origins and genetic diversity of pygmy hunter-gatherers from western Central Africa. Curr. Biol. 19:312–318. Vogel, A. A. 1953. Papuans and Pygmies. New York: Roy Publishers. Voight, B. F., S. Kudaravalli, X. Wen et al. 2006. A map of recent positive selection in the human genome. PLoS Biol. 4:e72. Wajnrajch, M. P., J. M. Gertner, A. S. Sokoloff et al. 2003. Haplotype analysis of the growth hormone releasing hormone receptor locus in three apparently unrelated kindreds from the Indian subcontinent with the identical mutation in the GHRH receptor. Am. J. Med. Genet. 120A:77–83. Walenkamp, M. J. E., M. Karperien, A. M. Pereira et al. 2005. Homozygous and heterozygous expression of a novel insulin-like growth factor-I mutation. J. Clin. Endocrinol. Metab. 90:2,855–2,864. Walenkamp, M. J. E., H. J. van der Kamp, A. M. Pereira et al. 2006. A variable degree of intrauterine and postnatal growth retardation in a family with a missense mutation in the insulin-like growth factor I receptor. J. Clin. Endocrinol. Metab. 91:3,062–3,070. Watanabe, M., S. M. Houten, C. Mataki et al. 2006. Bile acids induce energy expenditure by promoting intracellular thyroid hormone activation. Nature 439:484–489. Weir, B. S., and C. C. Cockerham. 1984. Estimating F-statistics for the analysis of population structure. Evolution 38:1,358–1,370. Williamson, R. W. 1912. The Mafulu: Mountain People of British New Guinea. San Francisco: Macmillan. Woods, K., C. Camacho-Hubner, M. Savage et al. 1996. Intrauterine growth retardation and postnatal growth failure associated with deletion of the insulin-like growth factor I gene. N. Engl. J. Med. 335:1,363–1,367. Yang, J., B. Benyamin, B. P. McEvoy et al. 2010. Common SNPs explain a large proportion of the heritability for human height. Nat. Genet. 42:565–569.
Appendix Populations Included in the Study and Sampling Strategy. Southeast Asian pygmies have been much less studied than African pygmies, and there are still many questions regarding their genetic affinities, biology, and adaptations. The Philippines. Philippine pygmies are a minority group: they represent only 3% of the 120 tribal groups; the other 97% are phenotypically Asians (like the other 72 million Philippine nontribal people) and subsist on agriculture, unlike the pygmies, who are hunter-gatherers (NCIP; Cariño 2012). Despite the distinctive phenotype of the Philippine pygmies, some degree of admixture with other tribes has existed for a long time (Eder 1987; Early and Headland 1998). Three groups of pygmies from the Philippines were included in the analyses: the Aeta, the Batak, and the Agta.
280 /
MIGLIANO ET AL.
• The Aeta. The Aeta are hunter-gatherers living in the area of Zambales, in the southwest of Luzon Island (15°16ʹN 120°05ʹE; Figure 1), and they speak Zambal, an Austronesian language. The number of Aeta living today is estimated to be somewhere between 5,000 and 8,000 people (Migliano et al. 2007). The Aeta included in this study are from four different villages in the mountains of Castilleros, Iba, and San Marcelino municipalities in Zambales. The average height was 149.5 ± 5.2 cm for men (n = 134) and 139.6 ± 5.2 cm for women (n = 79). The number of genotyped samples was 35; 31 samples were used for admixture analyses, and 22 for selection scans (see Table S1 for further information) • The Batak. The Batak are hunter-gatherers living in the northeast of Palawan Island (Philippines) (10°00ʹN 118°59ʹE). They speak Batak, an Austronesian language. Their environment did not change drastically this century; however, they are demographically a very small group: around 200 people (Migliano et al. 2007). The Batak have a recent history of intermarrying with the Tagbanua tribe (a phenotypically “Asian” group), due to their demographic decrease (NCIP; Cariño 2012). The Batak included in this study come from three different communities from Puerto Princesa and Roxas municipalities. The average height was 153.6 ± 4.4 cm for men (n = 33) and 144 ± 5.1 cm for women (n = 26). The number of genotyped samples in this study was 33; 26 samples were used for the ADMIXTURE analyses, and 15 for the selection scans (see Table S1 for further information). • The Agta. The Agta in this study are hunter-gatherers from the San Idefonso Peninsula in the Casiguran municipality of Aurora Province (northeast of Luzon, 16°08ʹN 122°04ʹE). The Agta population in the peninsula is estimated in 600; they speak Agta, an Austronesian language (Early and Headland 1998). The average height was 153.62 ± 6.8 cm for men (n = 20) and 142 ± 4.5 cm for women (n = 33). Only three individuals were genotyped in this study, so the Agta we included in the ADMIXTURE analyses but not in the selection scans (see Table S1 for further information). Papua New Guinea • Koinambe. The expedition to Koinambe village in 2008 had as its main objective to find the Suitani pygmies described by Vogel (1953). They are small-scale horticulturalists and speak Kalam and Maring languages (TransNew Guinea family). To find them, we followed the original route and map described by Vogel. In the location where these pygmies were first found, there is now the Koinambe mission (Figure 1), which we used as a base for visiting the villages nearby (05°29ʹN 144°35ʹE). The villages around the mission in the lower Jimi River area were inhabited by pygmies (see Table S1 for phenotype description), and villages in the middle and upper Jimi River were inhabited by taller peoples. The whole lower Jimi area had an estimated 18,000 people, although not all of them were pygmies. The main
Evolution of the Pygmy Phenotype / 281
pygmy villages in the region spoke Kalam (Lewis 2009), a language of the Western Highlands branch of the Trans-New Guinea family, although some of the villages, farther up the valley toward the provincial border with Madang, spoke Maring, a language also from the Western Highlands branch of the Trans-New Guinea family that is spoken more widely (Lewis 2009). These pygmies are particularly short compared with nearby populations: the average height was 152.4 ± 5.9 cm for men (n = 66) and 145.2 ± 5.2 cm for women (n = 50). We genotyped 15 individuals, and 11 were used for all the analysis; for selection analyses the Koinambe were grouped with the Kosipe (see Table S1 for further information). • Kosipe. The first described group of pygmies in the Goilala District of the highlands of Central Province was the Mafulu (Fuyege speakers) (Williamson 1912). Kosipe Mission and its surrounding villages, close to the described location where Williamson studied the Mafulu people, are inhabited by Fuyege and Tauade speakers both from the Goilalan branch of the Trans-New Guinea family (Lewis 2009). They are small-scale horticulturalists. Sampling included members of the two linguistic groups, as they intermarried and inhabited the same villages. Kosipe people had taller average heights than the other pygmies included in this study: 156.2 ± 5.3 for men (n = 41) and 149.1 ± 5.4 cm for women (n = 56). However, these averages are compatible with Williamson’s (1912) description and shorter than the nonpygmy groups (see Table S1). Five samples were genotyped and used for the ADMIXTURE analyses. For selection analyses, because of sample sizes, Kosipe and Koinambe were grouped (see Table S1 for further information). Sampling permits. Permits for sampling in Papua New Guinea were obtained from the National Research Institute. Permits for the Philippine samples were obtained from the NCIP. The sampling methods were in accordance with the ethical regulations of the respective governmental institutions and were approved by the institutions committees. Samples were obtained after informed consent. Samples from the HGDP-CEPH Cell Line Panel. From the 938 unrelated individuals of the 51 global populations in the HGDP-CEPH panel included in Li et al. (2008) analyses, 38 populations (728 individuals) were selected to represent the relevant world regions. The American populations were excluded because they are not relevant to the analysis; the Makrani from Pakistan were excluded because of their admixture with Africans; the Kalash from Pakistan were also removed because of the small population size and increased drift; some Europeans (Sardinians and Basques) and some Siberian Mongols (Hezhen, Mongols, Daur, Oroqen, and Tu) were excluded to reduce overrepresented numbers of Europeans and Asians in the analyses. The HGDP-CEPH panel include two groups of pygmies, the Biaka (western Africa) and the Mbuti (eastern Africa), which are used in the comparisons with pygmies outside of Africa.
282 /
MIGLIANO ET AL.
Appendix Materials and Methods Genotyping and quality control. We used PLINK version 1.05 (Purcell et al. 2007) for data management and quality control. In addition to minor allele frequency filter (1%), samples and SNPs with success rates below 97% were removed. Because background LD can distort both PCA (Patterson et al. 2006) and structure-like analysis (Alexander et al. 2009) results, one member of any pair of SNPs in strong LD (r2 > 0.4) in windows of 200 SNPs (sliding the window by 25 SNPs at a time) was removed using the indep-pairwise routine in PLINK. Principal component analyses (PCA). We used the smartpca routine with standard settings of the Eigensoft package (Purcell et al. 2007) to identify the first 10 principal components. The first two principal components were most informative (explaining 6% and 4.4% of the variation defined as the ratio of the respective eigenvalues to the sum of all eigenvalues) in the global context and were plotted using MS Excel. Heterozygosity. The negative correlation between genetic distance from Africa and average number of heterozygotes has implications for the interpretation of FST values, where lower within-population diversity (lower heterozygosity) will lead to an apparent higher regional differentiation (pairwise FST distances), even if the populations within regions are closely related (Friedlaender et al. 2008). Selection estimations. For iHS, ancestral and derived states for each SNP were established by comparison with the UCSC snp128OrthoPanTro2RheMac2 table. Where the chimpanzee allele was known, it was taken to be the ancestral allele; where the allele was unknown (17,868 SNPs, 3.36% of the data), the SNP was excluded from all downstream calculations. Windows were ranked as described in Pickrell et al. (2009), and the top 1% and 5% outliers for each comparison were examined as detailed below. We chose not to merge any adjacent outlier windows, because this procedure can significantly affect the final ranking of windows (data not shown). Enrichment analyses. Enrichment analysis was done per window, not per gene, because we compared the number of windows supporting GO terms. The number of background windows was defined by all the windows for which we were able to calculate the statistic. We used the DAVID (Huang et al. 2009) p-value, also called the EASE score (Hosack et al. 2003), which is a modified Fisher exact p-value. In short, it penalizes (subtracts) the count of positive agreement by 1. The EASE score is offered as a simple conservative adjustment to the Fisher exact probability that weights significance in favor of terms supported by more genes. Therefore, it improves the family-wise true discovery rate as a whole, particularly excluding ones coming from skewed/extreme cases. We preferred the EASE score to using
Evolution of the Pygmy Phenotype / 283
multiple test corrections because some enrichment studies (Bluthgen et al. 2005) have noted that applying the traditional multiple test correction techniques may not improve specificity as much as previously believed (Huang et al. 2009). In fact, the sensitivity (type II error) may actually be negatively affected because of the conservative nature of these corrections. In order to understand what types of genes (related to which phenotypes) have been affected by positive selection in different pygmy populations and the selective forces leading to short stature in pygmy groups, we analyzed genes under selection in the different groups and their association with phenotypes of interest (height, thermoregulation, and life history). We specifically looked for genes previously associated with height in nonpygmy populations (to check whether height itself was selected for), development of sexual characteristics (to check whether short stature in pygmies would be a by-product of selection for early reproduction), thermoregulation (to check whether small body size is one of the adaptations related to thermoregulation), genes of the GH/IGF pathway (to cover genes of major effect on height previously associated with pygmy short stature), and genes associated with thyroid function (also previously associated with pygmies short stature) (see Tables S4–S7 and S12 for gene lists). • Gene list for height. We used gene list derived from Lango Allen et al. (2010) study (Table S4). • Gene list for sexual development. We used reference groups GO:0045137 and GO:0045136 associated with development of primary and secondary sexual characteristics, respectively. A total of 179 genes appeared under at least one of these terms and were included in the list; a few other genes have been associated with variation in timing of puberty in Europeans (Ong et al. 2009) and age at menarche (Liu et al. 2009) and were also included in the enrichment analyses (see Table S5). • Gene list for thermoregulation. Different processes are involved in thermoregulation. We compiled a list of 228 genes (289 genomic windows) involved in thermoregulation using the following terms from Online Mendelian Inheritance in Man (OMIM) and AmiGO databases (version 1.8): (a) response to temperature stimulus, GO:0009266 (97 genes); (b) temperature homeostasis, GO:0001659 (29 genes); (c) regulation of blood vessel size, GO:0050880 (81 genes); and (d) brown adipose tissue related to thermogenesis (51 genes) (Cioffi et al. 2009; Frederich et al. 1995; Hancock et al. 2008; Hondares et al. 2010; Kajimura et al. 2010; Watanabe et al. 2006) (Table S6). • Gene list for thyroid function. Different processes related to thyroid function where compiled using the following terms from AmiGO (version 1.8) and OMIM: (a) thyroid hormone receptor binding, GO:0046966; (b) thyroid hormone generation, GO:0006590; (c) thyroid-stimulating hormone receptor activity, GO:0004996; (d) thyroid hormone metabolic process, GO:0042403; (e) thyroid hormone binding, GO:0070324; (f) thyroid hormone synthesis, transport of thyroxine; (g) thyroid hormone receptors and receptor associated
284 /
MIGLIANO ET AL.
proteins; and (h) deiodinases. A total of 58 genes (71 windows) were included in the analyses (Table S7). • Gene list for GH/IGF pathway. Genes previously associated with short stature from the GH/IGF pathway (10 genes) (Amselem et al. 1989; Godowski et al. 1989; Ayling et al. 1997; Holmes et al. 1997; Walenkamp et al. 2005; Woods et al. 1996; Phillips et al. 1981; Petkovic et al. 2010; Wajnrajch et al. 2003; Domené et al. 2005; Hwa et al. 2006; Fofanova-Gambetti et al. 2009; Walenkamp et al. 2006; Fang et al. 2009; Kofoed et al. 2003) and all other genes from the GH/IGF pathway (50 genes) were included in the analyses (Table S12). Calculating enrichment. We performed searches for gene enrichment for GO terms and the other gene lists on all genes in the top 1% windows of the iHS and XP-EHH test statistic distributions using the Fisher exact test (Fisher 1922), for all pygmy and nonpygmy populations included in the iHS and XP-EHH analyses. We tested for enrichment of windows rather than genes associated with each of the phenotypes of interest; we used windows, in order to correct for positional clustering (Lee and Sonnhammer 2003) (see Table 2). Top 20 signals analyses We manually checked all genes present in the windows with the top 20 signals for the iHS and XP-EHH analysis (Tables S8 to S10), and their association with the phenotypes of interest. GH/IGF pathway analyses. Pairwise FST between populations for all autosomal SNPs was calculated as described in Weir and Cockerham (1984). FST distributions for all autosomal SNPs are plotted in Figure 5, in different graphs for each of the pygmy group, which plots the FST values for genes from the GH/IGF pathways in each pygmy population over the overall genome-wide distribution of FST in the given population. The distribution of FST values associated with the GH/IGF pathway did not differ from the overall distribution for all other autosomal SNPs; however, a few genes from the GH/IGF pathway presented high FST values in more than one pygmy group (Figure 5).