Computer Engineering and Networks Laboratory ... multiobjective evolutionary
algorithms and their application to system design problems in computer ...
Institut für Technische Informatik und Kommunikationsnetze Computer Engineering and Networks Laboratory
TIK-SCHRIFTENREIHE NR. 30
Eckart Zitzler
Evolutionary Algorithms for Multiobjective Optimization: Methods and Applications
Eidgenössische Technische Hochschule Zürich Swiss Federal Institute of Technology Zurich
A dissertation submitted to the Swiss Federal Institute of Technology Zurich for the degree of Doctor of Technical Sciences Diss. ETH No. 13398 Prof. Dr. Lothar Thiele, examiner Prof. Dr. Kalyanmoy Deb, co-examiner Examination date: November 11, 1999
Abstract Many real-world problems involve two types of problem difficulty: i) multiple, conflicting objectives and ii) a highly complex search space. On the one hand, instead of a single optimal solution competing goals give rise to a set of compromise solutions, generally denoted as Pareto-optimal. In the absence of preference information, none of the corresponding trade-offs can be said to be better than the others. On the other hand, the search space can be too large and too complex to be solved by exact methods. Thus, efficient optimization strategies are required that are able to deal with both difficulties. Evolutionary algorithms possess several characteristics that are desirable for this kind of problem and make them preferable to classical optimization methods. In fact, various evolutionary approaches to multiobjective optimization have been proposed since 1985, capable of searching for multiple Paretooptimal solutions concurrently in a single simulation run. However, in spite of this variety, there is a lack of extensive comparative studies in the literature. Therefore, it has remained open up to now: • whether some techniques are in general superior to others, • which algorithms are suited to which kind of problem, and • what the specific advantages and drawbacks of certain methods are. The subject of this work is the comparison and the improvement of existing multiobjective evolutionary algorithms and their application to system design problems in computer engineering. In detail, the major contributions are: • An experimental methodology to compare multiobjective optimizers is developed. In particular, quantitative measures to assess the quality of trade-off fronts are introduced and a set of general test problems is defined, which are i) easy to formulate, ii) represent essential aspects of real-world problems, and iii) test for different types of problem difficulty. • On the basis of this methodology, an extensive comparison of numerous evolutionary techniques is performed in which further aspects such as the influence of elitism and the population size are also investigated. • A novel approach to multiobjective optimization, the strength Pareto evolutionary algorithm, is proposed. It combines both established and new techniques in a unique manner. • Two complex multicriteria applications are addressed using evolutionary algorithms: i) the automatic synthesis of heterogeneous hardware/systems and ii) the multidimensional exploration of software implementations for digital signal processors.
Zusammenfassung Viele praktische Optimierungsprobleme sind durch zwei Eigenschaften charakterisiert: a) mehrere, teilweise im Konflikt stehende Zielfunktionen sind involviert, und b) der Suchraum ist hochgradig komplex. Einerseits f¨uhren widerspr¨uchliche Optimierungskriterien dazu, dass es statt eines klar definierten Optimums eine Menge von Kompromissl¨osungen, allgemein als Pareto-optimal bezeichnet, gibt. Insofern keine Gewichtung der Kriterien vorliegt, m¨ussen die entsprechenden Alternativen als gleichwertig betrachtet werden. Andererseits kann der Suchraum eine bestimmte Gr¨osse und Komplexit¨at u¨ berschreiten, so dass exakte Optimierungsverfahren nicht mehr anwendbar sind. Erforderlich sind demnach effiziente Suchstrategien, die beiden Aspekten gerecht werden. Evolution¨are Algorithmen sind aufgrund mehrerer Merkmale f¨ur diese Art von Problem besonders geeignet; vor allem im Vergleich zu klassischen Methoden weisen sie gewisse Vorteile auf. Doch obwohl seit 1985 verschiedenste evolution¨are Ans¨atze entwickelt wurden, die mehrere Pareto-optimale L¨osungen in einem einzigen Simulationslauf generieren k¨onnen, mangelt es in der Literatur an umfassenden Vergleichsstudien. Folglich blieb bislang ungekl¨art, • ob bestimmte Techniken anderen Methoden generell u¨ berlegen sind, • welche Algorithmen f¨ur welche Art von Problem geeignet sind und • wo die spezifischen Vor- und Nachteile einzelner Verfahren liegen. Die vorliegende Arbeit hat zum Gegenstand, bestehende evolution¨are Mehrzieloptimierungsverfahren zu vergleichen, zu verbessern und auf Entwurfsprobleme im Bereich der Technischen Informatik anzuwenden. Im Einzelnen werden folgende Themen behandelt: • Eine Methodik zum experimentellen Vergleich von Mehrzieloptimierungsverfahren wird entwickelt. Unter anderem werden quantitative Qualit¨atsmasse f¨ur Mengen von Kompromissl¨osungen eingef¨uhrt und mehrere Testfunktionen definiert, die a) eine einfache Problembeschreibung besitzen, b) wesentliche Merkmale realer Optimierungsprobleme repr¨asentieren und c) erlauben, verschiedene Einflussfaktoren separat zu u¨ berpr¨ufen. • Auf der Basis dieser Methodik wird ein umfangreicher Vergleich diverser evolution¨arer Techniken durchgef¨uhrt, wobei auch weitere Aspekte wie die Auswirkungen von Elitism und der Populationsgr¨osse auf den Optimierungsprozess untersucht werden. • Ein neues Verfahren, der Strength-Pareto-Evolutionary-Algorithm, wird vorgestellt. Es kombiniert auf spezielle Art und Weise bew¨ahrte und neue Konzepte miteinander. • Zwei komplexe Mehrzielprobleme werden auf der Basis evolution¨arer Methoden untersucht: a) die automatische Synthese von heterogenen Hardware/Software-Systemen und b) die mehrdimensionale Exploration von Softwareimplementierungen f¨ur digitale Signalverarbeitungsprozessoren.
I would like to thank Prof. Dr. Lothar Thiele for the valuable discussions concerning this research, Prof. Dr. Kalyanmoy Deb for his willingness to be the co-examiner of my thesis, and Michelle Stubbs for the careful English proofreading.
Contents List of Acronyms
1
List of Symbols
3
1 Introduction 1.1 Multiobjective Optimization . . . . . . . 1.1.1 Basic Concepts and Terminology 1.1.2 Search and Decision Making . . . 1.2 Traditional Approaches . . . . . . . . . . 1.2.1 Weighting Method . . . . . . . . 1.2.2 Constraint Method . . . . . . . . 1.2.3 Discussion of Classical Methods . 1.3 Evolutionary Algorithms . . . . . . . . . 1.4 Overview . . . . . . . . . . . . . . . . .
I
. . . . . . . . .
. . . . . . . . .
. . . . . . . . .
. . . . . . . . .
. . . . . . . . .
. . . . . . . . .
. . . . . . . . .
. . . . . . . . .
. . . . . . . . .
. . . . . . . . .
. . . . . . . . .
. . . . . . . . .
Methods
2 Evolutionary Algorithms for Multiobjective Optimization 2.1 Basic Principles of Evolutionary Algorithms . . . . . . . . . . . 2.2 Key Issues in Multiobjective Search . . . . . . . . . . . . . . . 2.2.1 Fitness Assignment and Selection . . . . . . . . . . . . 2.2.2 Population Diversity . . . . . . . . . . . . . . . . . . . 2.2.3 Elitism . . . . . . . . . . . . . . . . . . . . . . . . . . 2.3 Overview of Evolutionary Techniques . . . . . . . . . . . . . . 2.3.1 Schaffer’s Vector Evaluated Genetic Algorithm . . . . . 2.3.2 Hajela and Lin’s Weighting-based Genetic Algorithm . . 2.3.3 Fonseca and Fleming’s Multiobjective Genetic Algorithm 2.3.4 Horn, Nafpliotis, and Goldberg’s Niched Pareto Genetic Algorithm . . . . . . . . . . . . . . . . . . . . . . 2.3.5 Srinivas and Deb’s Nondominated Sorting Genetic Algorithm . . . . . . . . . . . . . . . . . . . . . . . . . . 2.4 Strength Pareto Evolutionary Algorithm . . . . . . . . . . . . . 2.4.1 Fitness Assignment . . . . . . . . . . . . . . . . . . . . 2.4.2 Reducing the Nondominated Set by Clustering . . . . .
5 5 5 9 11 11 11 12 13 15
17 19 20 22 23 24 26 27 27 29 30 30 31 32 34 36
viii
Contents
2.5
Universal Elitism Scheme . . . . . . . . . . . . . . . . . . . . . 39
3 Comparison of Selected Evolutionary Approaches 3.1 Performance Measures . . . . . . . . . . . . . . . . 3.1.1 Related Work . . . . . . . . . . . . . . . . . 3.1.2 Scaling-Independent Measures . . . . . . . . 3.1.3 Scaling-Dependent Measures . . . . . . . . . 3.2 Methodology . . . . . . . . . . . . . . . . . . . . . 3.2.1 Selection and Fitness Sharing . . . . . . . . 3.2.2 Elitism . . . . . . . . . . . . . . . . . . . . 3.2.3 Reference Algorithms . . . . . . . . . . . . 3.2.4 Performance Assessment . . . . . . . . . . . 3.3 Multiobjective Knapsack Problem . . . . . . . . . . 3.3.1 Problem Statement . . . . . . . . . . . . . . 3.3.2 Test Data . . . . . . . . . . . . . . . . . . . 3.3.3 Constraint Handling . . . . . . . . . . . . . 3.3.4 Parameter Settings . . . . . . . . . . . . . . 3.3.5 Experimental Results . . . . . . . . . . . . . 3.4 Multiobjective Traveling Salesman Problem . . . . . 3.4.1 Problem Statement . . . . . . . . . . . . . . 3.4.2 Test Data . . . . . . . . . . . . . . . . . . . 3.4.3 Parameter Settings . . . . . . . . . . . . . . 3.4.4 Experimental Results . . . . . . . . . . . . . 3.5 Continuous Test Problems . . . . . . . . . . . . . . 3.5.1 Test Functions for Different Problem Features 3.5.2 Parameter Settings . . . . . . . . . . . . . . 3.5.3 Experimental Results . . . . . . . . . . . . . 3.5.4 Influence of Elitism . . . . . . . . . . . . . . 3.5.5 Influence of Population Size . . . . . . . . . 3.6 Key Results . . . . . . . . . . . . . . . . . . . . . .
. . . . . . . . . . . . . . . . . . . . . . . . . . .
. . . . . . . . . . . . . . . . . . . . . . . . . . .
. . . . . . . . . . . . . . . . . . . . . . . . . . .
. . . . . . . . . . . . . . . . . . . . . . . . . . .
. . . . . . . . . . . . . . . . . . . . . . . . . . .
. . . . . . . . . . . . . . . . . . . . . . . . . . .
41 42 42 43 45 46 47 47 47 48 48 48 49 49 50 50 55 55 55 55 57 57 57 60 60 65 67 69
II Applications
71
4 System Synthesis 4.1 Problem Description . . . . . . . . . . . . . . . . . . . . . 4.1.1 Specification Model . . . . . . . . . . . . . . . . . 4.1.2 Implementation Model . . . . . . . . . . . . . . . . 4.1.3 Optimization Task . . . . . . . . . . . . . . . . . . 4.2 Implementation . . . . . . . . . . . . . . . . . . . . . . . . 4.2.1 Representation and Genetic Operators . . . . . . . . 4.2.2 Fitness Assignment and Selection . . . . . . . . . . 4.3 Case Study: Video Codec . . . . . . . . . . . . . . . . . . . 4.3.1 Comparison of Three Evolutionary Techniques . . . 4.3.2 Trading-Off Cost, Latency, and Power Consumption
73 73 73 75 76 76 76 77 79 79 80
. . . . . . . . . .
. . . . . . . . . .
Contents
ix
5 Software Synthesis 5.1 Synchronous Data Flow . . . . . . . . . . . . . . . . . . . . . . 5.1.1 Background and Notation . . . . . . . . . . . . . . . . 5.1.2 Implementation Model . . . . . . . . . . . . . . . . . . 5.2 Minimizing Data Memory Requirements . . . . . . . . . . . . . 5.2.1 Problem Statement . . . . . . . . . . . . . . . . . . . . 5.2.2 Implementation . . . . . . . . . . . . . . . . . . . . . . 5.2.3 Comparing the Evolutionary Algorithm and Other Optimization Methods . . . . . . . . . . . . . . . . . . . . 5.3 Trading-off Execution Time and Memory Requirements . . . . . 5.3.1 Problem Statement . . . . . . . . . . . . . . . . . . . . 5.3.2 Implementation . . . . . . . . . . . . . . . . . . . . . . 5.3.3 Case Study: Sample Rate Conversion . . . . . . . . . . 5.3.4 Comparing Two Evolutionary Multiobjective Optimizers 5.4 Summary . . . . . . . . . . . . . . . . . . . . . . . . . . . . .
85 86 86 88 92 93 93 94 97 98 98 100 106 107
6 Conclusions 109 6.1 Fundamental Results . . . . . . . . . . . . . . . . . . . . . . . 109 6.2 Future Perspectives . . . . . . . . . . . . . . . . . . . . . . . . 110 Bibliography
113
x
Contents
List of Acronyms APGAN BTTA CDPPO DM DSP FFGA GDPPO HC HLGA MOEA MOP NPGA NSGA PDSP RAND RAPGAN REFS RPMC SDF SO-1 SO-2 SO-5 SOP SPEA SP-S VEGA
acyclic pairwise grouping of adjacent nodes Blicke, Teich, and Thiele’s multiobjective evolutionary algorithm code-size dynamic programming post optimization decision maker digital signal processing Fonseca and Fleming’s multiobjective genetic algorithm generalized dynamic programming post optimization hill climbing Hajela and Lin’s weighting-based genetic algorithm multiobjective evolutionary algorithm multiobjective optimization problem Horn, Nafpliotis, and Goldberg’s niched Pareto genetic algorithm Srinivas and Deb’s nondominated sorting genetic algorithm programmable digital signal processor random search algorithm randomized APGAN reference set recursive partitioning by minimum cuts synchronous data flow single-objective EA (100 generations per run) single-objective EA (250 generations per run) single-objective EA (500 generations per run) single-objective optimization problem strength Pareto evolutionary algorithm strength Pareto evolutionary algorithm with restricted selection Schaffer’s vector evaluated genetic algorithm
List of Symbols σmate σshare C d(ii , j ) e f f F(ii ) I k m m (ii ) n N N A) p(A P P pc pm S T tdom X Xf Xp Y Yf Yp
mating radius niche radius performance metric (coverage) distance between individual i and individual j vector of constraints of an SOP or MOP objective function of an SOP vector of objective functions of an MOP fitness value assigned to individual i ∈ I individual space number of objective functions of an MOP number of constraints of an SOP or MOP gives the decision vector encoded by individual i ∈ I number of decision variables of an SOP or MOP population size maximum size of the external nondominated set set of decision vectors in A nondominated regarding A population external nondominated set crossover probability mutation rate performance metric (size of the dominated space) maximum number of generations domination pressure decision space set of feasible decision vectors set of Pareto-optimal decision vectors objective space set of objective vectors corresponding to X f set of objective vectors corresponding to X p
1 Introduction Almost every real-world problem involves simultaneous optimization of several incommensurable and often competing objectives. While in single-objective optimization the optimal solution is usually clearly defined, this does not hold for multiobjective optimization problems. Instead of a single optimum, there is rather a set of alternative trade-offs, generally known as Pareto-optimal solutions. These solutions are optimal in the wider sense that no other solutions in the search space are superior to them when all objectives are considered. In this chapter, the principles of multiobjective optimization are outlined and basic concepts are formally defined. This is followed by a discussion about traditional approaches to approximate the set of Pareto-optimal solutions and in particular their potential disadvantages. Afterwards, evolutionary algorithms are presented as a recent optimization method which possesses several characteristics that are desirable for this kind of problem. The history of evolutionary multiobjective optimization is briefly outlined with special emphasis on the open questions in this research area. Finally, Section 1.4 sketches the scope of the present work and gives an overview of the remaining chapters.
1.1
Multiobjective Optimization
1.1.1
Basic Concepts and Terminology Multiobjective optimization problems (MOPs) are common. For example, consider the design of a complex hardware/software system as it can be found in mobile phones, cars, etc. Often the cost of such systems is to be minimized, while maximum performance is desired. Depending on the application, further
6
Chapter 1. Introduction
objectives may be important such as reliability and power dissipation. They can be either defined explicitly as separate optimization criteria or formulated as constraints, e.g., that the size of the system must not exceed given dimensions. Formally, this can be defined as follows.1 Def. 1:
(Multiobjective Optimization Problem) A general MOP includes a set of n parameters (decision variables), a set of k objective functions, and a set of m constraints. Objective functions and constraints are functions of the decision variables. The optimization goal is to maximize subject to where
y = f (xx ) = ( f 1 (xx ), f 2 (xx ), . . . , f k (xx )) e (xx ) = (e1 (xx ), e2 (xx ), . . . , em (xx )) ≤ 0 x = (x1 , x2 , . . . , xn ) ∈ X y = (y1 , y2 , . . . , yk ) ∈ Y
(1.1)
and x is the decision vector, y is the objective vector, X is denoted as the decision space, and Y is called the objective space. The constraints e (xx ) ≤ 0 determine the set of feasible solutions. Def. 2:
(Feasible Set) The feasible set X f is defined as the set of decision vectors x that satisfy the constraints e (xx ) : X f = {xx ∈ X | e (xx ) ≤ 0 }
(1.2)
The image of X f S , i.e., the feasible region in the objective space, is denoted as X f ) = x ∈XX f { f (xx )}. Y f = f (X Without loss of generality, a maximization problem is assumed here. For minimization or mixed maximization/minimization problems the definitions presented in this section are similar. Consider again the above example and assume that the two objectives performance ( f 1 ) and cheapness ( f 2 ), the inverse of cost, are to be maximized under size constraints (e1 ). Then an optimal design might be an architecture which achieves maximum performance at minimal cost and does not violate the size limitations. If such a solution exists, we actually only have to solve a singleobjective optimization problem (SOP). The optimal solution for either objective is also the optimum for the other objective. However, what makes MOPs difficult is the common situation when the individual optima corresponding to the distinct objective functions are sufficiently different. Then, the objectives are conflicting and cannot be optimized simultaneously. Instead, a satisfactory trade-off has to be found. In our example, performance and cheapness are generally competing: high-performance architectures substantially increase cost, while cheap architectures usually provide low performance. Depending on the market requirements, an intermediate solution (medium performance, medium cost) might be an appropriate trade-off. This discussion makes clear that a new notion of optimality is required for MOPs. 1 The definitions and terms presented in this section correspond to mathematical formulations
most widespread in multiobjective optimization literature, see, e.g., (Hwang and Masud 1979; Sawaragi, Nakayama, and Tanino 1985; Steuer 1986; Ringuest 1992).
1.1. Multiobjective Optimization
f2
7
f2 Pareto-optimal front is dominated
feasible region
E
E
A B
B indifferent
dominates D
D
C
C
f1
Fig. 1:
A
indifferent
f1
Illustrative example of Pareto optimality in objective space (left) and the possible relations of solutions in objective space (right).
In single-objective optimization, the feasible set is completely (totally) ordered according to the objective function f : for two solutions a , b ∈ X f either f (aa ) ≥ f (bb ) or f (bb ) ≥ f (aa ). The goal is to find the solution (or solutions) that gives the maximum value of f (Cohon 1985). However, when several objectives are involved, the situation changes: X f is, in general, not totally ordered, but partially ordered (Pareto 1896). This is illustrated in Figure 1 on the left. The solution represented by point B is better than the solution represented by point C: it provides higher performance at lower cost. It would be even preferable if it would only improve one objective, as is the case for C and D: despite equal cost, C achieves better performance than D. In order to express this situation mathematically, the relations =, ≥, and > are extended to objective vectors by analogy to the single-objective case. Def. 3:
For any two objective vectors u and v , u = v iff ∀ i ∈ {1, 2, . . . , k} : u i = vi u ≥ v iff ∀ i ∈ {1, 2, . . . , k} : u i ≥ vi u > v iff u ≥ v ∧ u 6 = v
(1.3)
The relations ≤ and < are defined similarly. Using this notion, it holds that B > C, C > D, and, as a consequence, B > D. However, when comparing B and E, neither can be said to be superior, since B 6 > E and E 6 > B. Although the solution associated with E is cheaper, it provides lower performance than the solution represented by B. Therefore, two decision vectors a , b can have three possibilities with MOPs regarding the ≥ relation (in contrast to two with SOPs): f (aa ) ≥ f (bb ), f (bb ) ≥ f (aa ), or f (aa ) 6 ≥ f (bb ) ∧ f (bb ) 6 ≥ f (aa ). Here, the following symbols and terms are used in order to classify the different situations.
8
Chapter 1. Introduction
Def. 4:
(Pareto Dominance) For any two decision vectors a and b , a � b (aa dominates b ) iff a � b (aa weakly dominates b ) iff a ∼ b (aa is indifferent to b ) iff
f (aa ) > f (bb ) f (aa ) ≥ f (bb ) f (aa ) 6 ≥ f (bb ) ∧ f (bb ) 6 ≥ f (aa )
(1.4)
The definitions for a minimization problem (≺, �, ∼) are analogical. In Figure 1 on the right, the light gray rectangle encapsulates the region in objective space that is dominated by the decision vector represented by B. The dark gray rectangle contains the objective vectors whose corresponding decision vectors dominate the solution associated with B. All solutions for which the resulting objective vector is in neither rectangle are indifferent to the solution represented by B. Based on the concept of Pareto Dominance, the optimality criterion for MOPs can be introduced. Still referring to Figure 1, A is unique among B, C, D, and E: its corresponding decision vector a is not dominated by any other decision vector. That means, a is optimal in the sense that it cannot by improved in any objective without causing a degradation in at least one other objective. Such solutions are denoted as Pareto optimal; sometimes also the term noninferior (Cohon 1978) is used. Def. 5:
(Pareto Optimality) A decision vector x ∈ X f is said to be nondominated regarding a set A ⊆ X f iff 6 ∃a ∈ A : a � x
(1.5)
If it is clear within the context which set A is meant, it is simply left out. Moreover, x is said to be Pareto optimal iff x is nondominated regarding X f . In Figure 1 the white points represent Pareto-optimal solutions. They are indifferent to each other. This makes the main difference to SOPs clear: there is no single optimal solution but rather a set of optimal trade-offs. None of these can be identified as better than the others unless preference information is included (e.g., a ranking of the objectives). The entirety of all Pareto-optimal solutions is called the Pareto-optimal set; the corresponding objective vectors form the Pareto-optimal front or surface. Def. 6:
A ) gives the (Nondominated Sets and Fronts) Let A ⊆ X f . The function p(A A set of nondominated decision vectors in : A ) = {aa ∈ A | a is nondominated regarding A } p(A
(1.6)
A ) is the nondominated set regarding A , the corresponding set of obThe set p(A A )) is the nondominated front regarding A . Furthermore, jective vectors f ( p(A X f ) is called the Pareto-optimal set and the set Y p = f (X X p) the set X p = p(X is denoted as the Pareto-optimal front.
1.1. Multiobjective Optimization
9
f2 global Pareto-optimal front feasible region
A local Pareto-optimal front
f1
Fig. 2:
Illustration of locally optimal solution sets and globally optimal solution sets in objective space.
The Pareto-optimal set comprises the globally optimal solutions. However, as with SOPs there may also be local optima which constitute a nondominated set within a certain neighborhood. This corresponds to the concepts of global and local Pareto-optimal sets introduced by Deb (1998, 1999a): Def. 7:
Consider a set of decision vectors A ⊆ X f .
1. The set A is denoted as a local Pareto-optimal set iff ∀ a ∈ A :6 ∃ x ∈ X f : x � a ∧ kxx − a k < � ∧ k f (xx ) − f (aa )k < δ
(1.7)
where k · k is a corresponding distance metric and � > 0, δ > 0. 2. The set A is called a global Pareto-optimal set iff ∀ a ∈ A :6 ∃ x ∈ X f : x � a
(1.8)
The difference between local and global optima is visualized in Figure 2. The dashed line constitutes a global Pareto-optimal front, while the solid line depicts a local Pareto-optimal front. The decision vectors associated with the latter are locally nondominated though not Pareto-optimal, because the solution related to point A dominates any of them. Finally, note that a global Pareto-optimal set does not necessarily contain all Pareto-optimal solutions and that every global Pareto-optimal set is also a local Pareto-optimal set. 1.1.2
Search and Decision Making In solving an MOP, two conceptually distinct types of problem difficulty can be identified (Horn 1997): search and decision making. The first aspect refers
10
Chapter 1. Introduction
to the optimization process in which the feasible set is sampled for Paretooptimal solutions. As with single-objective optimization, large and complex search spaces can make search difficult and preclude the use of exact optimization methods like linear programming (Steuer 1986). The second aspect addresses the problem of selecting a suitable compromise solution from the Pareto-optimal set. A human decision maker (DM) is necessary to make the often difficult trade-offs between conflicting objectives. Depending on how optimization and the decision process are combined, multiobjective optimization methods can be broadly classified into three categories (Hwang and Masud 1979; Horn 1997): Decision making before search: The objectives of the MOP are aggregated into a single objective which implicitly includes preference information given by the DM. Search before decision making: Optimization is performed without any preference information given. The result of the search process is a set of (ideally Pareto-optimal) candidate solutions from which the final choice is made by the DM. Decision making during search: The DM can articulate preferences during the interactive optimization process. After each optimization step, a number of alternative trade-offs is presented on the basis of which the DM specifies further preference information, respectively guides the search. The aggregation of multiple objectives into one optimization criterion has the advantage that the classical single-objective optimization strategies can be applied without further modifications. However, it requires profound domain knowledge which is usually not available. For example, in computer engineering design space exploration specifically aims at gaining deeper knowledge about the problem and the alternative solutions. Performing the search before decision making overcomes this drawback, but excludes preference articulation by the DM which might reduce the search space complexity. Another problem with this and also the third algorithm category might be the visualization and the presentation of nondominated sets for higher dimensional MOPs (Cohon 1985). Finally, the integration of search and decision making is a promising way to combine the other two approaches, uniting the advantages of both. In this thesis, the focus is on multiobjective optimization methods that are capable of 1. sampling intractably large and highly complex search spaces, and 2. generating the exact Pareto-optimal set or approximations of it. This is the the first step in the direction of decision making during search and forms the basis for further research in this area.
1.2. Traditional Approaches
1.2
11
Traditional Approaches Classical methods for generating the Pareto-optimal set aggregate the objectives into a single, parameterized objective function by analogy to decision making before search. However, the parameters of this function are not set by the DM, but systematically varied by the optimizer. Several optimization runs with different parameter settings are performed in order to achieve a set of solutions which approximates the Pareto-optimal set. Basically, this procedure is independent of the underlying optimization algorithm. Some representatives of this class of techniques are the weighting method (Cohon 1978), the constraint method (Cohon 1978), goal programming (Steuer 1986), and the minmax approach (Koski 1984). In place of the various methods, the two first mentioned are briefly discussed here.
1.2.1
Weighting Method The original MOP is converted to an SOP by forming a linear combination of the objectives: maximize y = f (xx ) = w1 · f 1 (xx ) + w2 · f 2 (xx ) + . . . + wk · f k (xx )) (1.9) subject to x ∈ X f The wi are called weights and, without loss of generality, normalized such that P wi = 1. Solving the above optimization problem for a certain number of different weight combinations yields a set of solutions. On condition that an exact optimization algorithm is used and all weights are positive, this method will only generate Pareto-optimal solutions which can be easily shown. Assume that a feasible decision vector a maximizes f for a given weight combination and is not Pareto optimal. Then, there is a solution b which dominates a , i.e., without loss of generality f 1 (bb ) > f 1 (aa ) and fi (bb ) ≥ fi (aa ) for i = 2, . . . , k. Therefore, f (bb ) > f (aa ), which is a contradiction to the assumption that f (aa ) is maximum. The main disadvantage of this technique is that it cannot generate all Paretooptimal solutions with non-convex trade-off surfaces. This is illustrated in Figure 3 based on the embedded system design example. For fixed weights w1 , w2 , solution x is sought to maximize y = w1 · f 1 (xx ) + w2 · f 2 (xx ). This equation can y 1 x be reformulated as f 2 (xx ) = − w w2 f 1 (x ) + w2 , which defines a line with slope w1 −w and intercept wy2 in objective space (solid line in Figure 3). Graphically, the 2 optimization process corresponds to moving this line upwards until no feasible objective vector is above it and at least one feasible objective vector (here A and D) is on it. However, the points B and C will never maximize f . If the slope is increased, D achieves a greater value of f (upper dotted line); if the slope is decreased, A has a greater f value than B and D (lower dotted line).
1.2.2
Constraint Method Another technique which is not biased towards convex portions of the Paretooptimal front transforms k − 1 of the k objectives into constraints. The remain-
12
Chapter 1. Introduction
f2
f2
r’ D
D
feasible
slope = -w1/w2 C
C y/w2
r
B A
B A
f1
Fig. 3:
0110 1010 infeasible
f1
Graphical interpretation of the weighting method (left) and the constraint method (right).
ing objective, which can be chosen arbitrarily, is the objective function of the resulting SOP: maximize y = f (xx ) = f h (xx ) subject to ei (xx ) = fi (xx ) ≥ �i , x ∈Xf
(1 ≤ i ≤ k, i 6 = h)
(1.10)
The lower bounds, �i , are the parameters that are varied by the optimizer in order to find multiple Pareto-optimal solutions. As depicted in Figure 3 on the right, the constraint method is able to obtain solutions associated with non-convex parts of the trade-off curve. Setting h = 1 and �2 = r (solid line) makes the solution represented by A infeasible regarding the extended constraint set, while the decision vector related to B maximizes f among the remaining solutions. Figure 3 also shows a problem with this technique. If the lower bounds are not chosen appropriately (�2 = r 0 ), the obtained new feasible set might be empty, i.e., there is no solution to the corresponding SOP. In order to avoid this situation, a suitable range of values for the �i has to been known beforehand. 1.2.3
Discussion of Classical Methods What makes traditional approaches attractive and why they are popular may be attributed to the fact that well-studied algorithms for SOPs can be used. For large-scale problems, hardly any real multiobjective optimization techniques had previously been available (Horn 1997). By contrast, in single-objective optimization a wide range of heuristic methods have been known that are capable of dealing with this complexity, e.g., random search algorithms (T¨orn and
1.3. Evolutionary Algorithms
13
ˇ Zilinskas 1989), stochastic local search algorithms (Horst and Pardalos 1995), ˇ simulated annealing (T¨orn and Zilinskas 1989), tabu search (Glover, Taillard, and de Werra 1993), etc. However, the preceding sections on weighting and constraint methods show that some difficulties may also accompany classical optimization strategies. • Some techniques, e.g., the weighting method, may be sensitive to the shape of the Pareto-optimal front. • Problem knowledge may be required which may not be available. Deb (1999b) mentions further potential problems with these approaches, i.e., application areas where their use is restricted. Moreover, classical methods all have in common that they require several optimization runs to obtain an approximation of the Pareto-optimal set. As the runs are performed independently from each other, synergies can usually not be exploited which, in turn, may cause high computation overhead. However, this again depends on the application. Recently, evolutionary algorithms have become established as an alternative to classical methods through which i) large search spaces can be handled and ii) multiple alternative trade-offs can be generated in a single optimization run. Furthermore, they can be implemented in a way such that both of the above difficulties are avoided.
1.3
Evolutionary Algorithms The term evolutionary algorithm (EA) stands for a class of stochastic optimization methods that simulate the process of natural evolution. The origins of EAs can be traced back to the late 1950s, and since the 1970s several evolutionary methodologies have been proposed, mainly genetic algorithms, evolutionary programming, and evolution strategies (B¨ack, Hammel, and Schwefel 1997). All of these approaches operate on a set of candidate solutions. Using strong simplifications, this set is subsequently modified by the two basic principles of evolution: selection and variation. Selection represents the competition for resources among living beings. Some are better than others and more likely to survive and to reproduce their genetic information. In evolutionary algorithms, natural selection is simulated by a stochastic selection process. Each solution is given a chance to reproduce a certain number of times, dependent on their quality. Thereby, quality is assessed by evaluating the individuals and assigning them scalar fitness values. The other principle, variation, imitates natural capability of creating ”new” living beings by means of recombination and mutation. Although the underlying principles are simple, these algorithms have proven themselves as a general, robust and powerful search mechanism. B¨ack, Hammel, and Schwefel (1997) argue that
14
Chapter 1. Introduction
“[. . . ] the most significant advantage of using evolutionary search lies in the gain of flexibility and adaptability to the task at hand, in combination with robust performance (although this depends on the problem class) and global search characteristics.” Moreover, EAs seem to be especially suited to multiobjective optimization because they are able to capture multiple Pareto-optimal solutions in a single simulation run and may exploit similarities of solutions by recombination. Some researchers suggest that multiobjective search and optimization might be a problem area where EAs do better than other blind search strategies (Fonseca and Fleming 1995b; Valenzuela-Rend´on and Uresti-Charre 1997). Although this statement must be qualified with regard to the “no free lunch” theorems for optimization (Wolpert and Macready 1997), up to now there are few if any alternatives to EA-based multiobjective optimization (Horn 1997). The numerous applications and the rapidly growing interest in the area of multiobjective evolutionary algorithms (MOEAs) take this fact into account. After the first pioneering studies on evolutionary multiobjective optimization appeared in the mid-1980s (Schaffer 1984; Schaffer 1985; Fourman 1985), a few different MOEA implementations were proposed in the years 1991–1994 (Kursawe 1991; Hajela and Lin 1992; Fonseca and Fleming 1993; Horn, Nafpliotis, and Goldberg 1994; Srinivas and Deb 1994). Later, these approaches (and variations of them) were successfully applied to various multiobjective optimization problems (Ishibuchi and Murata 1996; Cunha, Oliviera, and Covas 1997; Valenzuela-Rend´on and Uresti-Charre 1997; Fonseca and Fleming 1998b; Parks and Miller 1998). In recent years, some researchers have investigated particular topics of evolutionary multiobjective search, such as convergence to the Pareto-optimal front (Veldhuizen and Lamont 1998a; Rudolph 1998), niching (Obayashi, Takahashi, and Takeguchi 1998), and elitism (Parks and Miller 1998; Obayashi, Takahashi, and Takeguchi 1998), while others have concentrated on developing new evolutionary techniques (Lis and Eiben 1997; Laumanns, Rudolph, and Schwefel 1998). Meanwhile, several overview and review articles have also become available (Fonseca and Fleming 1995b; Tamaki, Kita, and Kobayashi 1996; Horn 1997; Veldhuizen and Lamont 1998b; Deb 1999b; Coello 1999a). In spite of this variety, there is a lack of studies providing performance comparisons and investigation of different aspects of the several evolutionary approaches. The few comparative studies that have been published remain mostly qualitative and are often restricted to a few algorithms. As a consequence, the following questions have remained open: • As Horn (Horn 1997) states “it is far from clear which, if any, approaches are superior for general classes of multiobjective problems.” The question is which EA implementations are suited to which sort of problem
1.4. Overview
15
and what are the specific advantages and drawbacks, respectively, of different techniques. • In contrast to SOPs, there is no single criterion to assess the quality of a trade-off front; quality measures are difficult to define. This might be the reason for the lack of studies in that area. Up to now, there has been no sufficient, commonly accepted definition of quantitative performance metrics for multiobjective optimizers. • There is no accepted set of well-defined test problems in the community. This makes it difficult to evaluate new algorithms in comparison with existing ones. • The various MOEAs incorporate different concepts, e.g., elitism and niching, that are in principle independent of the fitness assignment method used. However, it is not clear what the benefits of these concepts are. For instance, the question of whether elitism can improve multiobjective search in general is still an open problem.
1.4
Overview The above issues sketch the scope of the present work and result in the following research goals: 1. Comparison and investigation of prevailing approaches. 2. Improvement of existing MOEAs, possible development of a new, alternative evolutionary method. 3. Application of the most promising technique to real-world problems in the domain of system design. The first aspect aims at finding advantages and disadvantages of the different approaches and yielding a better understanding of the effects and the differences of the various methods. This involves the careful definition of quantitative performance measures which ideally allow for different quality criteria. Furthermore, appropriate test functions have to be designed that i) are understandable and easy to formulate, ii) represent essential aspects of “typical” applications, and iii) test for various types of problem difficulty. The last item is important for identifying those problem features which cause the most difficulty for MOEAs to converge to the Pareto-optimal front. The comparison also includes the examination of further factors of evolutionary search such as populations size and elitism. As a result, these investigations may either contribute to the problem of sampling the search space more efficiently by improving existing methods or lead to the development of a new evolutionary approach. Finally, the insights gained from the comparison as well as the improvements achieved will be used
16
Chapter 1. Introduction
to address individual system design problems in computer engineering. Usually, these applications are by far too complex to be handled by exact optimization algorithms. This monograph is divided into two parts. The first part (Chapters 2 and 3) is devoted to the research goals one and two, while the application side, which is related to the third research goal, is treated in the second part (Chapters 4 and 5). In Chapter 2, the key concepts of evolutionary multiobjective optimization are discussed including a brief overview of salient MOEA implementations. In addition, a new evolutionary approach is presented and a universal elitism scheme for MOEAs is proposed. The comparison of different MOEA implementations is the subject of the third chapter. First, several quantitative performance measures are introduced and discussed, and the experimental design is fully detailed. Then, two kinds of test problems are investigated. On the one hand, two NP hard problems are considered, the 0/1 knapsack problem and the traveling salesman problem, which are reformulated as MOPs. On the other hand, a set of six continuous functions is defined which test for different problem difficulties separately. In Chapter 4, the first application, the automated synthesis of complex hardware/software systems, is described. Three evolutionary approaches are compared on this problem, and a design space exploration for a video codec example is performed with regard to the optimization criteria cost, performance, and power dissipation. The second application (Chapter 5) addresses the problem of automatically generating software implementations for programmable digital signal processors from dataflow specifications. Although being computationally more expensive than existing state of the art algorithms, an EA is shown to find better solutions in a reasonable amount of run-time when only one objective (data memory requirement) is considered. Furthermore, the first systematic multiobjective optimization framework for this problem is presented which takes the three objectives execution time, program memory requirement, and data memory requirement into account. The approach is demonstrated on a sample rate conversion system, where the trade-off fronts for a number of well-known, commercial digital signal processors are analyzed. Moreover, two MOEAs are compared on eleven practical digital signal processing applications. Finally, Chapter 6 summarizes the fundamental results of this thesis and offers future perspectives.
Part I Methods
2 Evolutionary Algorithms for Multiobjective Optimization Due to their inherent parallelism, EAs have the potential of finding multiple Pareto-optimal solutions in a single simulation run. However, with many complex applications it is not possible to generate noninferior solutions, much less the entire Pareto-optimal set. Therefore, the optimization goal for an MOP may be reformulated in a more general fashion based on three objectives: • The distance of the resulting nondominated front to the Pareto-optimal front should be minimized. • A good (in most cases uniform) distribution of the solutions found is desirable. • The spread of the obtained nondominated front should be maximized, i.e., for each objective a wide range of values should be covered by the nondominated solutions. The subject of this chapter is the question of how these subgoals can be attained in evolutionary multiobjective search. After the basic terminology and the flow of a general EA have been outlined in Section 2.1, fundamental ideas of MOEAs are introduced in the following section, where in particular the differences between evolutionary single-objective and multiobjective optimization are worked out. Then, a brief summary of five salient evolutionary approaches to multiobjective optimization is presented which will be later, in Chapter 3, empirically compared on various test problems. Section 2.4 introduces a new MOEA which combines several features of previous evolutionary multiobjective optimizers in a unique manner, and in the last section a universal mechanism to prevent losing nondominated solutions during the search process is proposed.
20
Chapter 2. Evolutionary Algorithms for Multiobjective Optimization
2.1
Basic Principles of Evolutionary Algorithms In general, an EA is characterized by three facts: 1. a set of solution candidates is maintained, which 2. undergoes a selection process and 3. is manipulated by genetic operators, usually recombination and mutation. By analogy to natural evolution, the solution candidates are called individuals and the set of solution candidates is called the population. Each individual represents a possible solution, i.e., a decision vector, to the problem at hand where, however, an individual is not a decision vector but rather encodes it based on an appropriate structure. Without loss of generality, this structure is assumed to be a vector here, e.g., a bit vector or a real-valued vector, although other structures like trees (Koza 1992) might be used as well; the set of all possible vectors constitutes the individual space I . In this terminology, the population is a set of vectors i ∈ I , to be more precise a multi-set of vectors since it can contain several identical individuals. In the selection process, which can be either stochastic or completely deterministic, low-quality individuals are removed from the population, while highquality individuals are reproduced. The goal is to focus the search on particular portions of the search space and to increase the average quality within the population. The quality of an individual with respect to the optimization task is represented by a scalar value, the so-called fitness. Note that since the quality is related to the objective functions and the constraints, an individual must first be decoded before its fitness can be calculated. This situation is illustrated in Figure 4. Given an individual i ∈ I . A mapping function m encapsulates the decoding algorithm to derive the decision vector x = m (ii ) from i . Applying f to x yields the corresponding objective vector on the basis of which a fitness value is assigned to i . Recombination and mutation aim at generating new solutions within the search space by the variation of existing ones. The crossover operator takes a certain number of parents and creates a certain number of children by recombining the parents. To mimic the stochastic nature of evolution, a crossover probability is associated with this operator. By contrast, the mutation operator modifies individuals by changing small parts in the associated vectors according to a given mutation rate. Both crossover and mutation operator work on individuals, i.e., in individual space, and not on the decoded decision vectors. Based on the above concepts, natural evolution is simulated by an iterative computation process. First, an initial population is created at random (or according to a predefined scheme), which is the starting point of the evolution process. Then a loop consisting of the steps evaluation (fitness assignment), selection, recombination, and/or mutation is executed a certain number of times. Each loop iteration is called a generation, and often a predefined maximum number of generations serves as the termination criterion of the loop. But also
2.1. Basic Principles of Evolutionary Algorithms
mapping function m x =m(i )
individual i
Fig. 4:
objective function f y= f (x)
decision vector x
individual space I
21
decision space X
objective vector y
objective space Y
Relation between individual space, decision space, and objective space.
other conditions, e.g., stagnation in the population or existence of an individual with sufficient quality, may be used to stop the simulation. At the end, the best individual(s) in the final population or found during the entire evolution process is the outcome of the EA. In the following, the basic structure of an EA, as it is used throughout this work, is formalized. The population P at a certain generation t is represented by the symbol P t , and the symbol + stands for multi-set union in conjunction with populations. Alg. 1:
(General Evolutionary Algorithm) Input:
Output:
N T pc pm A
(population size) (maximum number of generations) (crossover probability) (mutation rate) (nondominated set)
Step 1: Initialization: Set P 0 = ∅ and t = 0. For i = 1, . . . , N do a)
Choose i ∈ I according to some probability distribution.
b)
Set P 0 = P 0 + {ii }.
Step 2: Fitness assignment: For each individual i ∈ P t determine the encoded decision vector x = m (ii ) as well as the objective vector y = f (xx ) and calculate the scalar fitness value F(ii ). Step 3: Selection: Set P 0 = ∅. For i = 1, . . . , N do a)
Select one individual i ∈ P t according to a given scheme and based on its fitness value F(ii ).
22
Chapter 2. Evolutionary Algorithms for Multiobjective Optimization
b)
Set P 0 = P 0 + {ii }.
The temporary population P 0 is called the mating pool. Step 4: Recombination: Set P 00 = ∅. For i = 1, . . . , 0
N 2
do
a)
Choose two individuals i , j ∈ P and remove them from P 0 .
b)
Recombine i and j . The resulting children are k , l ∈ I .
c)
Add k , l to P 00 with probability pc . Otherwise add i , j to P 00 .
Step 5: Mutation: Set P 000 = ∅. For each individual i ∈ P 00 do a)
Mutate i with mutation rate pm . The resulting individual is j ∈ I.
b)
Set P 000 = P 000 + { j }.
Step 6: Termination: Set P t+1 = P 000 and t = t + 1. If t ≥ T or anm (P P t )) else go to other stopping criterion is satisfied then set A = p(m Step 2. It must be emphasized that this algorithm does not reflect an EA in its most general form as, e.g., the population size need not be restricted and recombination can also involve more than two parents. Moreover, a large number of selection, crossover, and mutation operators have been proposed for different representations, applications, etc. which, however, are not presented here. A thorough discussion of the various aspects of EAs can be found in the following standard introductory material (Goldberg 1989; Koza 1992; Fogel 1995; B¨ack 1996; Mitchell 1996).
2.2
Key Issues in Multiobjective Search As mentioned at the beginning of this chapter, with an MOP the optimization goal itself consists of multiple objectives. According to the three objectives listed on page 19, two major problems must be addressed when an EA is applied to multiobjective optimization: 1. How to accomplish fitness assignment and selection, respectively, in order to guide the search towards the Pareto-optimal set. 2. How to maintain a diverse population in order to prevent premature convergence and achieve a well distributed and well spread nondominated set. In the following, a categorization of general techniques which deal with these issues is presented. The focus here is on cooperative population searches where only one optimization run is performed in order to approximate the Paretooptimal set. Moreover, another issue, elitism, is briefly discussed since it is different and more complicated with MOPs than with SOPs.
2.2. Key Issues in Multiobjective Search
2.2.1
23
Fitness Assignment and Selection In contrast to single-objective optimization, where objective function and fitness function are often identical, both fitness assignment and selection must allow for several objectives with MOPs. In general, one can distinguish MOEAs where the objectives are considered separately, approaches that are based on the classical aggregation techniques, and methods which make direct use of the concept of Pareto dominance.
2.2.1.1 Selection by Switching Objectives Instead of combining the objectives into a single scalar fitness value, this class of MOEAs switches between the objectives during the selection phase. Each time an individual is chosen for reproduction, potentially a different objective will decide which member of the population will be copied into the mating pool. As a consequence, Steps 2 and 3 of the general EA flow on page 21 are usually integrated or executed alternately. For example, Schaffer (1985) proposed filling equal portions of the mating pool according to the distinct objectives, while Fourman (1985) implemented a selection scheme where individuals are compared with regard to a specific (or random) order of the objectives. Later, Kursawe (1991) suggested assigning a probability to each objective which determines whether the objective will be the sorting criterion in the next selection step—the probabilities can be user-defined or chosen randomly over time. All of these approaches may have a bias towards “extreme” solutions and be sensitive to non-convex Pareto-optimal fronts (Horn 1997). 2.2.1.2 Aggregation Selection with Parameter Variation Other MOEA implementations build on the traditional techniques for generating trade-off surfaces (cf. Section 1.2). As with these methods, the objectives are aggregated into a single parameterized objective function; however, the parameters of this function are not changed for different optimization runs, but instead systematically varied during the same run. Some approaches (Hajela and Lin 1992)(Ishibuchi and Murata 1996), for instance, use the weighting method. Since each individual is assessed using a particular weight combination (either encoded in the individual or chosen at random), all members of the population are evaluated by a different objective function. Hence, optimization is done in multiple directions simultaneously. Nevertheless, the potential disadvantages of the underlying scalarization method (e.g., a bias towards convex portions of the Pareto-optimal front) may restrict the effectiveness of such MOEAs (Veldhuizen 1999). 2.2.1.3 Pareto-based Selection The concept of calculating an individual’s fitness on the basis of Pareto dominance was first suggested by Goldberg (1989). He presented a “revolutionary 10-line sketch” (Deb 1999b) of an iterative ranking procedure: First all non-
24
Chapter 2. Evolutionary Algorithms for Multiobjective Optimization
dominated individuals are assigned rank one and temporarily removed from the population. Then, the next nondominated individuals are assigned rank two and so forth. Finally, the rank of an individual determines its fitness value. Remarkable here is the fact that fitness is related to the whole population, while with other aggregation techniques an individual’s raw fitness value is calculated independently of other individuals. This idea has been taken up by numerous researchers, resulting in several Pareto-based fitness assignment schemes, e.g, (Fonseca and Fleming 1993; Horn, Nafpliotis, and Goldberg 1994; Srinivas and Deb 1994). Although this class of MOEAs is theoretically capable of finding any Pareto-optimal solution, the dimensionality of the search space may influence its performance, as noted by Fonseca and Fleming (1995b): ”[. . . ] pure Pareto EAs cannot be expected to perform well on problems involving many competing objectives and may simply fail to produce satisfactory solutions due to the large dimensionality and the size of the trade-off surface.” Even so, Pareto-based techniques seem to be most popular in the field of evolutionary multiobjective optimization (Veldhuizen and Lamont 1998b). 2.2.2
Population Diversity In order to approximate the Pareto-optimal set in a single optimization run, evolutionary optimizers have to perform a multimodal search where multiple, widely different solutions are to be found. Therefore, maintaining a diverse population is crucial for the efficacy of an MOEA. Unfortunately, a simple (elitist) EA tends to converge towards a single solution and often loses solutions due to three effects (Mahfoud 1995): selection pressure, selection noise, and operator disruption. The selection pressure is often defined in terms of the takeover time, i.e., the time required until the population is completely filled by the best individual when only selection takes place (B¨ack 1996). Selection noise refers to the variance of a selection scheme, while operator disruption relates to the destructive effects which recombination and mutation may have (e.g., high-quality individuals may be disrupted). To overcome this problem, several methods have been developed; the ones most frequently used in evolutionary multiobjective optimization are briefly summarized here.
2.2.2.1 Fitness Sharing Fitness sharing (Goldberg and Richardson 1987), which is the most frequently used technique, aims at promoting the formulation and maintenance of stable subpopulations (niches). It is based on the idea that individuals in a particular niche have to share the available resources. The more individuals are located in the neighborhood of a certain individual, the more its fitness value is degraded. The neighborhood is defined in terms of a distance measure d(ii , j ) and specified by the so-called niche radius σshare . Mathematically, the shared fitness F(ii )
2.2. Key Issues in Multiobjective Search
25
of an individual i ∈ P is equal to its old fitness F 0 (ii ) divided by its niche count: F(ii ) = P
F 0 (ii ) P s(d(ii , j )) j ∈P
(2.1)
An individual’s niche count is the sum of sharing function (s) values between itself and the individuals in the population. A commonly-used sharing function is ( � � i, j) α 1 − d(i if d(ii , j ) < σshare σshare s(d(ii , j )) = (2.2) 0 otherwise Furthermore, depending on how the distance function d(ii , j ) is defined, one distinguishes three types of sharing: 1. fitness sharing in individual space (d(ii , j ) = kii − j k), m (ii ) − m ( j )k), and 2. fitness sharing in decision space (d(ii , j ) = km m (ii )) − f (m m ( j ))k), 3. fitness sharing in objective space (d(ii , j ) = k f (m where k · k denotes an appropriate distance metric. Currently, most MOEAs implement fitness sharing, e.g., (Hajela and Lin 1992; Fonseca and Fleming 1993; Horn, Nafpliotis, and Goldberg 1994; Srinivas and Deb 1994; Greenwood, Hu, and D’Ambrosio 1996; Todd and Sen 1997; Cunha, Oliviera, and Covas 1997). 2.2.2.2 Restricted Mating Basically, two individuals are allowed to mate only if they are within a certain distance of each other (given by the parameter σmate ). As with fitness sharing, the distance of two individuals can be defined in individual space, decision space, or objective space. This mechanism may avoid the formation of lethal individuals and therefore improve the online performance. Nevertheless, as mentioned in (Fonseca and Fleming 1995b), it does not appear to be widespread in the field of MOEAs, e.g., (Hajela and Lin 1992; Fonseca and Fleming 1993; Loughlin and Ranjithan 1997). 2.2.2.3 Isolation by Distance This type of diversity mechanism assigns each individual a location (Ryan 1995) where in general two approaches can be distinguished. Either a spatial structure is defined on one population such that spatial niches can evolve in the same population, or there are several distinct populations which only occasionally exchange individuals (migration). Poloni (1995), for instance, used a distributed EA with multiple small populations, while Laumanns, Rudolph, and Schwefel (1998) structured the population by an underlying graph, a two-dimensional torus, where each individual is associated with a different node.
26
Chapter 2. Evolutionary Algorithms for Multiobjective Optimization
2.2.2.4 Overspecification With this method, the individual contains active and inactive parts: the former specify the encoded decision vector, the latter are redundant and have no function. Since inactive parts can become active and vice versa during the evolution, information can be hidden in an individual. Diploidy (Goldberg 1989) is an example of overspecification that is used in the MOEA proposed by Kursawe (1991). 2.2.2.5 Reinitialization Another technique to prevent premature convergence is to reinitialize the whole or parts of the population after a certain period of time or whenever the search stagnates. For example, Fonseca and Fleming (1998a) presented a unified formulation of evolutionary multiobjective optimization where at each generation a small number of random immigrants is introduced in the population. 2.2.2.6 Crowding Finally, crowding (De Jong 1975) and its derivates seem to be rather seldomly implemented in MOEAs, e.g., (Blickle 1996). Here, new individuals (children) replace similar individuals in the population. In contrast to Algorithm 1, not the whole population is processed by selection, recombination, and mutation, but only a few individuals are considered at a time. 2.2.3
Elitism De Jong (1975) suggested a policy to always include the best individual of P t into P t+1 in order to prevent losing it due to sampling effects or operator disruption. This strategy, which can be extended to copy the b best solutions to the next generation, is denoted as elitism. In his experiments, De Jong found that elitism can improve the performance of a genetic algorithm on unimodal functions, while with multimodal functions it may cause premature convergence. In evolutionary multiobjective optimization, elitism plays an important role, as will be shown in the next chapter. As opposed to single-objective optimization, the incorporation of elitism in MOEAs is substantially more complex. Instead of one best individual, there is an elite set whose size can be considerable compared to the population, for instance, when the Pareto-optimal set contains an infinite number of solutions. This fact involves two questions which must be answered in this context: • Population H⇒ Elite Set: Which individuals are kept for how long in the elite set? • Elite Set H⇒ Population: When and how are which members of the elite set re-inserted into the population? In general, two basic elitist approaches can be found in MOEA literature. One
2.3. Overview of Evolutionary Techniques
27
strategy, which directly uses De Jong’s idea, is to copy those individuals from P t automatically to P t+1 whose encoded decision vectors are nondominated P t ) (Tamaki, Mori, Araki, Mishima, and Ogai 1994). Sometimes regarding m (P a more restricted variant is implemented where only the k individuals whose corresponding objective vectors maximize one of the k objectives constitute the elite set (Anderson and Lawrence 1996; Murata, Ishibuchi, and Tanaka 1996; Todd and Sen 1997). Also the so-called (λ + µ) selection mainly used in the area of evolutionary strategies (B¨ack 1996) belongs to this class of elitist strategies. For example, Rudolph (1998) examined a simplified version of the MOEA originally presented in (Kursawe 1991) which is based on (1+1) selection. Often used is also the concept of maintaining an external set P of individuals whose encoded decision vectors are nondominated among all solutions generated so far. In each generation, a certain percentage of the population is filled up or replaced by members of the external set—these members are either selected at random (Cieniawski, Eheart, and Ranjithan 1995; Ishibuchi and Murata 1996) or according to other criteria, such as the period that an individual has stayed in the set (Parks and Miller 1998). Since the external set may be considerably larger than the population, Parks and Miller (1998) only allow those individuals to be copied into the elite set which are sufficiently dissimilar to the existing elite set members. Occasionally, both of the above two elitist policies are applied (Murata, Ishibuchi, and Tanaka 1996; Todd and Sen 1997).
2.3
Overview of Evolutionary Techniques Five of the most salient MOEAs have been chosen for the comparative studies which will be presented in the next chapter. A brief summary of their main features and their differences is given in the following. For a thorough discussion of different evolutionary approaches to multiobjective optimization, the interested reader is referred to (Fonseca and Fleming 1995b; Horn 1997; Veldhuizen and Lamont 1998b; Coello 1999a).
2.3.1
Schaffer’s Vector Evaluated Genetic Algorithm Schaffer (1984, 1985) presented an MOEA called vector evaluated genetic algorithm (VEGA) which is a representative of the category selection by switching objectives. Here, selection is done for each of the k objectives separately, filling equally sized portions of the mating pool. That is, Steps 2 and 3 of Algorithm 1 are executed k times per generation, respectively replaced by the following algorithm:
Alg. 2:
(Fitness Assignment and Selection in VEGA) Input: Output:
Pt P0
(population) (mating pool)
28
Chapter 2. Evolutionary Algorithms for Multiobjective Optimization
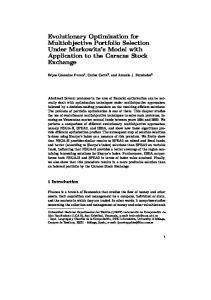
(a) VEGA
(b) HLGA
f2
f2 N/2 regarding f2 N/2 regarding f1
1111 0000 0000 1111 0000 1111 0000 1111 0000 1111 0000 1111
f1
000 111 encoded weight combination 000 111 11111 00000 000 111 00000 11111 000 111 00000 11111 111 000 000 111 00000 11111 000 111 00000 11111 000 111 000 111 000 111 000 111 000 000 111 111 000 111 000 111 00 11 000 111 000 111 00 000 111 000 11 111 00 11 000 111 00 11 000 111 00 11 000000 111111 000000 111111 000000 111111 000000 111111 111111 000000 000000 111111 0000 1111 000000 111111 0000 1111 000000 111111 11111 00000 0000 1111 0000 1111 f1 0000 1111 (d) NPGA
(c) FFGA f2
f2 1 = 1 + number of superior solutions
11111111 00000000 00000000 11111111 00000000 11111111 00000000 11111111 00000000 11111111 00000000 11111111 00000000 11111111
2 1 1 4
dominated by comparison set comparison set 111 000 000 111 000 111
1 2
competitors
111111 000000 000000 111111
1
10
0110 1010 10
5
f1
f1
(f) SPEA
(e) NSGA f2
f2 3/6 9/6
externally stored in population
front 1
2/6
3/6
14/6
3/6
front 2
9/6 2/6
front 3 front 4
Fig. 5:
f1
19/6
14/6
Illustration of six different selection mechanisms in objective space.
f1
2.3. Overview of Evolutionary Techniques
29
Step 1: Set i = 1 and mating pool P 0 = ∅. m (ii )). Step 2: For each individual i ∈ P t do F(ii ) = fi (m Step 3: For j = 1, . . . , N /k do select individual i from P t according to a given scheme and copy it to the mating pool: P 0 = P 0 + {ii }. Step 4: Set i = i + 1. Step 5: If i ≤ k then go to Step 2 else stop. This mechanism is graphically depicted in Figure 5a where the best individuals in each dimension are chosen for reproduction. Afterwards, the mating pool is shuffled and crossover and mutation are performed as usual. Schaffer implemented this method in combination with fitness proportionate selection (Goldberg 1989). Although some serious drawbacks are known (Schaffer 1985; Fonseca and Fleming 1995b; Horn 1997), this algorithm has been a strong point of reference up to now. Therefore, it has been included in this investigation. 2.3.2
Hajela and Lin’s Weighting-based Genetic Algorithm Another approach, which belongs to the category aggregation selection with parameter variation, was introduced in (Hajela and Lin 1992) (in the following referred to as HLGA—Hajela and Lin’s genetic algorithm). It is based on the weighting method, and to search for multiple solutions in parallel, the weights are not fixed but instead encoded in the individual’s vector. Hence, each individual is evaluated with regard to a potentially different weight combination (cf. Figure 5b). In detail, the fitness assignment procedure (Step 2 in Algorithm 1) is as follows:
Alg. 3:
(Fitness Assignment in HLGA) Input: Output:
Pt F
(population) (fitness values)
Step 1: For each individual i ∈ P t do a)
Extract weights w j ( j = 1, . . . , k) from i .
b)
m (ii )) + . . . + wk · f k (m m (ii )). Set F(ii ) = w1 · f 1 (m
The diversity of the weight combinations is promoted by fitness sharing in objective space. As a consequence, the EA evolves solutions and weight combinations simultaneously. Finally, Hajela and Lin (1992) emphasized mating restrictions to be necessary in order to “both speed convergence and impart stability to the genetic search”. It has been mentioned before that the weighting method is inherently biased towards convex portions of the trade-off front, which is consequently also a problem with HLGA. Nevertheless, weighted-sum aggregation appears still to be widespread due to its simplicity. HLGA has been chosen to represent this class of MOEAs.
30
Chapter 2. Evolutionary Algorithms for Multiobjective Optimization
2.3.3
Fonseca and Fleming’s Multiobjective Genetic Algorithm Fonseca and Fleming (1993) proposed a Pareto-based ranking procedure (here the acronym FFGA is used), where an individual’s rank equals the number of solutions encoded in the population by which its corresponding decision vector is dominated. The fitness assignment procedure (Step 2 in Algorithm 1), which slightly differs from Goldberg’s suggestion (cf. Section 2.2.1.3), consists of three steps:
Alg. 4:
(Fitness Assignment in FFGA) Input: Output:
(population) Pt σshare (niche radius) F (fitness values)
Step 1: For each i ∈ P t calculate its rank: r(ii ) = 1+|{ j | j ∈ P t ∧ j � i }|. Step 2: Sort population according to the ranking r . Assign each i ∈ P t a raw fitness F 0 (ii ) by interpolating from the best (r(ii ) = 1) to the worst individual (r (ii ) ≤ N ); in this work linear ranking (Baker 1985) is used. Step 3: Calculate fitness values F(ii ) by averaging and sharing the raw fitness values F 0 (ii ) among individuals i ∈ P t having identical ranks r (ii ) (fitness sharing in objective space). Note that the symbol | · | used in Step 1 denotes the number of elements in Z in conjunction with a (multi) set Z . In Figure 5c, a hypothetical population and the corresponding ranks of the individuals are shown. The individuals whose associated solutions are nondomP ) have rank 1 while the worst individual was assigned inated regarding m (P rank 10. Based on the ranks, the mating pool is filled using stochastic universal sampling (Baker 1987). The basic concept has been extended meanwhile by, e.g., adaptive fitness sharing and continuous introduction of random immigrants (Fonseca and Fleming 1995a; Fonseca and Fleming 1998a), which is, however, not regarded here. 2.3.4
Horn, Nafpliotis, and Goldberg’s Niched Pareto Genetic Algorithm The niched Pareto genetic algorithm (NPGA) proposed in (Horn and Nafpliotis 1993)(Horn, Nafpliotis, and Goldberg 1994) combines tournament selection (Blickle and Thiele 1996) and the concept of Pareto dominance in the following way (Steps 2 and 3 of Algorithm 1):
Alg. 5:
(Fitness Assignment and Selection in NPGA) Input:
Output:
Pt σshare tdom P0
(population) (niche radius) (domination pressure) (mating pool)
2.3. Overview of Evolutionary Techniques
31
Step 1: Set i = 1 and mating pool P 0 = ∅. Step 2: Select two competitors i , j ∈ P t and a comparison set P dom ⊆ P t of tdom individuals at random (without replacement). P dom ) and m ( j ) is not then i Step 3: If m (ii ) is nondominated regarding m (P 0 is the winner of the tournament: P = P 0 + {ii }. P dom ) and m (ii ) is not Step 4: Else if m ( j ) is nondominated regarding m (P 0 then j is the winner of the tournament: P = P 0 + { j }. Step 5: Else decide tournament by fitness sharing: a)
Calculate the number of individuals in the partially filled mating pool that are in σshare -distance to i : n(ii ) = |{kk | k ∈ P 0 ∧ d(ii , k ) < σshare }|. Do the same for j .
b)
If n(ii ) < n( j ) then P 0 = P 0 + {ii } else P 0 = P 0 + { j }.
Step 6: Set i = i + 1. If i ≤ N then go to Step 2 else stop. The slightly modified scheme of fitness sharing which is implemented in Step 4 operates in the objective space. The mechanism of the binary Pareto tournaments is illustrated in Figure 5d: two competing individuals and a set of tdom individuals are compared. The competitor represented by the white point is the winner of the tournament since the encoded decision vector is not dominated with regard to the comparison set in contrast to the other competitor. 2.3.5
Srinivas and Deb’s Nondominated Sorting Genetic Algorithm Among the Pareto-based MOEAs, Srinivas and Deb (1994) have implemented Goldberg’s sketch most directly. The different trade-off fronts in the population are, figuratively speaking, peeled off step by step (cf. Figure 5e), and fitness sharing is performed for each front separately in order to maintain diversity. In detail, fitness assignment is accomplished by an iterative process (Step 2 in Algorithm 1):
Alg. 6:
(Fitness Assignment in NSGA) Input: Output:
Pt (population) σshare (niche radius) F (fitness values)
Step 1: Set P remain = P t and initialize the dummy fitness value Fd with N . Step 2: Determine set P nondom of individuals in P remain whose decision vecP remain ). Ignore them in the furtors are nondominated regarding m (P ther classification process, i.e., P remain = P remain − P nondom (multiset subtraction). Step 3: Set raw fitness of individuals in P nondom to Fd and perform fitness sharing in decision space, however, only within P nondom .
32
Chapter 2. Evolutionary Algorithms for Multiobjective Optimization
Step 4: Decrease the dummy fitness value Fd such that it is lower than the smallest fitness in P nondom : 0 < Fd < min{F(ii ) | i ∈ P nondom }. Step 5: If P remain 6 = ∅ then go to Step 2 else stop. Note that high fitness values correspond here to high reproduction probabilities and that fitness sharing is done in decision space, which is contrary to FFGA and NPGA. In the original study (Srinivas and Deb 1994), this fitness assignment method was combined with a stochastic remainder selection (Goldberg 1989).
2.4
Strength Pareto Evolutionary Algorithm Here, a new approach to multiobjective optimization, the strength Pareto evolutionary algorithm (SPEA), is introduced.1 SPEA uses a mixture of established and new techniques in order to approximate the Pareto-optimal set. On one hand, similarly to other MOEAs, it • stores those individuals externally that represent a nondominated front among all solutions considered so far (cf. Section 2.2.3); • uses the concept of Pareto dominance in order to assign scalar fitness values to individuals; and • performs clustering to reduce the number of individuals externally stored without destroying the characteristics of the trade-off front. On the other hand, SPEA is unique in four respects: • It combines the above three techniques in a single algorithm. • The fitness of a population member is determined only from the individuals stored in the external set; whether individuals in the population dominate each other is irrelevant. • All individuals in the external set participate in selection. • A new Pareto-based niching method is provided in order to preserve diversity in the population. The flow of the algorithm is as follows (the recombination and mutation steps are identical to Algorithm 1). 1 This
algorithm was first published in (Zitzler and Thiele 1998a) and subsequently in (Zitzler and Thiele 1999) and has been discussed by different researchers (Deb 1998; Deb 1999b; Veldhuizen 1999).
2.4. Strength Pareto Evolutionary Algorithm
Alg. 7:
33
(Strength Pareto Evolutionary Algorithm) Input:
Output:
N N T pc pm A
(population size) (maximum size of external set) (maximum number of generations) (crossover probability) (mutation rate) (nondominated set)
Step 1: Initialization: Generate an initial population P 0 according to Step 1 in Algorithm 1 and create the empty external set P 0 = ∅. Set t = 0. 0
Step 2: Update of external set: Set the temporary external set P = P t . a)
Copy individuals whose decision vectors are nondominated re0 0 0 P t ) to P : P = P + {ii | i ∈ P t ∧ m (ii ) ∈ garding m (P m (P P t ))}. p(m
b)
Remove individuals from P whose corresponding decision vec0 P ), i.e., as long as tors are weakly dominated regarding m (P 0 there exists a pair (ii , j ) with i , j ∈ P and m (ii ) � m ( j ) do 0 0 P = P − { j }.
c)
Reduce the number of individuals externally stored by means of 0 clustering, i.e., call Algorithm 9 with parameters P and N , and assign the resulting reduced set to P t+1 .
0
Step 3: Fitness assignment: Calculate fitness values of individuals in P t and P t by invoking Algorithm 8. Step 4: Selection: Set P 0 = ∅. For i = 1, . . . , N do a)
Select two individuals i , j ∈ P t + P t at random.
b)
If F(ii ) < F( j ) then P 0 = P 0 + {ii } else P 0 = P 0 + { j }. Note that fitness is to be minimized here (cf. Section 2.4.1).
Step 5: Recombination: . . . Step 6: Mutation: . . . Step 7: Termination: Set P t+1 = P 000 and t = t + 1. If t ≥ T or anm (P P t )) else go to other stopping criterion is satisfied then set A = p(m Step 2. The main loop of the algorithm is outlined in Figure 6. At the beginning of each loop iteration (Step 2), the external set P is updated and reduced if its maximum size N is overstepped. Then, individuals in P and P are evaluated interdependently from each other and assigned fitness values. The next step represents the selection phase where individuals from P + P , the union of population and external set, are selected in order to fill the mating pool—here,
34
Chapter 2. Evolutionary Algorithms for Multiobjective Optimization
population P 2 update of external set
3 fitness assignment
mutation 6 recombination 5
selection 4
external set P
mating pool P’
Fig. 6:
Basic steps in the strength Pareto evolutionary algorithm. The numbers of the steps are in accordance with Algorithm 7.
binary tournament selection with replacement is used. Finally, crossover and mutation operators are applied as usual. In the next two sections, the fitness assignment mechanism (Algorithm 8) as well as the clustering procedure (Algorithm 9) are described in detail. 2.4.1
Fitness Assignment The fitness assignment procedure is a two-stage process. First, the individuals in the external set P are ranked. Afterwards, the individuals in the population P are evaluated. The following procedure corresponds to Step 2 in Algorithm 1.
Alg. 8:
(Fitness Assignment in SPEA) Input: Output:
Pt Pt F
(population) (external set) (fitness values)
Step 1: Each individual i ∈ P t is assigned a real value S(ii ) ∈ [0, 1), called strength2 ; S(ii ) is proportional to the number of population members 2 This
term is adopted from (Holland 1992) where it was introduced in the context of classifier systems; it stands for a quantity summarizing the usefulness of a rule. Here, it reflects the usefulness of a nondominated solution.
2.4. Strength Pareto Evolutionary Algorithm
35
j ∈ P t for which m (ii ) � m ( j ): S(ii ) =
|{ j | j ∈ P t ∧ m (ii ) � m ( j )}| N +1
The fitness of i is equal to its strength: F(ii ) = S(ii ). Step 2: The fitness of an individual j ∈ P t is calculated by summing the strengths of all externally stored individuals i ∈ P t whose decision vectors weakly dominate m ( j ). We add one to the total in order to guarantee that members of P t have better fitness than members of P t (note that fitness is to be minimized here, i.e., small fitness values correspond to high reproduction probabilities): X F( j ) = 1 + S(ii ) where F( j ) ∈ [1, N ). P t ,m m (ii )�m m( j ) i ∈P
To make the effect of this ranking method clear, take a look at Figure 5f. Graphically, the objective space which is dominated by the five decision vectors represented by the white points is divided into distinct rectangles. Each subset P 0 of P defines one such rectangle which represents the region in the objective P 0 ) in common. For instance, space dominated by all decision vectors in m (P the dark-shaded rectangle in the lower-left corner is dominated by all decision P ), while the upper-left bright-shaded rectangle is only dominated vectors in m (P P ). These rectangles are considered as niches, and the goal is to by one x ∈ m (P distribute the individuals over this “grid” such that a) (brighter-shaded) rectangles dominated by only a few x ∈ P contain more individuals than (darker-shaded) rectangles that are dominated by many x ∈ P , and b) a rectangle comprises as many individuals as other (equally-shaded) rectangles P ). which are dominated by the same number of decision vectors in m (P This mechanism intuitively reflects the idea of preferring individuals near the Pareto-optimal front and distributing them at the same time along the trade-off surface. In Figure 5f, the first aspect can be easily seen: individuals located in the bright rectangles achieve better fitness values than the remaining population members. To demonstrate the second aspect, imagine three more objective vectors plotted in the lower rectangle containing one individual with fitness the 9/6 (cf. Figure 7). The corresponding externally stored individual i gets “stronger” (S(ii ) = 6/9), and as a result, the crowded niche is diminished relatively in fitness (15/9), while the individual in the other of the two rectangles improves (12/9). The main difference with fitness sharing is that niches are not defined in terms of distance but Pareto dominance. This renders the setting of a distance parameter superfluous, although the parameter N influences the niching capability, as will be discussed in the next section. Furthermore, it has to be mentioned that this kind of fitness assignment using two interacting populations has
36
Chapter 2. Evolutionary Algorithms for Multiobjective Optimization
f2
f2 3/6 9/6
3/9 12/9
externally stored in population 2/6
2/9
3/6
14/6
17/9
3/6
6/9 15/9 15/9 15/9 15/9
9/6 2/6 19/6
Fig. 7:
14/6
3/9
f1
25/9
20/9
2/9 f1
Demonstration of the niching mechanism used in SPEA. By adding three individuals to a particular niche, the reproduction probabilities of the niche members are decreased (i.e., the fitness values are increased).
been inspired by (Forrest and Perelson 1991; Smith and Forrest 1992; Smith, Forrest, and Perelson 1993; Forrest, Javornik, Smith, and Perelson 1993; Paredis 1995). Paredis (1995) studied the use of cooperating populations in EAs and showed that symbiotic evolution can speed up the search process. In (Forrest and Perelson 1991; Smith and Forrest 1992; Smith, Forrest, and Perelson 1993; Forrest, Javornik, Smith, and Perelson 1993), a similar concept was applied to immune system models in which two cooperative populations were used to maintain population diversity; Smith, Forrest, and Perelson (1993) reported that this method has emergent properties which are similar to fitness sharing. However, preliminary investigations indicated that it is difficult to directly use these concepts in evolutionary multiobjective optimization. Two implementations, which were based on the above ideas, were found to not sufficiently cover the Pareto-optimal set with a simple test function proposed by Schaffer (1984) (cf. next section). 2.4.2
Reducing the Nondominated Set by Clustering In certain problems, the Pareto-optimal set can be extremely large or even contain an infinite number of solutions. However, from the DM’s point of view, presenting all nondominated solutions found is useless when their number exceeds reasonable bounds. Moreover, the size of the external set influences the behavior of SPEA. On the one hand, since P participates in selection, too many external individuals might reduce selection pressure and slow down the search (Cunha, Oliviera, and Covas 1997). On the other hand, the strength niching mechanism relies on a uniform granularity of the “grid” defined by the external set. If the
2.4. Strength Pareto Evolutionary Algorithm
1
2
group
f2
3
select
f2
f1
Fig. 8:
37
remove
f2
f1
f1
The principles of pruning a nondominated set: i) solutions close to each other are grouped into clusters, ii) per cluster a representative solution is determined, and iii) the remaining solutions are removed from the set. Note that here clustering is performed in objective space, although distance may also be defined in decision space or individual space.
individuals in P are not distributed uniformly, the fitness assignment method is potentially biased towards certain regions of the search space, leading to an unbalance in the population. Thus, pruning the external set while maintaining its characteristics might be necessary or even mandatory. A method which has been applied to this problem successfully and studied extensively in the same context is cluster analysis (Morse 1980)(Rosenman and Gero 1985). In general, cluster analysis partitions a collection of p elements into q groups of relatively homogeneous elements, where q < p. The average linkage method, a clustering approach that has proven to perform well on this problem (Morse 1980), has been chosen here. The underlying principle is illustrated in Figure 8. Alg. 9:
(Clustering) Input: Output:
0
P (external set) N (maximum size of external set) P t+1 (updated external set)
0
Step 1: Initialize cluster S set C; each individual i ∈ P constitutes a distinct cluster: C = i ∈PP 0 {{ii }}. Step 2: If |C| ≤ N , go to Step 5, else go to Step 3. Step 3: Calculate the distance of all possible pairs of clusters. The distance dc of two clusters c1 and c2 ∈ C is given as the average distance
38
Chapter 2. Evolutionary Algorithms for Multiobjective Optimization
between pairs of individuals across the two clusters dc =
1 · |c1 | · |c2 |
X
d(ii 1 , i 2 )
i 1 ∈c1 ,ii 2 ∈c2
where the function d reflects the distance between two individuals i 1 and i 2 (here the distance in objective space is used). Step 4: Determine two clusters c1 and c2 with minimal distance dc ; the chosen clusters amalgamate into a larger cluster: C = C \{c1 , c2 }∪{c1 ∪c2 }. Go to Step 2. Step 5: Per cluster, select a representative individual and remove all other individuals from the cluster . We consider the centroid (the point with minimal average distance to all other points in the cluster) as the representative individual. Compute the reduced nondominated set by S uniting the representatives of the clusters: P t+1 = c∈C c. The effect of this clustering procedure is demonstrated in Figure 9, which shows the outcomes of three SPEA runs and one VEGA run on a simple test function used by Schaffer (1984): minimize subject to
f (x) = ( f 1 (x), f 2 (x)) f 1 (x) = x 2 f 2 (x) = (x − 2)2
(2.3)
The Pareto-optimal set X p consists of all solutions 0 ≤ x ≤ 2, the corresponding trade-off front is Y p = {(y1 , y2 ) ∈ Y f | 0 ≤ y1 ≤ 4 ∧ 0 ≤ y2 ≤ 4}. For SPEA three different combinations of population size and external set size were tried (95/5, 70/30, 30/70), where in each case N +N = 100, while VEGA used a population size of 100.3 As can be observed from Figure 9, the objective vectors represented by the external set well approximate the Pareto-optimal front depending on the parameter N . Moreover, in comparison to VEGA, SPEA evolved more Pareto-optimal solutions and distributed them more uniformly along the trade-off front. Cunha et al. (Cunha, Oliviera, and Covas 1997) also combined a MOEA with a clustering approach in order to achieve reasonably sized nondominated sets. This algorithm, however, uses a different clustering method which has been proposed in (Rosenman and Gero 1985); thereby, for each objective, a tolerance value must specified. Moreover, it differs from SPEA with regard to the following two aspects: i) no external set is maintained, and ii) fitness sharing is incorporated to preserve diversity in the population. 14-bit vector was used to encode real numbers between −6 and 6; the other parameters were: pc = 1, pm = 0, and T = 100. Furthermore, each run was performed using the same initial population. Although only limited weight can be given to a single run per parameter combination, the results looked similar when the simulations were repeated with different initial populations. 3A
2.5. Universal Elitism Scheme
39
SPEA
SPEA
10 8 8 6 6 f2
f2 4
4
2
2
0
0 0
2
4
6
8
0
2
4
f1
6
8
f1
SPEA
VEGA 10
8
8 6 6 f2 4
f2 4
2
2
0
0 0
2
4
6
8
0
2
f1
4
6
8
f1
Fig. 9:
Performance of SPEA and VEGA on Schaffer’s test function. With SPEA the boxes represent the individuals included in the external set at the end of each run; with VEGA m (∪tT=0 P t )) are plotted in objective space. all nondominated solutions x ∈ p(m
2.5
Universal Elitism Scheme The elitism mechanism used in SPEA can be generalized for incorporation in arbitrary MOEA implementations. The only difference is that the population and the external set are already united before (and not after) the fitness assignment phase. This guarantees that any fitness assignment scheme can be used in combination with this elitism variant. The general algorithm is presented below, where Steps 4 to 7 are identical to the corresponding steps in Algorithm 1.
Alg. 10: (General Elitist Multiobjective Evolutionary Algorithm)
Input:
N N T
(population size) (maximum size of external set) (maximum number of generations)
40
Chapter 2. Evolutionary Algorithms for Multiobjective Optimization
Output:
pc pm A
(crossover probability) (mutation rate) (nondominated set)
Step 1: Initialization: Set P 0 = ∅ and t = 0. Initialize P 0 according to Step 1 in Algorithm 1. 0
Step 2: Update of external set: Set the temporary external set P = P t . a)
Copy individuals whose decision vectors are nondominated re0 0 0 P t ) to P : P = P + {ii | i ∈ P t ∧ m (ii ) ∈ garding m (P m (P P t ))}. p(m
b)
Remove individuals from P whose corresponding decision vec0 P ), i.e., as long as tors are weakly dominated regarding m (P 0 there exists a pair (ii , j ) with i , j ∈ P and m (ii ) � m ( j ) do 0 0 P = P − { j }.
c)
Reduce the number of individuals externally stored by means of 0 clustering, i.e., call Algorithm 9 with parameters P and N , and assign the resulting reduced set to P t+1 .
0
Step 3: Elitism: Set P t = P t + P t . Step 4: Fitness assignment: . . . Step 5: Selection: . . . Step 6: Recombination: . . . Step 7: Mutation: . . . Step 8: Termination: Set P t+1 = P 000 and t = t + 1. If t ≥ T or anm (P P t )) else go to other stopping criterion is satisfied then set A = p(m Step 2. It has to be mentioned that after Step 3 the population is automatically reduced to its original size by the selection process; only N individuals are copied to the mating pool according to Step 3 of Algorithm 1. Furthermore, note that in Step 3 not the updated external set P t+1 is added to the population P t but the previous external set P t . Some authors (Parks and Miller 1998) use the updated external set when re-inserting elite set members into the population. As a result, some good individuals that were members of P t−1 may be lost due to the update operation. In the next chapter it is shown that the universal elitism scheme proposed here can substantially improve the performance of non-elitist MOEAs.
3 Comparison of Selected Evolutionary Approaches Two kinds of test problems are used in the present work in order to compare the MOEA implementations discussed in the previous chapter. The first kind of MOP are NP hard problems (extended to the multiobjective case). Although easy to formulate and understand, they represent certain classes of real-world applications and are difficult to solve. Here, the 0/1 knapsack problem and the traveling salesman problem are considered (Garey and Johnson 1979). Both problems have been extensively studied, and several publications in the domain of evolutionary computation are related to the knapsack problem (Khuri, B¨ack, and Heitk¨otter 1994; Michalewicz and Arabas 1994; Spillman 1995; Sakawa, Kato, and Shibano 1996) as well as the traveling salesman problem, e.g., see (Banzhaf et al. 1999). While these problems are discrete, the second kind of MOP refers to continuous functions which test for different problem difficulties separately. This allows specification of which algorithms are suited to which sort of problem and the determination of areas which cause trouble for particular techniques. Besides the choice of appropriate test functions, the performance assessment by means of quantitative metrics as well as the experimental design are important issues when comparing multiobjective optimizers. They are discussed in Section 3.1 and Section 3.2, respectively. Afterwards, the experiments regarding the knapsack problem, traveling salesman problem, and continuous test functions are described separately in Sections 3.3 to 3.5. A summary of the major results concludes the chapter.
42
Chapter 3. Comparison of Selected Evolutionary Approaches
3.1
Performance Measures As stated at the beginning of Chapter 2, the optimization goal of an MOP consists itself of three objectives: i) minimal distance to the Pareto-optimal front, ii) good distribution, and iii) maximum spread. Performance assessment of multiobjective optimizers should take all of these objectives into account.
3.1.1
Related Work In the literature, some attempts can be found to formalize the above criteria by means of quantitative metrics. Performance assessment using the weighting method was introduced by Esbensen and Kuh (1996). There, a set A of decision vectors is evaluated regarding a given linear combination by determining the minimum weighted-sum of all corresponding objective vectors of A . Based on this concept, a sample of linear combinations is chosen at random (with respect to a certain probability distribution) and the minimum weighted-sums for all linear combinations are summed up and averaged. The resulting value is taken as a measure of quality. A drawback of this metric is that only the “worst” solution determines the quality value per linear combination. Although several weight combinations are used, non-convex regions of the trade-off surface contribute to the quality more than convex parts and may, as a consequence, dominate the performance assessment. Finally, the distribution as well as the extent of the nondominated front is not considered. Another interesting way of performance assessment was proposed by Fonseca and Fleming (1996). Given a nondominated set A ⊆ X , a boundary function divides the objective space into two regions: the region weakly dominated by A and the region corresponding to decision vectors which dominate members of A . They call this particular function, which can also be seen as the locus of the family of tightest goal vectors known to be attainable, the attainment surface. Taking multiple optimization runs into account, a method is described to compute an x%-attainment surface by using auxiliary straight lines and sampling their intersections with the attainment surfaces obtained. Here, the x%-attainment surface represents the family of goal vectors that are likely to be attained in exactly x% of the runs (x can be chosen arbitrarily). As a result, the samples represented by the x%-attainment surface can be assessed relatively by means of statistical tests and therefore allow comparison of the performance of two or more multiobjective optimizers. A drawback of this approach is that it remains unclear how the quality difference can be expressed, i.e., how much better one algorithm is than another. In the context of investigations on convergence to the Pareto-optimal set, some authors (Rudolph 1998; Veldhuizen and Lamont 1998a) have considered the distance of a given nondominated front to the Pareto-optimal front. The distribution was not taken into account, because the focus was not on this matter. However, in comparative studies distance alone is not sufficient for performance evaluation, since extremely differently distributed fronts may have the same distance to the Pareto-optimal front.
3.1. Performance Measures
3.1.2
43
Scaling-Independent Measures In the present work, two complementary measures are used to evaluate the tradeoff fronts produced by the various MOEAs. Both are scaling-independent, i.e., they do not require the objective values to be scaled even though the magnitude of each objective criterion is quite different. The performance assessment method by Fonseca and Fleming (1996) is scaling-independent as well, while the measures used in (Esbensen and Kuh 1996; Rudolph 1998; Veldhuizen and Lamont 1998a) depend on an appropriate scaling of the objective functions. The function S is a measure of how much of the objective space is weakly dominated by a given nondominated set A .
Def. 8:
(Size of the dominated space) Let A = (xx 1 , x 2 , . . . , x l ) ⊆ X be a set of l A ) gives the volume enclosed by the union of decision vectors. The function S(A the polytopes p1 , p2 , . . . pl , where each pi is formed by the intersections of the following hyperplanes arising out of x i , along with the axes: for each axis in the objective space, there exists a hyperplane perpendicular to the axis and passing through the point ( f 1 (xx i ), f 2 (xx i ), . . . , f k (xx i )). In the two-dimensional case, each pi represents a rectangle defined by the points (0, 0) and ( f 1 (xx i ), f 2 (xx i )).1 In (Veldhuizen 1999) it is stated that this metric may be misleading if the Paretooptimal front is non-convex. However, independent of whether the trade-off front is non-convex or convex, different Pareto-optimal solutions may cover differently large portions of the objective space. In the author’s opinion, the only conclusion that can be drawn from this fact is that the coverage of the objective space is only one of several possible criteria to evaluate the quality of a nondominated front. An advantage of the S metric is that each MOEA can be assessed independently of the other MOEAs. However, the S values of two sets A , B cannot be used to derive whether either set entirely dominates the other. Therefore, a second measure is introduced here by which two sets can be compared relatively to each other.
Def. 9:
(Coverage of two sets) Let A , B ⊆ X be two sets of decision vectors. The A , B ) to the interval [0, 1]: function C maps the ordered pair (A A , B ) := C(A
|{bb ∈ B | ∃ a ∈ A : a � b }| B| |B
(3.1)
A , B ) = 1 means that all decision vectors in B are weakly domiThe value C(A A , B ) = 0, represents the situation when none of nated by A . The opposite, C(A the points in B are weakly dominated by A . Note that always both directions A , B ) is not necessarily equal to 1 − C(B B , A ). have to be considered, since C(A maximization problem is assumed here where the minimum value f imin that objective f i can take is equal to zero for all i = 1, . . . , k. When ( f 1min , f2min , . . . , f kmin ) 6= 0 , each polytope pi is formed by the points ( f1min , f2min , . . . , f kmin ) (instead of the origin 0 ) and ( f 1 (xx i ), f 2 (xx i ), . . . , fk (xx i )). Accordingly, the polytope pi is defined by the points 1A
44
Chapter 3. Comparison of Selected Evolutionary Approaches
f2
f2
only covered by front 1
α
front 1
covered by front 1 and front 2 front 2
only covered by front 2
γ β f1
f1
Fig. 10: Potential problem with the C metric (left) and illustration of the alternative D metric (right).
The S and the C measures, which were first published in (Zitzler and Thiele 1998b) and have been taken up by some researchers meanwhile, e.g., (Laumanns, Rudolph, and Schwefel 1999; Coello 1999b; Veldhuizen 1999), are sufficient here as the experimental results show (cf. Sections 3.3 to 3.5). However, there is a potential problem with the C metric as illustrated in Figure 10 on the left. Front 2 is actually closer to the Pareto-optimal front than front 1, but both fronts are equal regarding the C metric (the coverage is 50% in each case). During the final stages of this work, another measure has been developed in order to overcome this problem. It is presented here; however, it was not used for the performance comparisons in Sections 3.3 to 3.5. Def. 10: (Coverage difference of two sets) Let A , B ⊆ X be two sets of decision vec-
tors. The function D is defined by
A , B ) := S(A A + B ) − S(B B) D(A
(3.2)
and gives the size of the space weakly dominated by A but not weakly dominated by B (regarding the objective space). To illustrate this definition consider Figure 10 on the right and assume that A is related to front 1 and B to front 2. On the one hand, there is the area of size α that is covered by front 1 but not by front 2; on the other hand there is an area of size β that is covered by front 2 but not by front 1. The dark-shaded area (of A , B ) = α and size γ ) is covered by both fronts in common. It holds that D(A ( f 1 (xx i ), f2 (xx i ), . . . , f k (xx i )) and ( f 1max , f2max , . . . , fkmax ) when the objectives are to be minimized ( f imax represents the maximum value of objective fi ). Mixed maximization/minimization problems are treated analogously.
3.1. Performance Measures
45
B , A ) = β since D(B A + B) α + β + γ = S(A A) α + γ = S(A B ). β + γ = S(B
(3.3) (3.4) (3.5)
B , A ) > D(A A , B ) which reflects the quality difference In this example, D(B between the two fronts in contrast to the C metric. In addition, the D measure gives information about whether either set entirely dominates the other set, e.g., A , B ) = 0 and D(B B , A ) > 0 means that A is dominated by B . D(A Ideally, the D metric is used in combination with the S metric where the values may be normalized by a reference volume V . For a maximization problem, the value k Y V = ( fimax − fimin ) i=1
is suggested here, where fimax and fimin is the maximum respectively minimum X p ) as provalue objective fi can take. However, other values, e.g., V = S(X posed by Veldhuizen (1999), may be used as well. In consequence, four values are considered when comparing two sets A , B ∈ X f : A )/ V, which gives the relative size of the region in objective space that is S(A weakly dominated by A , B )/ V, which gives the relative size of the region in objective space that is S(B weakly dominated by B , A , B )/ V, which gives the relative size of the region in objective space that D(A is weakly dominated by A and not by B , and B , A )/ V, which gives the relative size of the region in objective space that D(B is weakly dominated by B and not by A . As the D measure is defined on the basis of the S measure, no additional implementation effort is necessary. 3.1.3
Scaling-Dependent Measures The following set of metrics is an alternative to the S, C and D measures by which each of the three criteria (distance, distribution, spread) can be assessed separately. Although this allows a more accurate performance comparison, the measures below are scaling-dependent as they rely on a distance metric.
Def. 11: Given a nondominated set A ⊆ X , a neighborhood parameter σ > 0 (to be
chosen appropriately), and a distance metric k · k. Three functions are introduced to assess the quality of A regarding the decision space:
46
Chapter 3. Comparison of Selected Evolutionary Approaches
1. The function M1 gives the average distance to the Pareto-optimal set X p : A ) := M1 (A
1 X min{kaa − x k | x ∈ X p } A| |A
(3.6)
A a ∈A
2. The function M2 takes the distribution in combination with the number of nondominated solutions found into account: A ) := M2 (A
X 1 |{bb ∈ A | kaa − b k > σ }| A − 1| |A
(3.7)
a ∈A A
3. The function M3 considers the spread of the set A : v u n uX A ) := t max{kai − bi k | a , b ∈ A } M3 (A
(3.8)
i=1
Analogously, three metrics M1∗ , M2∗ , and M3∗ are defined on the objective space, A) ⊆ Y : where σ ∗ > 0 is given as before and U = f (A U ) := M1∗ (U
1 X min{kuu − y k | y ∈ Y p } U| |U
(3.9)
U u ∈U
X 1 |{vv ∈ U | kuu − v k > σ ∗ }| U| − 1 |U U u ∈U v u k uX ∗ U ) := t M3 (U max{ku i − vi k | u , v ∈ U }
U ) := M2∗ (U
(3.10)
(3.11)
i=1
While M1 and M1∗ are intuitive, M2 and M3 (respectively M2∗ and M3∗ ) need further explanation. The distribution metrics give a value within the interval A |] ([0, |U U |]) which reflects the number of σ -niches (σ ∗ -niches) in A (U U ). [0, |A Obviously, the higher the value the better the distribution for an appropriate U ) = |U U | means that for each objective neighborhood parameter (e.g., M2∗ (U vector there is no other objective vector within σ ∗ -distance to it). The functions M3 and M3∗ use the maximum extent in each dimension to estimate the range to which the nondominated set respectively front spreads out. In the case of two objectives, this represents the distance of the two outer solutions.
3.2
Methodology In the following general implementation aspects as well as the performing of the experiments are described.
3.2. Methodology
3.2.1
47
Selection and Fitness Sharing Actually, each MOEA should be combined with the selection scheme originally applied. But the influence of the selection scheme on the outcome of an EA cannot be neglected, e.g., fitness proportionate selection, which is used in VEGA, is well known to have serious disadvantages (Blickle and Thiele 1996). In order to guarantee a fair comparison, all MOEAs except FFGA were implemented with the same selection scheme: binary tournament selection with replacement. In FFGA, the originally proposed stochastic universal sampling was employed, because fitness assignment is closely related to this particular selection algorithm. Unfortunately, a conventional combination of fitness sharing and tournament selection may lead to chaotic behavior of the EA (Oei, Goldberg, and Chang 1991). Therefore, both NSGA and HLGA were implemented using a slightly modified version of sharing, called continuously updated sharing, which was proposed by the same researchers. With it, the partly filled next generation is taken to calculate the niche count rather than the current generation. Horn and Nafpliotis (1993) introduced this concept in NPGA as well. Furthermore, the guidelines given in (Deb and Goldberg 1989) were used to calculate the niche radius, assuming normalized distance. Since NSGA is the only MOEA under consideration which performs fitness sharing in decision space, two niche radii are specified per test problem. The symbol σshare refers to NSGA the one used by HLGA, FFGA, and NPGA, while σshare gives the niche radius for NSGA.
3.2.2
Elitism In order to investigate the influence of this concept in evolutionary multiobjective search, the elitism mechanism used in SPEA was generalized as described in Section 2.5, and FFGA, NPGA, HLGA, VEGA, and NSGA were implemented on the basis of Algorithm 10. The elitism variants of the algorithms are marked by an asterisk in order to distinguish them from the techniques originally proposed by the corresponding authors. Note that the clustering procedure which is invoked in Algorithm 10 requires a distance metric. In case of NSGA∗ , the distance on the decision space was taken, while the other algorithms used the distance on the objective space.
3.2.3
Reference Algorithms As additional points of reference, two further optimization methods were considered: random sampling and multiple independent sampling. The first algorithm (RAND) randomly generates a certain number of individuals per generation, according to the rate of crossover and mutation (though neither crossover, mutation nor selection are performed). Hence the number of fitness evaluations was the same as for the MOEAs. The second algorithm is an elitist singleobjective EA using the weighting method. In contrast to the other algorithms under consideration, 100 independent runs were performed per test problem,
48
Chapter 3. Comparison of Selected Evolutionary Approaches
each run optimizing towards another randomly chosen linear combination of the objectives. The nondominated solutions among all solutions generated in the 100 runs formed the trade-off front achieved on a particular test problem. Furthermore, three versions of the single-objective EA were used: one with 100 generations per linear combination (SO-1), one with 250 generations (SO-2), and another one that terminated after 500 generations in every single optimization run (SO-5). The other parameters (population size, crossover probability, mutation rate) were the same as for the MOEAs per test problem. 3.2.4
Performance Assessment In case of the MOEAs as well as RAND, altogether 30 independent optimization runs were considered per test problem, where the population was monitored for nondominated solutions and the resulting nondominated set A = T P )) was taken as the outcome of one simulation run (offline perm (∪t=0 p(m t formance). For each algorithm there was a sample of 30 S values respectively for each ordered pair of algorithms there were 30 C values per test problem according to the 30 runs performed. Note that each C value was computed on the basis of the nondominated sets achieved by two algorithms with the same initial population. Moreover, box plots (Chambers, Cleveland, Kleiner, and Tukey 1983) are used to visualize the distribution of these samples. A box plot consists of a box summarizing 50% of the data. The upper and lower ends of the box are the upper and lower quartiles, while a thick line within the box encodes the median. Dashed appendages summarize the spread and shape of the distribution, and dots represent outside values.
3.3
Multiobjective Knapsack Problem
3.3.1
Problem Statement Generally, a 0/1 knapsack problem consists of a set of items, weight and profit associated with each item, and an upper bound for the capacity of the knapsack. The task is to find a subset of items which maximizes the total of the profits in the subset, yet all selected items fit into the knapsack, i.e., the total weight does not exceed the given capacity (Martello and Toth 1990). This SOP can be extended directly to an MOP by allowing an arbitrary number of knapsacks. Formally, the multiobjective 0/1 knapsack problem considered here is defined in the following way: Given a set of n items and a set of k knapsacks, with pi, j = profit of item j according to knapsack i, wi, j = weight of item j according to knapsack i, ci = capacity of knapsack i,
3.3. Multiobjective Knapsack Problem
49
find a vector x = (x1 , x2 , . . . , xn ) ∈ {0, 1}n , such that the capacity constraints ei (xx ) =
n X
wi, j · x j ≤ ci
(1 ≤ i ≤ k)
(3.12)
j =1
are satisfied and for which f (xx ) = ( f 1 (xx ), f 2 (xx ), . . . , f k (xx )) is maximum, where n X fi (xx ) = pi, j · x j (3.13) j =1
and x j = 1 if and only if item j is selected. 3.3.2
Test Data In order to obtain reliable and sound results, nine different test problems were investigated where both the number of knapsacks and the number of items were varied. Two, three, and four objectives were taken under consideration, in combination with 250, 500, and 750 items. Following suggestions in (Martello and Toth 1990), uncorrelated profits and weights were used, where pi, j and wi, j were random integers in the interval [10, 100]. The knapsack capacities were set to half the total weight regarding the corresponding knapsack: ci = 0.5
m X
wi, j
(3.14)
j =1
As reported in (Martello and Toth 1990), about half of the items are expected to be in the optimal solution (of the SOP) when this type of knapsack capacity is chosen. Also more restrictive capacities (ci = 200) were examined where the solutions contain only a few items. 3.3.3
Constraint Handling Concerning the representation of individuals as well as the constraint handling, this work drew upon results published by Michalewicz and Arabas (1994), who examined EAs with different representation mappings and constraint handling techniques on the (single-objective) 0/1 knapsack problem. Concluding from their experiments, penalty functions achieve best results on data sets with capacities of half the total weight; however, they fail on problems with more restrictive capacities. Since both kinds of knapsack capacities were to be investigated, a greedy repair method was implemented that produced the best outcomes among all algorithms under consideration when both capacity types were regarded. In particular, an individual i ∈ {0, 1}n encodes a solution x ∈ {0, 1}n . Since many codings lead to infeasible solutions, the mapping function m (ii ) realizes a simple repair method that decodes an individual i according to the following
50
Chapter 3. Comparison of Selected Evolutionary Approaches
scheme: First, set x = i ; then remove step by step items from x as long as any capacity constraints is violated. The order in which the items are deleted is determined by the maximum profit/weight ratio per item; for item j the maximum profit/weight ratio q j is given by the equation2 � � pi, j n q j = maxi=1 (3.15) wi, j The items are considered in increasing order of the q j , i.e., those achieving the lowest profit per weight unit are removed first. This mechanism intends to fulfill the capacity constraints while diminishing the overall profit as little as possible. 3.3.4
Parameter Settings Independent of the algorithm and the test problem, T , pc , and pm were fixed: Number of generations T : 500 Crossover rate pc (one-point) : 0.8 Mutation rate pm (per bit) : 0.01 Following Srinivas and Deb (1994), the crossover probability was set to a rather high value; the mutation rate was chosen according to Grefenstette (1986). Concerning T , the same value as used in Michalewicz and Arabas (1994) was taken. The remaining parameters were chosen to be dependent on the test problem (see Table 1). Concerning SPEA, N was set to 4/5 and N to 1/4 of the population size given in Table 1, for reasons of fairness. Moreover, the domination pressure tdom , a parameter of NPGA, was determined experimentally. All NPGA simulations were carried out five times, each time using another value for tdom (5%, 10%, 15%, 20%, and 25% of the population size). At the end, the parameter value which achieved the best results for the S measure was chosen per test problem (cf. Table 1).
3.3.5
Experimental Results The following algorithms were compared: RAND, HLGA, NPGA, VEGA, NSGA, SO-1, SO-5, and SPEA. In addition, a slightly modified version of SPEA was examined (SP-S) where P does not participate in the selection phase; there, the population size was the same as for the other EAs, and the size of the external nondominated set was restricted to 1/4 · N . The results concerning the S measure (size of the dominated space) are shown in Figure 11, the direct comparison of the different algorithms based on the C measure (coverage) is depicted in Figure 13. In Figure 12 the trade-off fronts obtained by the EAs in 5 runs are plotted for the two-dimensional problems. As the relative performance of the MOEAs was similar with both kinds of knapsack capacities, only the results concerning the more relaxed capacity type (half the total weight) are presented in the following. 2 This
is a straight-forward extension to the single-objective approach by Michalewicz and Arabas (1994) where q j = p1, j /w1, j .
3.3. Multiobjective Knapsack Problem
Tab. 1:
51
Parameters for the knapsack problem that were adjusted to the problem complexity. knapsacks
2
3
4
parameter 250
items 500
750
N
150
200
250
σshare
0.4924
0.4943
0.4954
NSGA σshare
115
236
357
tdom
7
10
12
N
200
250
300
σshare
0.4933
0.4946
0.4962
NSGA σshare
113
233
354
tdom
30
25
15
N
250
300
350
σshare
0.4940
0.4950
0.4967
NSGA σshare
112
232
352
tdom
50
75
35
Generally, the simulation results prove that all MOEAs do better than the random search strategy. Figure 13 shows that the trade-off fronts achieved by RAND are entirely dominated by the fronts evolved by the other algorithms (with regard to the same population). Concerning the S distributions, the RAND median is less by more than 20 quartile deviations than the medians associated with the EAs when the maximum quartile deviation of all samples is considered. Among the non-elitist MOEAs, NSGA seems to provide the best performance. The median of the S values is for each test problem greater than the corresponding medians of the other three non-elitist MOEAs by more than 5 quartile deviations. In addition, on eight of the nine test problems NSGA weakly dominates more than 70% of the fronts computed by HLGA, NPGA, and VEGA in more than 75% of the runs; in 99% of the runs NSGA weakly dominates more than 50%. In contrast, those three MOEAs weakly dominate less than 10% of the NSGA outcomes in 75% of all runs and less than 25% in 99% of the runs (on eight of the nine problems). For 4 knapsacks and 250 items, the coverage rates scatter more, however, NSGA achieves higher C values in comparison with the other non-elitist MOEAs. Comparing NPGA and VEGA, there is no clear evidence that one algorithm outperforms the other, although VEGA seems to be slightly superior to NPGA. Only on two of the test problems (2 knapsack, 500 and 750 items) do the medians of the S distributions of the two EAs deviate by more than 3 quartile deviations (in favor of VEGA). In the direct comparison based on the C measure, VEGA weakly dominates more than 50% of the NPGA outcomes on average, while NPGA achieves less than 25% coverage regarding VEGA on average. Furthermore, both algorithms generate better assessments in comparison with
52
Chapter 3. Comparison of Selected Evolutionary Approaches 2 knapsacks - 500 items
2 knapsacks - 250 items SO-5 SO-1 SPEA SP-S NSGA VEGA NPGA HLGA
SO-5 SO-1 SPEA SP-S NSGA VEGA NPGA HLGA 8.5 · 107
9.3 · 107
3.3 · 108
3 knapsacks - 250 items SO-5 SO-1 SPEA SP-S NSGA VEGA NPGA HLGA
3.6 · 108
8.1 · 1011
6.4 · 1015
3 knapsacks - 750 items
6.1 · 1012
1.7 · 1013
4 knapsacks - 500 items SO-5 SO-1 SPEA SP-S NSGA VEGA NPGA HLGA
5.2 · 1015
7.5 · 108
SO-5 SO-1 SPEA SP-S NSGA VEGA NPGA HLGA 5.1 · 1012
4 knapsacks - 250 items SO-5 SO-1 SPEA SP-S NSGA VEGA NPGA HLGA
6.9 · 108
3 knapsacks - 500 items SO-5 SO-1 SPEA SP-S NSGA VEGA NPGA HLGA
6.9 · 1011
2 knapsacks - 750 items SO-5 SO-1 SPEA SP-S NSGA VEGA NPGA HLGA
2. · 1013
4 knapsacks - 750 items SO-5 SO-1 SPEA SP-S NSGA VEGA NPGA HLGA
7.4 · 1016
9.5 · 1016
3.6 · 1017
4.6 · 1017
Fig. 11: Distribution of the S values. RAND is not considered here in order not to blur the differences between the MOEAs.
HLGA. With 3 and 4 knapsacks, the fronts produced by HLGA are dominated by the NPGA and VEGA fronts by 99% (cf. Figure 13), and the medians of the S values associated with HLGA are more than 10 quartile deviations less than the S medians related to NPGA and VEGA. For 2 knapsacks, the S distributions are closer together; however, the C measure indicates clear advantages of NPGA and VEGA over HLGA. Moreover, SPEA achieves the best assessments among the MOEAs. It weakly dominates all of the nondominated solutions found by HLGA, NPGA, VEGA, and NSGA with eight of the nine test problems; for 4 knapsacks and 250 items at least 87% are weakly dominated. Vice versa, those algorithms weakly dominate less than 5% of the SPEA outcomes in all 270 runs. Concerning the size of the dominated space, the medians of the S distributions related to SPEA are greater than the corresponding medians of the other MOEAs by more than
3.3. Multiobjective Knapsack Problem
53
2 knapsacks - 250 items 10000
SPEA SO-5 SP-S SO-1 NSGA VEGA NPGA HLGA
9500
9000
8500
8000 8000
8500
9000
9500
2 knapsacks - 500 items
2 knapsacks - 750 items 28000
19500 27000
19000 18500
26000 18000 25000
17500 17000
24000
16500 23000 16000 16500 17000 17500 18000 18500 19000
24000
25000
26000
27000
28000
Fig. 12: Trade-off fronts for two knapsacks regarding the first 5 runs. For better visualization, the points of a front are connected by dashed lines and RAND is not considered here.
10 quartile deviations. These results indicate that elitism is important for the effectiveness of the search, as SP-S also performs substantially worse than SPEA. Nevertheless, SP-S appears to do slightly better than NSGA on the three- and four-dimensional problems. Both the S values (the median distance to NSGA is greater than 3 quartile deviations) and the C values suggest a slight advantage for SP-S over NSGA. For 2 knapsacks, the results are ambiguous and do not allow a final conclusion to be made. Finally, the fact that SO-5 weakly dominates on average more than 90% of the nondominated solutions computed by HLGA, NPGA, VEGA, and NSGA and achieves significantly greater S values (the median is greater by more than 21 quartile deviations than the other medians per test problem) suggests that none of the non-elitist MOEAs converges to the Pareto-optimal front using the
54
Chapter 3. Comparison of Selected Evolutionary Approaches
RAND
HLGA
NPGA
VEGA
NSGA
SO-1
SO-5
SPEA
SP-S
Fig. 13: Box plots based on the C measure. Each rectangle contains nine box plots representing the distribution of the C values for a certain ordered pair of algorithms; the three box plots to the left relate to 2 knapsacks and (from left to right) 250, 500, and 750 items; correspondingly the three middle box plots relate to 3 knapsacks and the three to the right to 4 knapsacks. The scale is 0 at the bottom and 1 at the top per rectangle. Furthermore, each rectangle refers to algorithm A associated with the corresponding row and algorithm B associated with the corresponding column and gives the fraction of B weakly dominated by A (C( A, B)).
3.4. Multiobjective Traveling Salesman Problem
55
chosen parameter settings. This can also be observed in Figure 12. However, as this figure also indicates, SPEA can find solutions that are closer to the Paretooptimal front than those produced by SO-5 in spite of less computation effort. This observation is supported by the fact that SO-5 weakly dominates only 48% of the SPEA front with eight of the nine test problems (SO-1 less than 12%). Taking into account that the outcome of each SPEA run is compared to a front produced in 100 SO-1 (SO-5) runs, it becomes obvious that (elitist) MOEAs have clear advantages over multiple single-objective searches. In the case of SO-1, SPEA had 20 times less computation effort; in the case of SO-5, the computation effort was even 100 times less.
3.4
Multiobjective Traveling Salesman Problem
3.4.1
Problem Statement The general traveling salesman problem (Garey and Johnson 1979) is defined by a number l of cities and a l ×l matrix C = (ci, j ) which gives for each ordered pair (i, j ) of cities the nonnegative distance ci, j to be covered to get from city i to city j . The optimization goal is to find the shortest route for which each city is entered and left exactly once. By adding an arbitrary number of distance matrices, this SOP can be transformed to an MOP. Formally, given l cities and a set {C1 , C2 , . . . , Ck } of l × l matrices with Ch = (ci,h j ), minimize f (π ) = ( f 1 (π ), f 2 (π ), . . . , f k (π )) with fi (π ) =
l−1 X j =1
i i cπ( j ),π( j +1) + cπ(l),π(1)
and where π is a permutation over the set {1, . . . , l}.3 3.4.2
Test Data Altogether, three problem instances were considered with 100, 250, and 500 cities, each having two objectives. The distance matrices were generated at random, where each ci,h j was assigned a random number in the interval [1, 100].
3.4.3
Parameter Settings The experiments were carried out using the following parameter settings: 3 Independently of
this work, Veldhuizen and Lamont (1998a) have presented a slightly different formulation of a two-dimensional multiobjective traveling salesman problem.
56
Chapter 3. Comparison of Selected Evolutionary Approaches 100 cities 6000
5000
4000
SPEA FFGA* FFGA
3000
2000
2500 3000 3500 4000 4500 5000 5500
250 cities
14000
500 cities 27000
13000
26000
12000
25000 24000
11000 23000 10000
22000 21000
9000 9000
10000
11000
12000
13000
21000 22000 23000 24000 25000 26000 27000
14000
Fig. 14: Trade-off fronts for the traveling salesman problem regarding the first 5 runs. The points of one front are connected by dashed lines, and the black dots represent the 5 initial populations.
Number of generations T Population size N Crossover rate pc Mutation rate pm (per individual) Niche radius σshare
: : : : :
500 equal to l (number of cities) 0.8 0.1 0.4886
As with the other test problems, the elitist MOEAs (SPEA and FFGA∗ ) ran with a population size of 4/5 · N and an external set size of 1/4 · N . Concerning the encoding, an individual is a vector of l numbers where each integer from 1 to l appears exactly once. When creating the initial population P 0 , it is assured that only permutations are generated. During the recombination and mutation phases, special order-based genetic operators ensure that the permutation property of individuals is not destroyed. The operators used
3.5. Continuous Test Problems
57
FFGA
FFGA*
SPEA
Fig. 15: Box plots based on the C measure. Each rectangle contains three box plots representing the distribution of the C values for a certain ordered pair of algorithms; the box plot to the left relates to 100 cities, the one in the middle to 250 cities, and the right box plot to 500 cities. The scale is 0 at the bottom and 1 at the top per rectangle. Furthermore, each rectangle refers to algorithm A associated with the corresponding row and algorithm B associated with the corresponding column and gives the fraction of B weakly dominated by A (C( A, B)).
here are uniform order-based crossover and swap mutation (the values of two arbitrary positions within the vector are swapped) (Davis 1991). 3.4.4
Experimental Results With the traveling salesman problem, three MOEAs were investigated: FFGA, FFGA∗ , and SPEA. A clear hierarchy of algorithms emerged, as can be seen in Figures 14 and 15. The fronts achieved by SPEA completely dominate the fronts produced by the other two MOEAs more than 96% of the time, and FFGA∗ clearly outperforms FFGA. It seems a likely supposition that elitism is important here, although fitness assignment plays a major role as well since there is also a performance gap between the two elitist MOEAs.
3.5
Continuous Test Problems
3.5.1
Test Functions for Different Problem Features Deb (1998) has identified several features which may cause difficulties for an MOEA in i) converging to the Pareto-optimal front and ii) maintaining diversity within the population. Concerning the first issue, multimodality, deception, and isolated optima are well-known problem areas in single-objective evolu-
58
Chapter 3. Comparison of Selected Evolutionary Approaches
tionary optimization. The second issue is important in order to achieve a well distributed nondominated front. However, certain characteristics of the Paretooptimal front may prevent an MOEA from finding diverse Pareto-optimal solutions: convexity or non-convexity, discreteness, and non-uniformity. For each of the six problem features mentioned a corresponding test function is constructed following the guidelines in (Deb 1998). This investigation is restricted to only two objectives, in order to investigate the simplest case first. In the author’s opinion, two-dimensional problems already reflect essential aspects of MOPs. Each of the test functions defined below is structured in the same manner and consists itself of three functions f 1 , g, h (Deb 1998, p.15): Minimize subject to where
t (xx ) = ( f 1 (x1 ), f 2 (xx )) f 2 (xx ) = g(x2 , . . . , xn ) · h( f 1 (x1 ), g(x2 , . . . , xn )) x = (x1 , . . . , xn )
(3.16)
The function f 1 is a function of the first decision variable only, g is a function of the remaining n − 1 variables, and h takes the function values of f 1 and g. The test functions differ in these three functions as well as in the number of variables n and in the values the variables may take. Def. 12: Six test functions t 1 , . . . , t 6 are defined following the scheme given in Equa-
tion 3.16: • The test function t 1 has a convex Pareto-optimal front: f 1 (x1 ) = x1 Pn g(x2 , . . . , xn ) = 1 + √ 9 · ( i=2 xi )/(n − 1) h( f 1 , g) = 1 − f 1 /g
(3.17)
where n = 30 and xi ∈ [0, 1]. The Pareto-optimal front is formed with g = 1. • The test function t 2 is the non-convex counterpart to t 1 : f 1 (x1 ) = x1 Pn g(x2 , . . . , xn ) = 1 + 9 · ( i=2 xi )/(n − 1) 2 h( f 1 , g) = 1 − ( f 1 /g)
(3.18)
where n = 30 and xi ∈ [0, 1]. The Pareto-optimal front is formed with g = 1. • The test function t 3 represents the discreteness features: its Pareto-optimal front consists of several non-contiguous convex parts: = x1 f 1 (x1 ) Pn g(x2 , . . . , xn ) = 1 + √ 9 · ( i=2 xi )/(n − 1) h( f1 , g) = 1 − f 1 /g − ( f 1 /g) sin(10π f 1 )
(3.19)
where n = 30 and xi ∈ [0, 1]. The Pareto-optimal front is formed with g = 1. The introduction of the sine function in h causes discontinuity in the Paretooptimal front. However, there is no discontinuity in the objective space.
3.5. Continuous Test Problems
59
• The test function t 4 contains 219 local Pareto-optimal sets and therefore tests for the EA’s ability to deal with multimodality: f 1 (x1 ) = x1 Pn g(x2 , . . . , xn ) = 1 + √ 10(n − 1) + i=2 (xi2 − 10 cos(4π xi )) h( f 1 , g) = 1 − f 1 /g
(3.20)
where n = 10, x1 ∈ [0, 1] and x2 , . . . , xn ∈ [−5, 5]. The global Pareto-optimal front is formed with g = 1 , the best local Pareto-optimal front with g = 1.25. Note that not all local Pareto-optimal sets are distinguishable in the objective space. • The test function t 5 describes a deceptive problem and distinguishes itself from the other test functions in that xi represents a binary string: f 1 (x1 ) = 1P+ u(x1 ) n g(x2 , . . . , xn ) = i=2 v(u(xi )) h( f1 , g) = 1/ f 1
(3.21)
where u(xi ) gives the number of ones in the bit vector xi (unitation), � v(u(xi )) =
2 + u(xi ) if u(xi ) < 5 1 if u(xi ) = 5
� .
and n = 11, x1 ∈ {0, 1}30 and x2 , . . . , xn ∈ {0, 1}5. The true Pareto-optimal front is formed with g = 10, while the best deceptive Pareto-optimal set includes all solutions x for which g(x2 , . . . , xn ) = 11. The global Pareto-optimal front as well as the local ones are convex. • The test function t 6 includes two difficulties caused by the non-uniformity of the objective space: Firstly, the Pareto-optimal solutions are non-uniformly distributed along the global Pareto front (the front is biased for solutions for which f 1 (x1 ) is near one); secondly, the density of the solutions is least near the Pareto-optimal front and highest away from the front: f 1 (x1 ) = 1 − exp(−4x1 ) sin6 (6π x1 ) �0.25 Pn xi )/(n − 1) g(x2 , . . . , xn ) = 1 + 9 · ( i=2 h( f 1 , g) = 1 − ( f 1 /g)2
(3.22)
where n = 10, xi ∈ [0, 1]. The Pareto-optimal front is formed with g = 1 and is non-convex. Each function will be discussed in more detail in Section 3.5.3, where the corresponding Pareto-optimal fronts are visualized as well.
60
Chapter 3. Comparison of Selected Evolutionary Approaches
3.5.2
Parameter Settings Independent of the algorithm and the test function, each simulation run was carried out using the following parameters: Number of generations T Population size N Crossover rate pc (one-point) Mutation rate pm (per bit) NSGA Niche radius σshare and σshare Domination pressure tdom
: : : : : :
250 100 0.8 0.01 0.4886 10
Since NSGA uses fitness sharing in individual space on t 5 , a different value NSGA σshare = 34 was chosen for this particular case. Concerning NPGA, the recommended value for tdom = 10% of the population size was taken (Horn and Nafpliotis 1993). Furthermore, SPEA as well as the elitist variants of the MOEAs ran with a population size of 80 where the external nondominated set was restricted to 20. Regarding the encoding of the decision vector, an individual is a bit vector where each parameter xi is represented by 30 bits; the parameters x2 , . . . , xm only comprise 5 bits for the deceptive function t 5 . 3.5.3
Experimental Results In Figures 16 to 21, the nondominated sets achieved by RAND, FFGA, NPGA, HLGA, VEGA, NSGA, SO-2, and SPEA are visualized in the objective space. Per algorithm and test function, the outcomes of the first five runs were unified, and then the dominated solutions were removed from the union set; the remaining points are plotted in the figures. Also shown are the Pareto-optimal fronts (lower curves) as well as additional reference curves (upper curves). The latter curves allow a more precise evaluation of the obtained trade-off fronts and were calculated by adding 0.1 · | max{ f 2 (xx )} − min{ f 2 (xx )}| to the f 2 values of the Pareto-optimal points. However, the curve resulting for the deceptive function t 5 is not appropriate here, since it lies above the fronts produced by the random search algorithm. Instead, all solutions x with g(x2 , . . . , xn ) = 2·10 are considered, i.e., for which the parameters are set to the deceptive attractors. In addition to the graphical presentation, the different algorithms were assessed in pairs using the C metric which is shown in Figure 22. There, the shortcut REFS stands for reference set and represents for each test function a set of 100 equidistant points which are uniformly distributed on the corresponding reference curve. As with the knapsack problem, all MOEAs do better than RAND. However, the box plots reveal that HLGA, NPGA, and FFGA do not always dominate the randomly created trade-off front completely. Furthermore, it can be observed that NSGA clearly outperforms the other non-elitist MOEAs regarding both distance to the Pareto-optimal front and distribution of the nondominated solutions. This confirms the results presented in Section 3.3. Furthermore, it is remarkable that VEGA performs well compared to NPGA and FFGA, although some
3.5. Continuous Test Problems
61
4
SPEA SO-2 NSGA
3
VEGA f2
HLGA
2
NPGA FFGA
1
RAND
0 0
0.2
0.4
0.6
0.8
1
f1
Fig. 16: Test function t 1 (convex).
4
SPEA SO-2 NSGA
3
VEGA f2
HLGA
2
NPGA FFGA
1
RAND
0 0
0.2
0.4
0.6 f1
Fig. 17: Test function t 2 (non-convex).
0.8
1
62
Chapter 3. Comparison of Selected Evolutionary Approaches
4
SPEA SO-2 3
NSGA VEGA f2 2
HLGA NPGA
1
FFGA RAND
0
0
0.2
0.4
0.6
0.8
f1
Fig. 18: Test function t 3 (discrete).
40
SPEA SO-2 30
NSGA VEGA
f2
HLGA
20
NPGA FFGA
10
RAND
0 0
0.2
0.4
0.6 f1
Fig. 19: Test function t 4 (multimodal).
0.8
1
3.5. Continuous Test Problems
63
SPEA 6
SO-2 NSGA
f2
VEGA
4
HLGA NPGA 2
FFGA RAND
0 0
5
10
15 f1
20
25
30
Fig. 20: Test function t 5 (deceptive).
8
SPEA SO-2
6
NSGA VEGA f2 4
HLGA NPGA FFGA
2
RAND
0 0.3
0.4
0.5
0.6
0.7 f1
Fig. 21: Test function t 6 (non-uniform).
0.8
0.9
1
64
Chapter 3. Comparison of Selected Evolutionary Approaches
RAND
FFGA
NPGA
HLGA
VEGA
NSGA
SO-2
SPEA
REFS
Fig. 22: Box plots based on the C metric. Each rectangle contains six box plots representing the distribution of the C values for a certain ordered pair of algorithms; the leftmost box plot relates to t 1 , the rightmost to t 6 . The scale is 0 at the bottom and 1 at the top per rectangle. Furthermore, each rectangle refers to algorithm A associated with the corresponding row and algorithm B associated with the corresponding column and gives the fraction of B weakly dominated by A (C( A, B)).
3.5. Continuous Test Problems
65
serious drawbacks of this approach are known (Fonseca and Fleming 1995b). The reason for this might be that here the offline performance is considered in contrast to other studies which examine the online performance (Horn and Nafpliotis 1993; Srinivas and Deb 1994). Finally, the best performance is provided by SPEA. Apart from t 5 , it even outperforms SO-2, in spite of substantially lower computational effort and although SO-2 uses an elitist strategy as well. Considering the different problem features separately, convexity seems to cause the least amount of difficulty for the MOEAs. All algorithms evolved reasonably distributed fronts, although there was a difference in the distance to the Pareto-optimal set. On the non-convex test function t 2 , however, HLGA, VEGA, and SO-2 have difficulties finding intermediate solutions, which is in accordance with the discussion in Section 1.2.1. Pareto-based algorithms have advantages here, but only NSGA and SPEA evolved a sufficient number of nondominated solutions. In the case of t 3 (discreteness), HLGA and VEGA are superior to both FFGA and NPGA. While the fronts achieved by the former weakly dominate about 25% of the reference set on average, the latter come up with 0% coverage. Among the considered test functions, t 4 and t 5 seem to be the hardest problems, since none of the algorithms was able to evolve a global Pareto-optimal set. The results on the multimodal problem indicate that elitism is helpful here; SPEA is the only algorithm which found a widely distributed front. Remarkable is also that NSGA and VEGA outperform SO-2 on t 4 . Again, comparison with the reference set reveals that HLGA and VEGA (100% coverage) surpass NPGA (50% coverage) and FFGA (0% coverage). Concerning the deceptive function, SO-2 is best, followed by SPEA and NSGA. Among the remaining MOEAs, VEGA appears to be preferable here, weakly dominating about 20% of the reference set, while the others weakly dominate 0% in all runs. Finally, it can be observed that the biased search space together with the non-uniform represented Pareto-optimal front (tt 6 ) makes it difficult for the MOEAs to evolve a well-distributed nondominated set. This also affects the distance to the global optimum, as even the fronts produced by NSGA do not dominate any of the points in the reference set. 3.5.4
Influence of Elitism With all test problems investigated in this work, SPEA turned out to be superior to the other MOEAs under consideration. This observation leads to the question of whether elitism would increase the performance of the non-elitist MOEAs. The experiments concerning the traveling salesman problem showed this holds for FFGA on this particular problem. For a deeper investigation of this matter, VEGA∗ , HLGA∗ , FFGA∗ , NPGA∗ , and NSGA∗ , ran on the test functions using the same parameters as SPEA. The results for t 1 and t 2 are shown in Figure 23 respectively 24. Obviously, elitism is helpful on these two functions, although the visual presentation has to be interpreted with care as only five runs are considered. For instance, NSGA∗ and SPEA seem to perform equally well here using those particular parameter
66
Chapter 3. Comparison of Selected Evolutionary Approaches
2
SPEA 1.5
SO-2 NSGA*
f2
VEGA*
1
HLGA* NPGA* 0.5
FFGA* RAND
0 0
0.2
0.4
0.6
0.8
1
f1
Fig. 23: Results on test function t 1 (convex) using elitism.
2
SPEA 1.5
SO-2 NSGA*
f2
VEGA*
1
HLGA* NPGA* 0.5
FFGA* RAND
0 0
0.2
0.4
0.6
0.8
f1
Fig. 24: Results on test function t 2 (non-convex) using elitism.
1
3.5. Continuous Test Problems
FFGA
67
NPGA
HLGA
VEGA
NSGA
C(A∗ , A)
C(A, A∗ )
Fig. 25: Box plots comparing each non-elitism algorithm A with its elitism-variant A∗ .
settings. Moreover, the figures indicate that elitism can even help MOEAs to surpass the performance of a weighted-sum single-objective EA in spite of significantly lower computation effort. However, both test functions and the metric used are not sufficient here to also compare the elitist variants with each other. Testing different elitist strategies and different elitist MOEAs on more difficult test functions is an interesting subject of future research in this field. Nevertheless, each algorithm was compared with its elitist variant based on the C metric. As can be seen in Figure 25, elitism appears to be an important factor to improve evolutionary multiobjective optimization. Only in one case (NSGA on the deceptive problem) was the performance of the elitist variant worse than the non-elitist version. Investigation of this matter will also be an important part of an elitism study. 3.5.5
Influence of Population Size On two test functions (tt 4 and t 5 ), none of the algorithms under consideration was able to find a global Pareto-optimal set regarding the chosen parameters. Therefore, several runs were performed in order to investigate the influence of the population size as well as the maximum number of generations converging towards the Pareto-optimal front. In Figures 26 and 27, the outcomes of multiple NSGA runs are visualized. On the deceptive test function t 4 , NSGA found a subset of the globally optimal solutions using a population size of 1000. In contrast, t 5 seems to be a difficult test problem, since even a population size of 10000 was not sufficient to converge to the optimal trade-off front after 250 generations. This did also not change when the maximum number of generations was increased substantially (T = 10000). In the later case, the resulting front was (using a population size of 500) almost identical to the one achieved by NSGA∗ running 1000 generations. However, the incorporation of elitism finally enabled NSGA to find a global Pareto-optimal set after 10000 generations. In summary, it can be said that the choice of the population size strongly
68
Chapter 3. Comparison of Selected Evolutionary Approaches
7
N: 100 T: 250
6
N: 250 T: 250
5
N: 500 T: 250 4
N: 1000 T: 250
f2
N: 5000 T: 250
3
N: 10000 T: 250
2
N: 500 + elitism T: 1000 1
N: 500 + elitism T: 10000
0 0
0.2
0.4
0.6
0.8
1
f1
Fig. 26: Comparison of different population sizes on test function t 4 using NSGA.
5
N: 100 T: 250
4
N: 250 T: 250 N: 500 T: 250
3
N: 1000 T: 250
f2
N: 5000 T: 250
2
N: 10000 T: 250 N: 500 + elitism T: 1000
1
N: 500 + elitism T: 10000 0 0
5
10
15 f1
20
25
30
Fig. 27: Comparison of different population sizes on test function t 5 using NSGA.
3.6. Key Results
69
influences the MOEA’s capability to converge towards the Pareto-optimal front. Obviously, small populations do not provide enough diversity among the individuals. Increasing the population size, however, does not automatically yield an increase in performance, as can be observed with the multimodal function. The same holds for the number of generations to be simulated. Elitism, on the other hand, seems to be an appropriate technique to prevent premature convergence. Even after 1000 generations, better solutions, and finally Pareto-optimal solutions, evolved with t 4 .
3.6
Key Results A systematic comparison of different MOEA implementations has been carried out on several test problems. Major results are: • The two quantitative performance measures used were found to be sufficient to show the performance differences among different MOEAs. On the basis of these measures, it was possible to provide extensive comparisons taking a large number of optimization runs into account in contrast to most comparative studies available. Moreover, further performance measures which allow more accurate investigations have been proposed. • The suggested test problems provide sufficient complexity to compare multiobjective optimizers. With all functions, differences in performance could be observed among the algorithms under consideration. Regarding particular problem features, multimodality and deception seem to cause the most difficulty for evolutionary approaches. However, non-convexity is also a problem feature which mainly weighted-sum based algorithms appear to have problems with. • In contrast with what was suspected beforehand, a hierarchy of algorithms emerged regarding the distance to the Pareto-optimal front in descending order of merit: 1. SPEA 2. NSGA 3. VEGA 4. NPGA, HLGA 6. FFGA While there is a clear performance gap between SPEA and NSGA as well as between NSGA and the remaining algorithms, VEGA, HLGA, NPGA, and FFGA are rather close together. However, the results indicate that VEGA might be slightly superior to the other three MOEAs, while the situation concerning NPGA and HLGA is ambiguous: NPGA achieves better assessments on the knapsack problem; on the continuous test functions HLGA provides slightly
70
Chapter 3. Comparison of Selected Evolutionary Approaches
better performance. Regarding FFGA, its rank has to be interpreted carefully, as it has not been tested on the knapsack problem and another selection scheme was incorporated, the influence of which must not be disregarded. Finally, random search performed much worse than the MOEAs. • Elitism is an important factor in evolutionary multiobjective optimization. This statement is supported by the fact that SPEA i) clearly outperforms the other MOEAs and ii) is the only method among the ones under consideration which incorporates elitism as a central part of the algorithm. In addition, the performance of the other algorithms improved significantly when SPEA’s elitist strategy was included. This result agrees with the one presented by Parks and Miller (1998), who showed for a pressurized water reactor reload design problem that NSGA performs substantially better when using elitism. • In the case of two objectives, SPEA was found to be superior to the weighting method using a single-objective EA despite 100 times less computation effort (regarding the distance to the Pareto-optimal front). This observation indicates that elitist MOEAs can find better solutions in one simulation run than traditional approaches in several runs. With more objectives, further investigations are necessary to draw a final conclusion, as neither algorithm could be said to be better. But also here, SPEA found several solutions in each run that were not generated by the single-objective EA in 100 runs. Recently, further comparative studies based on quantitative techniques have been published. Veldhuizen (1999) compared four MOEA implementations on six test functions using a set of six performance metrics. Knowles and Corne (1999a, 1999b) implemented the performance assessment method described in (Fonseca and Fleming 1996) in order to compare NPGA, NSGA, and PAES, an MOEA proposed by the authors. Shaw, Fonseca, and Fleming (1999) demonstrated a statistical method for performance assessment, which is based on (Fonseca and Fleming 1996) as well, on the 0/1 knapsack problem presented in Section 3.3; there, a weighted-sum MOEA is compared with a Pareto-based MOEA. Using the same technique, four implementations of an MOEA were tested on a batch process scheduling problem in (Shaw et al. 1999).
Part II Applications
4 System Synthesis The first application is a complex problem in the domain of computer engineering that is concerned with the automated synthesis of heterogeneous hardware/software systems. Given a system specification, the task is to find the Pareto-optimal set among all feasible implementations, typically with regard to the two optimization criteria cost and performance. This so-called design space exploration allows the engineer to arrive at a final implementation which best fits the market requirements. In addition, it can help to reduce the risk and to shorten the time-to-market of new products. Blickle et al. (1996, 1997, 1998) have presented an evolutionary approach to this problem which is used here as the starting-point for an implementation based on SPEA. Their MOEA is described in Section 4.2 after the problem statement in Section 4.1. On the basis of a video codec example, their implementation and the SPEA implementation are compared; and the influence of a further objective, power consumption, is investigated in the last section.
4.1
Problem Description Blickle, Teich, and Thiele (1998) consider system-level synthesis as the problem of optimally mapping a task-level specification onto a heterogeneous hardware/software architecture. This model is outlined in the following; however, for further reaching information the reader is referred to the original publication.
4.1.1
Specification Model The specification of a system consists of three components:
74
Chapter 4. System Synthesis
RISC
1 2
S(1) = 1
1
S(2) = 5
2
RISC
BUS 1
BUS 1 S(3) = 12
3
S(4) = 15
4
S(5) = 5
5
S(6) = 19
6
ASIC
S(7) = 22
7
M
GA
S
B
A
mapping set
architecture graph
schedule
binding
allocation
3 DSP
4 5
DSP
BUS 2 6 7
GV problem graph
BUS 2
ASIC
Fig. 28: Illustration of the problem of system-level synthesis (slightly modified example from (Blickle 1996)). On the left, a system specification is visualized consisting of problem graph, mapping set, and architecture graph. On the right, a possible implementation is shown where allocation and binding are emphasized by thick lines.
1. A behavioral description of a hardware/software system to synthesize. The behavior is defined by a acyclic directed graph G P = (V P , E P ), the problem graph, where the nodes v ∈ V P stand for functional objects like algorithms, tasks, procedures, or processes and the edges e ∈ E P represent data interdependencies of the functional objects. 2. A structural specification of the system (= a class of possible architectures) given by a directed graph G A = (V A , E A ), the architecture graph. Structural objects are general- or special- purpose processors, ASICs, buses, and memories, which are represented by the nodes v ∈ V A . The edges e ∈ E A model connections between them. 3. A set M ⊆ V P × V A which specifies the space of possible mappings. When (a, b) ∈ M, the task a ∈ V P can be mapped to, i.e., executed on, the resource b ∈ V A , otherwise not. Note that for each a ∈ V P there has to be at least one pair (a, ·) ∈ M. An example for a system specification is depicted in Figure 28 on the left. The problem graph consists of seven functional objects where shaded nodes stand for communication operations. The architecture graph includes a RISC processor, a digital signal processor (DSP), and an application-specific inte-
4.1. Problem Description
75
grated circuit (ASIC) which are interconnected by two buses. The mapping set M is represented by the dashed arrows from the functional to the structural objects and contains 17 pairs (a, b) ∈ V P × V A . For instance, task 7 can be mapped to any chip, while task 1 has to be executed on the RISC processor. 4.1.2
Implementation Model Given a system specification, an implementation, i.e., a mapping of this specification onto a hardware/software architecture, is described by a triple (A, B, S): 1. An allocation A ⊆ V A which is a set of the selected structural objects; A defines the architecture. 2. A binding B ⊆ M which binds each task a ∈ V P to a resource b ∈ V A ; B maps the problem graph onto the architecture. 3. A schedule S ∈ S ∗ which assigns each task v ∈ V P a nonnegative integer S(v); S(v) is the start time of the execution of v. The set of all possible schedules is denoted as S ∗ . Thus, the decision space X is defined as X = 2(V A ∪E A ) × 2 M × S ∗ , where 2 Z denotes the power set of a set Z . The feasible set X f ⊆ X is usually substantially smaller than X and contains all implementations (A, B, S) that satisfy the following criteria: • The task set V P is unambiguously mapped onto the allocated resources, i.e., |B| = |V P |, {a | (a, ·) ∈ B} = V P and {b | (·, b) ∈ B} = A. • Each communication can be handled, i.e., two communicating tasks a, a 0 ∈ V P with (a, a 0 ) ∈ E P and (a, b), (a 0 , b0) ∈ B are either mapped onto the same resource (b = b0 ) or there is a directed connection (b, b0 ) ∈ E A between the corresponding resources b and b0 . • The schedule is deadlock free, i.e., for each task a ∈ V P all predecessors a 0 ∈ V P with (a 0 , a) ∈ E P have finished before a starts: S(a 0 )+ R(a 0 ) ≤ S(a) where R(a 0 ) denotes the (implementation dependent) run-time of task a 0 . • At any point in time, at most one task is executed on each resource, i.e., all tasks a, a 0 ∈ V P with (a, b), (a 0 , b) ∈ B have non-overlapping execution times: S(a 0 ) + R(a 0 ) ≤ S(a) ∨ S(a) + R(a) ≤ S(a 0 ). On the right-hand side of Figure 28, a sample implementation is shown for the specification discussed above. All computing resources except BUS 2 are selected, thus all communications are handled by BUS 1 (this is also reflected by the binding that maps the communication nodes 2, 4, and 6 to Bus 1). An infeasible implementation would emerge if task 2 would be mapped to the RISC processor; then the communication between tasks 2 and 3 could not be realized.
76
Chapter 4. System Synthesis
4.1.3
Optimization Task Basically, the specification and the implementation models are independent of the optimization criteria. Thus, various metrics can be defined: cost, performance, power dissipation, capacity usage, etc. Blickle, Teich, and Thiele (1998) consider the two objectives cost and latency using the following model: • With each structural object v ∈ V A a fixed cost C(v) is associated that arises when the particular resource is realized. The cost of an implementation is equal to the total cost of the allocated resources. • A latency function L gives the estimated time L(a, b) that is necessary to execute task a ∈ V P on resource b ∈ V A , i.e., R(a) = L(a, b). The latency of an implementation is defined as the earliest point in time by which all tasks have been executed. The resulting MOP can be formulated as minimize subject to where
f (A, B, S) = (P f 1 (A, B, S), f 2(A, B, S)) f 1 (A, B, S) = v∈V A C(v) f 2 (A, B, S) = max{S(a) + L(a, b) | (a, b) ∈ B} (A, B, S) ∈ X f
(4.1)
The first objective f 1 reflects the total cost, while f 2 gives the latency of the implementation.
4.2
Implementation In (Blickle, Teich, and Thiele 1998) a hybrid approach to the problem of systemlevel synthesis is proposed. An EA is used to determine the allocation and the binding, because the search space for these two subproblems is large and discrete and in addition the determination of a feasible binding is NP-complete (Blickle 1996). In contrast, scheduling is a well-known problem which has been extensively studied and for which good heuristics are available. Hence, this subproblem is solved by means of a deterministic method on the basis of allocation and binding. This makes the complexity of the search space manageable. The overall algorithm is fully detailed in Section 4.2.2. Preceding this discussion, the coding and decoding of hardware/software implementations as well as the genetic operators used are described.
4.2.1
Representation and Genetic Operators Each individual encodes both allocation and binding, whereas the schedule is computed deterministically by a heuristic list-scheduling algorithm incorporating software pipelining. An allocation is represented by a bit vector of length |V A | which defines for each structural object whether it is selected or not. In
4.2. Implementation
77
mapping function m
individual i
allocation A
allocation vector binding lists
implementation (A,B,S)
1 repair allocation
binding B updated allocation
schedule S
repaired allocation 3 update allocation binding 2 compute binding
4 heuristic list scheduler
Fig. 29: Illustration of the individual space to decision space mapping. Each individual consists of two parts, an allocation vector and a set of binding lists. In the first step of the decoding process, a repaired allocation is computed on the basis of the allocation vector. Afterwards, the binding lists as well as the repaired allocation are used in order to determine the binding. As not all allocated resources may be assigned a task, the allocation is updated in the next step. Finally, a list-scheduling heuristic calculates a schedule corresponding to the binding. Note that in Step 2 a feasible binding is not necessarily found.
order to reduce the number of infeasible solutions, allocations are partially repaired by a heuristic whenever an individual is decoded. For the same reason, bindings are not encoded directly by a bit vector but rather indirectly using several lists: the first list, which represents a permutation of all functional objects in the problem graph, determines the order in which the tasks are mapped to the computing resources with respect to the repaired allocation. Further lists, permutations of the set of resources, define separately for each task which resource is to be checked next for mapping. Based on the decoded binding, the list scheduler computes the final schedule. The relation between individuals and implementations as well as the decoding algorithm are depicted in Figure 29. Since allocation and binding are represented differently, they have to be treated separately in the recombination and mutation phases. Concerning the allocation, uniform crossover (Syswerda 1989) and bit-flip mutation were chosen. For bindings lists, uniform order-based crossover and swap mutation (Davis 1991) ensure that the permutation property is preserved. 4.2.2
Fitness Assignment and Selection Blickle, Teich, and Thiele (1998) used the same Pareto ranking method as Fonseca and Fleming (1993) (cf. Algorithm 4). For the purpose of a diverse population, a crowding technique called restricted tournament selection (Harik 1995) was incorporated. The algorithm is in the following referred to as BTTA.
78
Chapter 4. System Synthesis
Alg. 11: (Blickle, Teich, and Thiele’s Multiobjective Evolutionary Algorithm)
Input:
Output:
N T pc pm w A
(population size) (maximum number of generations) (crossover probability) (mutation rate) (window size for restricted tournament selection) (nondominated set)
Step 1: Initialization: Set t = 0 and generate the initial population P 0 according to Step 1 of Algorithm 1. Step 2: Set P 0 = P t . For i = 1, . . . , N /2 do a)
Selection for reproduction: Select two individuals i , j ∈ P 0 at random.
b)
Recombination: Recombine i and j ; the resulting children are k and l . With probability pc set i 0 = i and j 0 = j , otherwise i 0 = k and j 0 = l .
c)
Mutation: Mutate i 0 and j 0 with mutation rate pm . The resulting individuals are i 00 and j 00 .
d)
Replacement: Call Algorithm 12 with parameters J = {ii 00 , j 00 }, P 0 , and w. The population P 00 is returned. Set P 0 = P 00 .
Step 3: Termination: Set P t+1 = P 0 and t = t + 1. If t ≥ T or another stopm (P P t )) else go to Step 2. ping criterion is satisfied then set A = p(m Alg. 12: (Restricted Tournament Selection)
Input:
Output:
J P0 w P 00
(multi-set of individuals) (current population) (window size) (updated population)
Step 1: Set P 00 = P 0 . For each j ∈ J do a)
Select a set K of w individuals from P 00 at random.
b)
Determine individual k ∈ K with minimum distance to the candidate j : ∀ll ∈ K : d( j , l ) ≥ d( j , k ).
c)
If |{ii ∈ P 00 | i ≺ j }| < |{ii ∈ P 00 | i ≺ k }| then replace k by j : P 00 − {kk }) + { j }. P 00 = (P
The distance function d in Algorithm 12 is defined as the number of different binding pairs: d(ii , j ) = |B \ B 0| where m (ii ) = (A, B, S) and m ( j ) = (A0 , B 0, S 0 ). If (A, B, S) or (A0 , B 0, S 0 ) is infeasible, then d(ii , j ) = 0. Furthermore, individuals representing infeasible solutions are assigned the objective vector (∞, ∞) when checking for domination in Step 1c of Algorithm 12.
4.3. Case Study: Video Codec
4.3
Case Study: Video Codec
4.3.1
Comparison of Three Evolutionary Techniques
79
The synthesis of a video codec, based on the H.261 standard (Blickle 1996, Chapter 9), was chosen as a sample application in order to compare the BTTA implementation (Algorithm 11), a SPEA implementation, and an EA using the constraint method (cf. Section 1.2.2) on the system synthesis problem. With this application, the search space contains about 1.9 · 1027 possible bindings. The SPEA implementation corresponds to Algorithm 7 on page 33 where the representation, the mapping function m , and the genetic operators (cf. Section 4.2.1) as well as the objective functions (cf. Section 4.1.3) were the same as with BTTA and the single-objective EA. All three algorithms used the parameters chosen in (Blickle 1996); there, different parameter values were investigated experimentally: Population size N Number of generations T Crossover rate pc Mutation rate pm (per individual)
: : : :
30 100 0.5 0.2
Regarding SPEA, the population size N was set to 20 and the external set size N to 10. BTTA ran with a window size of w = 20 (parameter for restricted tournament selection). Furthermore, 10 independent runs were performed in the case of BTTA and SPEA; the solutions nondominated among all the solutions generated in the 10 runs were taken as the outcome of the two MOEAs. In contrast, 22 different SOPs were considered in the case of the constraint EA: 11 SOPs which minimize cost under different latency constraints and 11 SOPs which minimize latency under different cost constraints. For each SOP, the best result out of 10 independent runs (100 generations each) was taken, and the nondominated solutions of all 22 single-objective results constituted the final nondominated set. As can be seen in Table 2, SPEA weakly dominates 100% and dominates 50% of the solutions found by BTTA. Although the offline performance over 10 runs is considered here, the situation was similar when comparing distinct runs directly. Regarding the constraint method, SPEA weakly dominates 100% and dominates 33% of the nondominated set achieved by this algorithm. This shows again that (elitist) MOEAs have advantages over the classical methods: despite 22 times less computation effort, SPEA found better solutions than the constraint EA. Moreover, Blickle (1996) reported that BTTA achieved the same front as the constraint EA (Table 2, middle row) when the computation time was increased (N = 100 and T = 200). The fact that independently of the algorithm and the parameters only six nondominated solutions were generated indicates that the Pareto-optimal set seems to be rather small (although there is no evidence that the best front, which was found by SPEA, is the Pareto-optimal front).
80
Chapter 4. System Synthesis
Tab. 2:
Video Codec: Nondominated fronts found by the three different methods. In each column, the pairs marked by a surrounding box represent solutions that are dominated by any solution produced by the two other algorithms. The outcomes of the constraint EA are taken from (Blickle 1996, p. 203). SPEA (180,166) (230,114) (280,78) (330,48) (340,36) (350,22)
4.3.2
constraint EA (180,166) (230,114) (280,78) (330,54) (340,42) (350,22)
BTTA (180,166) (230,114) (280,78) (330,54) (350,23) (370,22)
Trading-Off Cost, Latency, and Power Consumption Besides cost and latency, power consumption becomes increasingly important in the design process of hardware/software systems like, e.g., cellular phones. In order to incorporate this criterion into the model proposed by (Blickle, Teich, and Thiele 1998), two additional functions are introduced in the specification: 1. P(v) gives for each structural object v ∈ V A in the architecture graph the estimated power consumption in the idle state, i.e., when no task is executed. 2. P(a, b) defines for each functional object a ∈ V P the additional power consumption affected by the execution of a on the computing resource b ∈ V A . Based on these two functions, a third objective, power consumption, can be added to the problem formulation in Section 4.1.3: ! X X f 3 (A, B, S) = P(v) + P(a, b) v∈A
(a,b)∈B
Again, the video codec was taken as a sample application. Figure 30 depicts the nondominated front produced in a single SPEA run (N = 100, N = 100, T = 200) with regard to the three objectives cost, latency, and power consumption. Some interesting trade-off solutions are also listed in Table 3 with regard to three cost categories. First of all, it is remarkable that the number of solutions in the nondominated set increases significantly by introducing a third objective (34 in comparison with 6 in the two-dimensional case). The same situation arose with the knapsack problem in Section 3.3. This is also in accordance to what other researchers observed on real-world applications (Fonseca and Fleming 1995b). Furthermore, the obtained trade-off front well reflects the conflicts between the objectives. The cheapest solution provides the lowest performance at maximum power dissipation (cost: f 1 = 180, latency: f 2 = 166, power consumption: f 3 = 299); as can be seen in Figure 31 on
4.3. Case Study: Video Codec
81
350 300 250 power consumption 200 150 1000 200 50 300 100 latency
400
cost
150 500 200
Fig. 30: Three-dimensional trade-off front for the video codec.
the top, it consists of a general-purpose RISC processor, two I/O devices, and a slow memory module connected by a slow bus. In contrast, the fastest solution (Figure 31 on the bottom), which includes several specialized computing resources and a fast bus, causes the maximum cost at medium power dissipation (cost: f 1 = 520, latency: f 2 = 22, power consumption: f 3 = 218). A good compromise solution could be the one represented by the objective vector ( f 1 , f 2 , f 3 ) = (360, 42, 154): low power dissipation and good performance at medium cost. It differs from the fastest solutions in that it uses a slower bus and the subtraction/adder module instead of the faster digital signal processor, cf. Figure 31. The bindings and the schedules of the three implementations discussed here are depicted in Figure 32. These illustrations show the bottlenecks of the alter-
Tab. 3:
Some of the nondominated solutions found by SPEA during one optimization run. The pairs marked by a surrounding box represent the solutions that are shown in Figures 31 and 32. low cost (180,166,299) (230,114,125) (250,114,120) (280,81,133) (290,78,164)
medium cost (300,81,128) (310,78,159) (330,48,244) (360,42,154) (390,32,161)
high cost (400,23,219) (410,32,156) (420,23,214) (500,22,231) (520,22,218)
82
Chapter 4. System Synthesis
native solutions. For the cheapest implementation, the RISC processor essentially determines the latency. The bottleneck of the fastest solution is the block matching module, while the bus restricts the performance of the compromise solution.
4.3. Case Study: Video Codec
Cost: 180
83
Latency: 166
Power Consumption: 299
INM
input module
shared bus single port memory module
DPFM
SBF
RISC2
programmable RISC processor
(slow) output module
OUTM
Cost: 360
Latency: 42
INM
input module
Power Consumption: 154
SAM
subtraction/adder module
BMM
block matching module
DCTM
module for DCT/IDCT operations
shared bus dual port memory module
DPFM
SBF (medium)
output module
OUTM
HC
Cost: 520
input module
Latency: 22
INM
Huffman coder
Power Consumption: 218
DSP
digital signal processor
BMM
block matching module
DCTM
module for DCT/IDCT operations
shared bus dual port memory module
DPFM
SBF (fast)
output module
OUTM
HC
Fig. 31: Architectures of three alternative implementations.
Huffman coder
84
Chapter 4. System Synthesis
Cost: 180
Latency: 166
Power Consumption: 299
Cost: 360
Latency: 42
Power Consumption: 154
Cost: 520
Latency: 22
Power Consumption: 218
Fig. 32: Gantt charts of three alternative implementations; the corresponding architectures are depicted in Figure 31. Each Gantt chart visualizes the selected computing resources (allocation A), the mapping of functional objects to structural objects (binding B), and the schedule S of a particular implementation ( A, B, S). Note that the transmission tasks, which are mapped to the I/O devices INM and OUTM as well as the memory modules (FM, DPFM), are not shown as they are assumed to take zero time due to the small amount of data to be transferred, cf. (Blickle 1996, p.195).
5 Software Synthesis The automatic synthesis of software implementations for programmable digital signal processors (PDSPs) is the second application considered here. As with the system synthesis problem, the specification is based on a graph-oriented model where the nodes represent computations and the edges the flow of data. Concerning the optimization criteria, three implementation metrics are crucial with many digital signal processing (DSP) systems: program memory requirement, data memory requirement, and execution time. The complexity of this problem arises not only from the number of objectives involved but also from the fact that the size of the search space can be exponential in the size of the specification graph. This prevents techniques based on enumeration from being applicable. Instead, the complexity is often reduced by focusing on only one objective and restricting the search to a subclass of all possible software implementations. Deterministic algorithms (heuristics or optimization methods) are usually used to solve the resulting SOP. Here, EAs are taken as the underlying optimization technique due to two reasons: • The market of DSP applications is driven by tight cost and performance constraints; thus, code-optimality is often critical (Marwedel and Goossens 1995). • Frequently, DSP systems are programmed once to run forever; hence, optimization and exploration times in the order of minutes, hours, or even days are neglectable. The motivation was to develop a methodology that can exploit increased tolerance for long compile time to significantly improve results produced by state of the art algorithms. In the first step, an EA was compared with existing heuristics on the SOP for minimizing the data memory requirement of program-memory
86
Chapter 5. Software Synthesis
optimal software implementations. As the results were promising, the EA implementation was extended to perform a multiobjective optimization with regard to the three objectives mentioned above. This was the first time the trade-offs between these optimization criteria could be investigated for arbitrary software implementations. This chapter is divided into three parts. The first part (Section 5.1) comprises a description of both the specification model and the implementation model used. In the second part (Section 5.2), the single-objective EA for minimizing the data memory requirement is presented and compared to several alternative algorithms. The last part (Section 5.3) is devoted to design space exploration. In particular, the trade-off fronts for different well-known PDSPs are analyzed for a sample rate conversion system, and furthermore two MOEA implementations (SPEA and NPGA) are compared on nine practical DSP applications.
5.1
Synchronous Data Flow Synchronous data flow (SDF) is a restricted form of data flow by which an important class of DSP algorithms can be represented (Bhattacharyya, Murthy, and Lee 1996). With it, a DSP system is described by a directed graph where the nodes called actors stand for functional components and the edges represent interactions between them. Furthermore, for each edge it is specified how many data values called tokens are i ) initially on it and ii) written to and read from it by the interconnected DSP subsystems. The SDF model is used in industrial DSP design tools, e.g., SPW by Cadence, COSSAP (now) by Synopsys, as well as in research-oriented environments, e.g., Ptolemy (Buck, Ha, Lee, and Messerschmitt 1994), GRAPE (Lauwereins, Engels, Peperstraete, Steegmans, and Ginderdeuren 1990), and COSSAP (Ritz, Pankert, and Meyr 1992).
5.1.1
Background and Notation
Def. 13: (SDF graph) An SDF graph G = (V, E) is a directed graph in which each
edge e = (v, v 0) ∈ E ⊆ V × V has three attributes:
• delay(e) gives the number of initial tokens that reside on e. • produced(e) indicates the number of tokens written to e per invocation of the actor v. • consumed(e) specifies the number of tokens read (and removed) from e per invocation of the actor v 0 . An example of an SDF graph is depicted in Figure 33a. It consists of two actors and a single delay-less edge; actor A produces two tokens per invocation while actor B consumes three. Conceptually, a queue is associated with the edge which represents a buffer intermediately storing the tokens going from A
5.1. Synchronous Data Flow
a)
2 A
3 B
87
b)
2
3
A 2
2
AABAB
B
AABAB
B
AABAB
B
AABAB
3
A A
B 3
A 2
AABAB
3
A 2
B
3
Fig. 33: Illustration of a simple SDF graph (left) and the execution of a schedule (right).
to B. A firing, i.e., invocation of actor A corresponds to adding two tokens to the buffer. When B fires, the first three tokens are removed from the buffer. Consequently, A has to be executed at least two times before B can fire. If we consider a sequence of actor firings, the term schedule is used. The generation of a schedule is a central part of the compilation process in which a PDSP implementation is derived from a given SDF specification. Def. 14: (Flat Schedule) Given an SDF graph G = (V, E), a sequence S = v1 v2 . . . vq
of actor instances vi ∈ V is denoted as a flat schedule.
The concept of a flat schedule can be extended by introducing schedule loops, which allow a more compact representation of firing sequences. Def. 15: (Looped Schedule) Given an SDF graph G = (V, E), a parenthesized term of
the form (c S1 S2 . . . S p ) is referred to as a schedule loop having iteration count c and iterands S1 , S2 , . . . S p ; an iterand is either an actor v ∈ V or another schedule loop. A looped schedule is a sequence S = T1 T2 . . . Tq where each Ti is either an actor v ∈ V or a schedule loop. According to these definitions, each flat schedule is at the same time a looped schedule which contains no schedule loops, i.e., the set of all flat schedules is a subset of the set of looped schedules. For instance, the sequence A A B A B is a flat (and also a looped) schedule for the SDF graph depicted in Figure 33; its execution is illustrated in the same figure on the right-hand side. In contrast, the term A(2 A B) is a looped but not a flat schedule. Furthermore, note that each looped schedule can be converted to a flat schedule by using loop unrolling. The firing sequence represented by a schedule loop (c S1 S2 . . . S p ) is the term S1 S2 . . . S p . . . S1 S2 . . . S p ) where the loop body S1 S2 . . . S p appears exactly c times. Transforming recursively all schedule loops contained in a looped schedule into the corresponding actor firing sequences yields a flat schedule. Consider, e.g., the looped schedule (2 A(2 A B)); the corresponding flat schedule is A A B A B A A B A B.
88
Chapter 5. Software Synthesis
Moreover, looped schedules may be characterized by different properties. Def. 16: Let G = (V, E) be an SDF graph and S a looped schedule. S is called
• admissible schedule iff S is deadlock-free, i.e., vi is the i th actor firing of S, where v1 v2 . . . vi . . . vq is the flat schedule corresponding to S; • periodic schedule iff each actor v ∈ V fires at least once, and the state of G is the same before and after the execution of S concerning the number of tokens per queue; • single-appearance schedule iff for each actor v ∈ V there is exactly one instance in S. Here, S ∗ denotes the set of all admissible, periodic looped schedules regarding G. The entirety of all admissible, periodic looped single-appearance schedules is represented by the set S1∗ ⊆ S ∗ . The actor sequence A A B A B is an admissible, periodic flat schedule for the example SDF graph in Figure 33, while the schedule A(2 A B) is in S ∗ as well, but contains a schedule loop. However, the order of the actor firings is identical for A A B A B and A(2 A B). In the remainder of this chapter, the general term schedule is used for members of S ∗ unless it is stated differently in the context. Examples for schedules not contained in S ∗ are B A B A A, which is not admissible; and A A B, which is not periodic. Furthermore, (3 A)(2 B) represents a single-appearance schedule in S1∗ , while A(2 B) is a single-appearance schedule which is neither admissible nor periodic. SDF graphs for which S ∗ 6 = ∅ are called consistent graphs. Systematic techniques exist to efficiently determine whether or not a given SDF graph is consistent and to compute the minimum number of times that each actor must be executed in the body of a schedule S ∈ S ∗ (Lee and Messerschmitt 1987). In the following, q(v) denotes the minimum number of firings for actor v ∈ V with regard to a given SDF graph G. 5.1.2
Implementation Model Today’s DSP compilers still produce several hundred percent of overhead with respect to assembly code written and optimized by hand. Therefore, a common approach in SDF-based DSP programming environments is to maintain a library which contains optimized assembly code for each actor. In Figure 34 the process of generating machine code from a given schedule is visualized: First the schedule is translated into a program containing the corresponding actor code blocks from the library, and then additional instructions are inserted in order to handle the data transfers between communicating actors (storage allocation phase). In this compilation model, which is also used here, the schedule is of crucial importance. However, the generated machine code not only depends on the
5.1. Synchronous Data Flow
89
actor library 3 B
scheduler
S
∋
2 A
S*
code generator
SDF graph storage allocation
... addi lw lw addi jr ...
$sp,$fp,-8 $fp,4($sp) $s0,8($sp) $sp,$sp,8 $ra
target code
Fig. 34: SDF compilation model from (Bhattacharyya, Murthy, and Lee 1996, p.17).
order in which the actors are executed but is also influenced by the underlying code generation model. Schedules can be implemented in various ways as shown in Figure 35. On the one hand, there is a choice between inlining and subroutine calls. Using subroutines, the final program comprises the code for each actor only once and the schedule is realized by a sequence of subroutine calls. In contrast, inlining means that a schedule is mapped into a sequence of actor code blocks where each block appears in the program as many times as the corresponding actor fires. On the other hand, looping constitutes another degree of freedom. Most firing sequences can be represented by a flat schedule or alternatively by a schedule containing loops. Hence, there is also a choice between looped and flat programs, assuming that schedule loops are directly transformed into software loops. From the above discussion it becomes clear that a software implementation is described by a schedule and a code generation scheme. Def. 17: (Software implementation) A (software) implementation for an SDF graph
G = (V, E) is a tuple (S, F) where • S ∈ S ∗ is an admissible periodic schedule, and • the implementation function F : V → {0, 1} determines for each actor v ∈ V separately whether it is implemented as a subroutine (F (v) = 1) or by inlining (F(v) = 0). Based on this definition, various objectives fi (S, F) can be introduced. Here, the three optimization criteria (data memory requirement, program memory requirement, and execution time) are formalized. 5.1.2.1 Data Memory The buffer capacity that is necessary to execute the schedule essentially defines the amount of data memory required by a software implementation of an SDF graph. In addition, the organization of the buffer memory affects the total of the memory cells needed. The memory assigned to a buffer can be fixed or shared
90
Chapter 5. Software Synthesis
AABAB BEGIN CODE(A) CODE(A) CODE(B) CODE(A) CODE(B) END
AABAB
AABAB
PROCEDURE A BEGIN CODE(A) END
PROCEDURE B BEGIN CODE(B) END
PROCEDURE B BEGIN CODE(B) END
PROCEDURE B BEGIN CODE(B) END
BEGIN CODE(A) CODE(A) CALL(B) CODE(A) CALL(B) END
BEGIN CODE(A) FOR i=1 TO 2 DO CODE(A) CALL(B) OD END
BEGIN CALL(A) CALL(A) CALL(B) CALL(A) CALL(B) END
inlining
A(2 AB)
subroutines
flat
looping
Fig. 35: Different ways of implementing a sequence of actor firings represented by the schedules A AB AB and A(2 AB). Combinations of them are also possible as indicated on the right-hand side.
among different queues. Furthermore, a buffer can be considered as existing the whole time or only as long as it is used. For simplicity, it is assumed here that a distinct segment of buffer memory is allocated for each edge of a given SDF graph. For this unshared memory model, the total of the data memory D(S) needed by a schedule S is equal to the sum of the minimally required capacities per buffer: X D(S) = max tokens(e, S) (5.1) e∈E
Here, max tokens(e, S) denotes the maximum number of tokens that accumulate on edge e during the execution of S. For instance, the schedule (3 A)(2 B) requires a minimal buffer size of 6 considering the SDF graph in Figure 33a, because 6 tokens are produced when actor A fires three times in succession. If another actor sequence is taken (S = A A B A B), the data memory requirement can be decreased (D(S) = 4). Finally, note that the individual actor code blocks might need additional data memory for storing local variables. As this is a fixed amount which is the same for all schedules and independent of whether inlining, subroutines, or looping is used, only the pure buffer memory is considered here. 5.1.2.2 Program Memory Assuming that for each actor v ∈ V the size size(v) of the corresponding actor code block in the library is given, the program memory requirement P(S, F) of
5.1. Synchronous Data Flow
91
an implementation (S, F) is modeled as follows: P(S, F) = Pinline (S, F) + Psubroutine (S, F) + Ploop (S)
(5.2)
The first term Pinline (S, F) only considers those actors v which are implemented by inlining (F(v) = 0). Let app(v) be the number of times that v appears in the schedule S (this value is less than or equal to the number of firings of v): 0 if S = v 0 ∈ V ∧ v 0 6 = v 1 if S = v 0 ∈ V ∧ v 0 = v app(v, S) = Pq (5.3) app(v, Ti ) if S = T1 T2 . . . Tq Pi=1 p i=1 app(v, Si ) if S = (c S1 S2 . . . S p ) Then, the program memory requirement caused by inlining is: Pinline (S, F) =
X
size(v) · app(v, S) · (1 − F(v))
(5.4)
v∈V
In contrast, the usage of subroutines is accompanied by a processor-specific overhead POsubroutine which takes additional code for, e.g., the jump instructions per subroutine invocation into account: Psubroutine (S, F) =
X
(size(v) + app(v, S) · POsubroutine ) · F(v)
(5.5)
v∈V
Finally, the additive term Ploop (S) denotes the program overhead caused by schedule loops. It depends on the processor-dependent number POloop of instructions needed for i) loop initialization and ii) loop counter increment, loop exit testing, and branching. Ploop (S) is equal to the number of schedule loops in S multiplied by POloop : if S = v ∈ V 0P q Ploop if S = T1 T2 . . . Tq Ploop (S) = P(Tpi ) i=1 POloop + i=1 Ploop (Si ) if S = (c S1 S2 . . . S p )
(5.6)
It must be emphasized here that this model only estimates the actual program size. For instance, code that is added in the storage allocation phase of the compilation process is not included in the above computations. 5.1.2.3 Execution Time Here, the execution time denotes the overhead in clock cycles of the target PDSP caused by i) subroutine calls, ii) software loops, and iii) data transfers in one schedule iteration. Formally, the execution time overhead T (S, F) of a given software implementation (S, F) is defined as T (S, F) = Tsubroutine (S, F) + Tloop (S) + Tio (S)
(5.7)
92
Chapter 5. Software Synthesis
The subroutine call overhead Tsubroutine (S, F) takes the number of TOsubroutine cycles into account that are necessary to save and restore register contents as well as perform the call and return instructions: X Tsubroutine (S, F) = app(v, S) · TOsubroutine · F(v) (5.8) v∈V
Concerning looping, there are in general two quantities: i) the time TOinit loop for iteration which is needed per loop iteration initializing a loop, and ii) the time TOloop in order to increment the counter, to check the exit condition, etc. For instance, if a single loop is executed c times, it produces an overhead of TOinit loop + c · iteration ∗ cycles with this model. As schedules S ∈ S may contain nested TOloop loops, the total loop overhead is defined recursively: 0P if S = v ∈ V q if S = T1 T2 . . . Tq i=1 Tloop (Ti ) p X Tloop (S) = (5.9) iteration TOinit + Tloop (Si )) loop + c · (TOloop i=1 if S = (c S1 S2 . . . S p ) The last additive component Tio (S) represents the communication time overhead, i.e, the time necessary to transfer data between the actors. In general, Tio (S) is influenced by i) the processor capabilities (e.g., some PDSPs offer efficient ways to handle buffer accesses) and ii) the chosen buffer model (e.g., fixed versus shared buffers). Assuming that each input/output operation (read data token from buffer, write data token to buffer) takes in average TOio cycles, the total communication time overhead can be initially approximated by P Tio (S) = ( e=(v,v0 )∈E app(v, S) · produced(e) · TOio ) + P (5.10) ( e=(v,v0 )∈E app(v 0 , S) · consumed(e) · TOio ) iteration ) depends on the chosen TOio (as well as TOsubroutine , TOinit loop , and TOloop processor. As with the other two optimization criteria, certain aspects of the actual implementation are disregarded in the execution time model. The amount of time needed to execute only the actor code blocks is assumed to be fixed (and therefore not included in T (S, F)) due to two reasons. First, the schedule is static (i.e., unchanged during run-time) and thus an actor firing can be performed without interrupts and/or wait cycles for polling. Second, only actor firing sequences of minimal length are considered in the following, where each actor v is executed exactly q(v) times per schedule iteration (cf. Section 5.1.1, page 88).
5.2
Minimizing Data Memory Requirements Most approaches to software synthesis from data flow specifications restrict the search to a certain class of implementations in order to handle the complexity
5.2. Minimizing Data Memory Requirements
individual i
mapping function m
implementation S looped single app. schedule S
actor permutation
1 repair permutation
93
topological actor sort
2 run GDPPO
Fig. 36: Mapping of actor permutations to looped single-appearance schedules.
of the problem. In (Bhattacharyya, Murthy, and Lee 1996), the minimization of data memory requirements for looped single-appearance schedules is considered under the inlining code generation model. Two heuristics have been developed that attempt to construct a buffer memory minimal schedule S ∈ S1∗ for a given SDF graph. Here, an EA is applied to this SOP and compared to those and other algorithms.1 5.2.1
Problem Statement Formally, the SOP under consideration is minimize f (S) = D(S) where S ∈ X = S1∗
(5.11)
where S1∗ is the set of all admissible, periodic single-appearance schedules for a given SDF graph G = (V, E); note that G is assumed to be acyclic here. Since only inlining and looping are used as code generation schemes, the function F is fixed with F(v) = 0 for all v ∈ V . Therefore, a software implementation is entirely described by the schedule. 5.2.2
Implementation The EA uses a procedure called GDPPO (Murthy, Bhattacharyya, and Lee 1994) on which the above two heuristics are also based. GDPPO, which stands for generalized dynamic programming post optimization, takes a topological sort of the actors of an SDF graph G = (V, E) as input and constructs a schedule S ∈ S1∗ whose data memory requirement is minimal among all singleappearance schedules S 0 ∈ S1∗ that have the same lexical ordering of actors. Thus, the EA explores the space of possible topological sorts for G, while GDPPO accomplishes the transformation of topological sorts to (data memory optimal) single-appearance schedules. 1A
detailed presentation of this study can be found in (Teich, Zitzler, and Bhattacharyya 1998), (Zitzler, Teich, and Bhattacharyya 1999d), and (Zitzler, Teich, and Bhattacharyya 1999b).
94
Chapter 5. Software Synthesis
Concerning the representation, an individual is a permutation π over the set of actors. Since each topological sort is a permutation, but not every permutation is a topological sort, a repair mechanism is necessary in order to avoid infeasible solutions. The entire decoding process is depicted in Figure 36. First, an individual i is unambiguously mapped to a topological sort π 0 by the following sort algorithm: Alg. 13: (Special Topological Sort Algorithm)
Input: Output:
G = (V, E) π π0
(acyclic SDF graph) (actor permutation) (topological actor sort)
Step 1: Set i = 1 and G 0 = G with G 0 = (V 0 , E 0 ). While V 0 6 = ∅ do a)
Find actor v ∈ V 0 which has no incoming edge in E 0 and is at the “leftmost” position regarding π : • Set j = 1. While j ≤ |V | do if π( j ) ∈ V 0 and 6 ∃(v 0 , v 00 ) ∈ E 0 : v 00 = v then stop else set j = j + 1. • If j > |V | then error (cyclic SDF graph) else v = π( j ).
b)
Set π 0 (i ) = v.
c)
Remove v and all edges coming from or going to v from G 0 : • V 0 = V 0 \ {v}, • E 0 = {(v 0 , v 00 ) ∈ E 0 ; v 0 6 = v ∧ v 00 6 = v}.
d)
Set i = i + 1.
For instance, the permutation π(1) = B, π(2) = A over the nodes of the SDF graph depicted in Figure 33 would be transformed into the topological sort π 0 (1) = A, π 0(2) = B. Afterwards, GDPPO is applied to π 0 and the data memory requirement of the resulting schedule S = m (ii ) gives the fitness value of i : F(ii ) = D(S). As with the traveling salesman problem in Chapter 3, two order-based genetic operators are used: uniform order-based crossover and scramble sublist mutation (Davis 1991). Both ensure that the permutation property of individuals is preserved. 5.2.3
Comparing the Evolutionary Algorithm and Other Optimization Methods The EA was tested on several practical examples of acyclic, multirate SDF graphs as well as on 200 acyclic random graphs, each containing 50 nodes and having 100 edges in average. The obtained results were compared against the outcomes produced by the following algorithms: • APGAN (acyclic pairwise grouping of adjacent nodes) (Bhattacharyya, Murthy, and Lee 1996) is the first of the two mentioned heuristics. It is a bottom-up approach and attempts to construct a single-appearance schedule with minimal
5.2. Minimizing Data Memory Requirements
95
data memory requirements. This procedure of low polynomial time complexity has been proven to give optimal results for a certain class of graphs with relatively regular structure. • RPMC (recursive partitioning by minimum cuts) (Bhattacharyya, Murthy, and Lee 1996) is the second heuristic for generating data memory minimal schedules S ∈ S1∗ . In contrast to APGAN, it works top-down and shows better performance on irregular SDF graphs. RPMC (as well as APGAN) is combined with GDPPO here. • RAND is the random search strategy described in Section 3.2.3 on page 47. • HC stands for hill climbing, a stochastic optimization method which operates on a single solution. Starting with a random solution, the scramble sublist mutation operator is repeatedly applied until a better solution is found. Then, the same procedure is performed for the improved solution. Here, the same coding, mapping function and mutation rate as with the EA are used. • EA+APGAN is a combination of EA and APGAN where the APGAN solution is inserted into the initial population of the EA. • RAPGAN is a randomized version of APGAN and is described in detail in (Zitzler, Teich, and Bhattacharyya 1999d). It is controlled by a parameter p which determines the “degree of randomness” that is introduced into the APGAN approach. The value p = 1 means that RAPGAN behaves like the deterministic APGAN algorithm (no randomization), and as p decreases from 1 to 0, the deterministic factors that guide APGAN have progressively less influence. Based on preliminary experiments, see (Zitzler, Teich, and Bhattacharyya 1999d), the population size was set to N = 30 and the probabilities associated with the operators to pc = 0.2 and pm = 0.4. All stochastic algorithms (EA, RAND, HC, EA+APGAN) ran for 3000 fitness evaluations each, i.e., the optimization runs were aborted after the mapping function m had been invoked 3000 times. In the case of RAPGAN, several runs were carried out per graph, such that the total of the run-time was equal to the EA’s run-time on that particular graph; the best value achieved during the various runs was taken as the final result. The randomization parameter p of RAPGAN was set to p = 0.5. 5.2.3.1 Practical Examples of SDF Graphs In all of the practical benchmark examples that make up Table 4 the results achieved by the EA equal or surpass the ones generated by RPMC. Compared to APGAN on these practical examples, the EA is neither inferior nor superior; it shows both better and worse performance in two cases each. However, the randomized version of APGAN is only outperformed in one case by the EA. Furthermore, HC and EA show almost identical performance, while RAND achieves slightly worse results than the other probabilistic algorithms.
96
Chapter 5. Software Synthesis
Tab. 4:
Comparison of data memory requirement on eleven practical examples.2 The first ten DSP applications are the same as considered in (Bhattacharyya, Murthy, and Lee 1996), while the satellite receiver example (11) is taken from (Ritz, Willems, and Meyr 1995).
Example 1 2 3 4 5 6 7 8 9 10 11
APGAN (RAPGAN) 47 (47) 99 (99) 137 (126) 756 (642) 160 (160) 108 (108) 35 (35) 46 (46) 78 (78) 166 (166) 1542 (1542)
RPMC
RAND
HC
EA
52 99 128 589 171 110 35 55 87 200 2480
47 99 143 807 165 110 35 46 78 188 1542
47 99 126 570 160 108 35 47 80 190 1542
47 99 126 570 160 108 35 46 80 197 1542
EA + APGAN 47 99 126 570 159 108 35 46 78 166 1542
Although the results are nearly the same when considering only 1500 fitness evaluations, the stochastic optimization methods cannot compete with APGAN or RPMC concerning run-time performance. For example, APGAN needs less than 2.3 seconds for all graphs on a SUN SPARC 20, while the run-time of the EA varies from 0.1 seconds up to 5 minutes (3000 fitness evaluations). 5.2.3.2 Random SDF Graphs The experiments concerning the random graphs are summarized in Table 5.3 Interestingly, for these graphs APGAN is better than RAND only in 15% of all cases and better than the EA only in two cases. However, it is outperformed by the EA 99% of the time. This is almost identical to the comparison of HC and APGAN. As RPMC is known to be better suited for irregular graphs than APGAN (Bhattacharyya, Murthy, and Lee 1996), its better performance (65.5%) is not surprising when directly compared to APGAN. Nevertheless, it is beaten by the EA as well as HC more than 95% of the time. Also, RAPGAN outperforms APGAN and RPMC by a wide margin; compared to both EA and HC directly, it shows slightly worse performance.4 These results are promising, but have to be considered in association with their quality, i.e., the magnitude of the data memory requirement achieved. In 2 The
following DSP systems were considered: 1) fractional decimation; 2) Laplacian pyramid; 3) nonuniform filterbank (1/3, 2/3 splits, 4 channels); 4) nonuniform filterbank (1/3, 2/3 splits, 6 channels); 5) QMF nonuniform-tree filterbank; 6) QMF filterbank (one-sided tree); 7) QMF analysis only; 8) QMF tree filterbank (4 channels); 9) QMF tree filterbank (8 channels); 10) QMF tree filterbank (16 channels); 11) satellite receiver. 3 The EA ran about 9 minutes on each graph, the time for running APGAN was consistently less than 3 seconds on a SUN SPARC 20. 4 This holds for different values of the randomization parameter p as has been verified experimentally.
5.3. Trading-off Execution Time and Memory Requirements
Tab. 5:
97
Comparison of performance on 200 50-actor SDF graphs; for each row the numbers represent the fraction of random graphs on which the corresponding heuristic outperforms the other approaches.
< APGAN RAPGAN RPMC RAND HC EA EA + APGAN
APGAN
RAPGAN
RPMC
RAND
HC
EA
0% 99.5% 65.5% 85% 100% 99% 100%
0.5% 0% 5.5% 6.5% 84.5% 72% 78.5%
34.5% 94.5% 0% 70.5% 96.5% 95.5% 97.5%
15% 93.5% 29.5% 0% 99.5% 99.5% 99%
0% 15.5% 3.5% 0.5% 0% 22% 32.5%
1% 27.5% 4.5% 0.5% 70% 0% 53.5%
EA + APGAN 0% 21% 2.5% 1% 57% 39% 0%
average the data memory requirement achieved by the EA is half the one computed by APGAN and only 63% of the RPMC outcome. Moreover, an improvement by a factor 28 can be observed on a specific random graph with respect to APGAN (factor of 10 regarding RPMC). Compared to RAND, it is the same, although the margin is smaller (in average the results of the EA are 0.84% of the results achieved by RAND). HC, however, might be an alternative to the EA, although the memory requirement achieved by the EA deviates from the outcomes produced by HC by only a factor of 0.19% on average. This also suggests that i) the EA might be improved using a more specialized crossover operator and ii) simulated annealing, for instance, could also be a good optimization algorithm with this problem. However, this has not been investigated further in this work. Finally, the RAPGAN results perform worse than 3% of the EA results with regard to the magnitude of the data memory requirement.
5.3
Trading-off Execution Time and Memory Requirements Bhattacharyya, Murthy, and Lee (1996) have focused on the data memory minimization of looped single-appearance schedules. Evidently, this type of schedule is nearly program memory optimal when only inlining and looping is used. However, it may not be data memory minimal, and in general, it may be desirable to trade-off some of the run-time efficiency of inlining with further reduction in program memory requirement by using subroutines, especially with system-on-a-chip implementations. Here, the space of arbitrary software implementations (S, F) is explored where each of the three criteria data memory, program memory, and execution time is considered as a separate objective. Figure 37 shows the trade-offs between these goals. On the one hand, there is a conflict between program memory
98
Chapter 5. Software Synthesis
execution time inlining / subroutines flat / looping program memory
data memory
flat / looping
Fig. 37: Trade-offs between the three optimization criteria according to the code generation alternatives.
requirement and execution time. While subroutines save program memory, they are accompanied by an execution time overhead; the same holds for software loops. In contrast, the pure inlining code generation model generally produces faster, but also larger programs. On the other hand, looping introduces a conflict between data memory and program memory requirements. The data memory needed by an implementation only depends on the order of the actor firings. However, the firing sequence also determines to which extent looping is applicable; thus certain data memory minimal schedules may not be looped which, in turn, affects the code size. In the following, an MOEA implementation for this MOP is presented. It is applied to a sample rate conversion system as well as to nine of the eleven practical DSP examples from Section 5.2.3.1. This work has been published in (Zitzler, Teich, and Bhattacharyya 1999a; Teich, Zitzler, and Bhattacharyya 1999; Zitzler, Teich, and Bhattacharyya 1999c). 5.3.1
Problem Statement Based on the implementation metrics presented in 5.1.2, this MOP can be formulated for a given SDF graph G = (V, E) as follows: minimize subject to
where
f (S, F) = ( f 1 (S, F), f 2 (S, F), f 3 (S, F)) f 1 (S, F) = D(S) f 2 (S, F) = P(S, F) f 3 (S, F) = T (S, F) (S, F) ∈ X = S ∗ × F ∗
(5.12)
and F ∗ denotes the set of all possible implementation functions F : V → {0, 1}. 5.3.2
Implementation As depicted in Figure 38, each individual consists of four components: i) actor firing sequence, ii) loop flag, iii) actor implementation vector, and iv) implementation model.
5.3. Trading-off Execution Time and Memory Requirements
individual i
99
implementation (S,F)
mapping function m
actor firing sequence
looped schedule S
loop flag
implementation function F
actor implementation vector
1 schedule repair
implementation model
flat schedule
2 run CDPPO if loop flag set
3 for each actor determine: inlining or subroutine
Fig. 38: Design space exploration of DSP software implementations: mapping from individual space to decision space.
The first component represents the order of actor firings and is fixed in length because the minimal number q(v) of firings of an actor v ∈ V is known a priori (cf. Section 5.1.1, page 88). Since arbitrary actor firing sequences may contain deadlocks, a repair mechanism is applied in order to construct a flat, admissible, and periodic schedule from the encoded information (Step 1 in the decoding process, cf. Figure 38): Alg. 14: (Schedule Repair)
Input: Output:
G = (V, E) S0 S 00
(SDF graph) (actor firing sequence) (admissible schedule)
Step 1: Initialize S 00 with the empty schedule. For each e ∈ E do token(e) = delay(e). Step 2: Choose the leftmost actor instance v in S 0 which is fireable, i.e., ∀v 0 ∈ V : (v 0 , v) ∈ E ⇒ token(v 0 , v) ≥ consumed(v 0 , v). Step 3: Remove the actor instance v from S 0 and append it to S 00 . Step 4: Simulate the firing of the chosen actor v, i.e, for each incoming edge e = (·, v) ∈ E set token(e) = token(e) − consumed(e) and for each outgoing edge e0 = (v, ·) ∈ E set token(e0 ) = token(e0 ) + produced(e0 ). Step 5: If S 0 is not empty then go to Step 2 else stop. In each loop iteration, the first fireable actor instance is selected (and removed) from the sequence, and the execution of the corresponding actor is simulated. This process stops when the entire sequence has been worked off.
100
Chapter 5. Software Synthesis
1 A
1
2 B
3
2 C
7
8 D
CD
7
5 E
1 F DAT
Fig. 39: A sample rate conversion system (Zitzler, Teich, and Bhattacharyya 1999c): a digital audio tape (DAT) operating at a sample rate of 48kHz is connected to a compact disc (CD) player operating at a sample rate of 44.1kHz, e.g., for recording purposes. See (Vaidyanathan 1993) for details on multistage sample rate conversion.
The loop flag determines whether to use loops as a means to reduce program memory. If it is set, a looping algorithm called CDPPO (code-size dynamic programming post optimization) is invoked which transforms the repaired flat schedule S 00 into an optimally looped schedule S (Step 2 in Figure 38); otherwise the schedule remains flat (S = S 00 ). Since the run-time of CDPPO is rather high (O(n 4 )) considering large n, where n is the size of the input schedule, the algorithm can be sped up at the expense of optimality. Altogether, there are four parameters α1 , α2 , β1 , β2 by which the accuracy of the optimization can be traded-off with the required run-time. These parameters are set by the user and fixed per optimization run. Details on CDPPO, which is a generalization of GDPPO, can be found in (Bhattacharyya, Murthy, and Lee 1995; Zitzler, Teich, and Bhattacharyya 1999c). The implementation function F is encoded by the implementation model and the actor implementation vector components (Step 3 in Figure 38). The former component fixes how the actors are implemented: i) all actors are realized as subroutines (∀v ∈ V : F(v) = 1), ii) only inlining is used (∀v ∈ V : F(v) = 0), or iii) subroutines and inlining are mixed. For the last case, the actor implementation vector, a bit vector of length |V |, defines for each actor separately whether it appears as inlined or subroutine code in the final program. Due to the heterogeneous representation, a mixture of different crossover and mutation operators accomplishes the generation of new individuals. Similar to the single-objective EA implementation in Section 5.2.2, uniform order-based crossover and scramble sublist mutation are used for the actor firing sequence (Davis 1991). The other components of an individual are bit vectors; there, one-point crossover and bit flip mutation (Goldberg 1989) are applied. 5.3.3
Case Study: Sample Rate Conversion SPEA was used to compare the design spaces of three real PDSPs and one fictive PDSP on a sample rate conversion system (CDtoDAT). The SDF graph for this DSP application, in which a compact disc player is connected to a digital audio tape, is depicted in Figure 39. It is consistent because S ∗ is not empty; for instance, the schedule (7(7(3 A B)(2C))(4D))(32E(5F)) is an admissible, periodic looped schedule for this graph. The minimum number of actor firings
5.3. Trading-off Execution Time and Memory Requirements
Tab. 6:
101
The parameters of three well-known PDSPs. All are capable of performing zero overhead looping. For the TMS320C40, however, it is recommended to use a conventional counter and branch implementation of a loop in case of nested loops. P1 is a fictive processor modeling high subroutine overheads. parameter
Motorola DSP56k
ADSP 2106x
TI TMS320C40
P1
P Oloop
2
1
1
2
P Osubroutine
2
2
2
10
init T Oloop
6
1
1
1
iteration T Oloop
0
0
8
0
T Osubroutine
8
2
8
16
is q(A) = q(B) = 147, q(C) = 98, q(D) = 28, q(E) = 32, q(F) = 160 and consequently the firing sequence encoded in an individual is of length 147 + 147 + 98 + 28 + 32 + 160 = 612. 5.3.3.1 Target Processors The PDSPs under consideration are modeled on the basis of the overhead parameters defined in Sections 5.1.2.1 to 5.1.2.3: • POloop : the number of program words for a complete loop; this value takes the overhead for the loop initialization into account as well as the instructions which are executed in each loop iteration (e.g., exit testing). • POsubroutine : subroutine call overhead in program words; for simplicity, it is assumed here that the actors are independent and therefore no context information must be saved and restored except PC and status registers. • TOinit loop : gives the processor clock cycles needed for loop initialization. • TOiteration : loop overhead (clock cycles) per iteration, which can be caused by loop counter increment, branch instructions, etc. • TOsubroutine : the number of cycles required to execute a subroutine call and a return instruction and to store and recover context information (PC and status registers). As can be observed from Table 6 the DSP56k and the TMS320C40 have high subroutine execution time overhead; the DSP56k, however, has a zero loop iteration overhead and high loop initialization overhead; and the TMS320C40 has a high loop iteration overhead but low loop initialization overhead. The fictive processor P1 models a PDSP with high subroutine overheads.
102
Chapter 5. Software Synthesis
5.3.3.2 Experimental Results For each of the real processors two kinds of experiments were performed: one time the parameters of CDPPO were set to α1 = 1, α2 = ∞, β1 = 10, β2 = 40 leading to suboptimal looping5, another time the focus was on optimal looping, where both accuracy and run-time of the CDPPO algorithm were maximum. For P1 only suboptimal looping was considered. For both types of experiments, the remaining optimization parameters were: Number of generations T Population size N Maximum size of external nondominated set N Crossover rate pc mutation rate pm (scramble sublist) mutation rate pm (bit flip)
: : : : : :
250 100 ∞ 0.8 0.1 1/L
Concerning the bit vector mutation rate, L denotes the length of the corresponding vector. The size of the external nondominated set was unrestricted in order to find as many solutions as possible; as a consequence, no clustering was performed. Moreover, before every run APGAN was applied to the CDtoDAT example. The resulting solution was inserted in two ways into the initial population: with and without schedule loops; in both cases, F(v) = 0 for each actor v ∈ V T P )), which contains all P ) = p(m m (∪t=0 (inlining). Finally, the set A = m (P t nondominated solutions found during the entire evolution process, was considered as the outcome of a single optimization run. The nondominated fronts achieved by SPEA in the different runs are shown in Figures 40 to 43. To make the differences between the processors clearer, the plots have been cut at the top without destroying their characteristics. The trade-offs between the three objectives are very well reflected by the extreme points. The rightmost points in the plots represent software implementations that neither use looping nor subroutine calls. Therefore, they are optimal in the execution time dimension, but need a maximum of program memory because for each actor firing there is an inlined code block. In contrast, the solutions represented by the leftmost points make excessive use of looping and subroutines which leads to minimal program memory requirements, however at the expense of a maximum execution time overhead. Another extreme point (not shown in the figures) satisfies D(S) = 1021, but has only little overhead in the remaining two dimensions. It stands for an implementation which includes the code for each actor only once by using inlining and looping. The schedule associated with this implementation is the looped single-appearance schedule computed by APGAN. This indicates that single-appearance schedules can induce significantly higher data memory requirements than what is achievable by using multiple-appearance schedules S ∈ S ∗ \ S1∗ . 5 These
CDPPO parameters were chosen based on preliminary experiments.
5.3. Trading-off Execution Time and Memory Requirements
320 300 280 260 240 22000
0 2500
data memory
320 300 280 260 240 22000
0 2500
4000 5000
program memory
103
data memory
4000 5000
6000
7500 10000
program memory
execution time
6000
7500 10000
8000
execution time
8000
Fig. 40: Trade-off surfaces for the Motorola DSP56k (left: suboptimal looping, right: optimal looping).
320 300 280 260 240 22000
0 2500
4000 5000
program memory
data memory
320 300 280 260 240 22000
0 2500
data memory
4000 5000
6000
7500 10000
8000
execution time
program memory
6000
7500 10000
execution time
8000
Fig. 41: Trade-off surfaces for the ADSP 2106x (left: suboptimal looping, right: optimal looping).
104
Chapter 5. Software Synthesis
320 300 280 260 240 22000
0 2500
data memory
0 2500
4000 5000
program memory
320 300 280 260 240 22000
data memory
4000 5000
6000
7500 10000
program memory
execution time
8000
6000
7500 10000
execution time
8000
Fig. 42: Trade-off surfaces for the TMS320C40 (left: suboptimal looping, right: optimal looping).
320 300 280 260 240 22000
0 2500
data memory
4000 5000
program memory
6000
7500 10000
execution time
8000
Fig. 43: Trade-off surface for the fictive processor P1 (suboptimal looping).
5.3. Trading-off Execution Time and Memory Requirements
Tab. 7:
105
Comparison of the trade-off fronts achieved with different CDPPO parameters (suboptimal versus optimal looping). The first two rows give for each PDSP the sizes of the two nondominated sets found. In the last two rows, the nondominated sets are compared for each PDSP separately using the C metric.
#solutions (subopt. loop.) #solutions (opt. loop.) C(subopt. loop., opt. loop.) C(opt. loop., subopt. loop.)
Motorola DSP56k 371 112 49.2% 67.4%
ADSP 2106x 350 88 65.9% 61.7%
TI TMS320C40 336 73 16.4% 66.7%
Furthermore, the influence of looping and subroutine calls is remarkable. Using subroutines does not interfere with data memory requirement; there is only a trade-off between program memory requirement and execution time. Subroutine calls may save much program memory, but at the same time they are expensive in terms of execution time. This fact is reflected by “gaps” on the execution time axis in Figures 40 and 42. Looping, however, depends on the schedule: schedules which can be looped well may have high data memory requirements and vice versa. This trade-off is responsible for the variations in data memory requirements and is illustrated by the points that are close to each other regarding program memory and execution time, but strongly differ in the data memory dimension. Comparing the three real processors, one can observe that the ADSP 2106x produces less execution time overhead than the other PDSPs which is in accordance with Table 6. Subroutine calls are most frequently used in case of the TMS320C40 because of the high loop iteration overhead. For processor P1 (Figure 43), it can be seen that implementations with minimal code size require much more program memory than the corresponding program memory minimal solutions for the other PDSPs. The reason is that subroutines are accompanied by a high penalty in program memory and execution time with P1. In fact, none of the 186 nondominated solutions found used subroutine calls for any actor. The effect of CDPPO on the obtained nondominated front can be clearly seen by comparing the results for suboptimal and optimal looping in Figures 40 to 42. In general, the nondominated solutions found require less data memory when the CDPPO parameters for maximum accuracy (and run-time) were used; the trade-off surface becomes much more flat in this dimension. It is also remarkable that for each real PDSP several solutions were generated that need less program memory than the implementation with the lowest code size when using suboptimal looping. Furthermore, Table 7 shows that the fronts for optimal looping cover the corresponding fronts for suboptimal looping by approximately two thirds, although the former contain substantially less points than the latter. As a result, the optimization time spent by the CDPPO algorithm
106
Chapter 5. Software Synthesis
NPGA
SPEA
Fig. 44: Comparison of SPEA and NPGA on nine practical DSP applications. Each rectangle contains nine box plots representing the distribution of the C values; the leftmost box plot relates to DSP system 1 from Table 4, the rightmost to DSP system 9. The scale is 0 at the bottom and 1 at the top per rectangle. Furthermore, the upper right rectangle gives the fraction of the SPEA fronts weakly dominated by the corresponding NPGA fronts. The other rectangle refers to the other direction (“C(SPEA, NPGA)”).
has a large influence on the shape of the nondominated front. 5.3.4
Comparing Two Evolutionary Multiobjective Optimizers The first nine practical DSP applications from Table 4 formed the basis to compare the performance of the SPEA implementation with an NPGA implementation. With these SDF graphs, the number of actors varies between 12 and 92, the minimum length of the associated actor firing sequences ranges from 30 to 313. On each example, SPEA and NPGA ran in pairs on the same initial population, using optimal looping; then the two resulting nondominated sets were assessed by means of the C function. As with the other MOEA comparisons, T P )) was m (∪t=0 the offline performance was considered, i.e., the set A = p(m t the outcome of an optimization run. Altogether, eight of these pairwise runs were performed per application, each time operating on a different initial population. Furthermore, the same parameters as listed in on page 102 were used except that for SPEA the population size was reduced to N = 80 and the size of the external nondominated set was limited to N = 20. Concerning NPGA, the domination pressure was set to tdom = 10 following the recommendations given in (Horn and Nafpliotis 1993); the niching parameter σshare = 0.4886 was calculated based on guidelines described in (Deb and Goldberg 1989). The experimental results are summarized in Figure 44. On all nine applications, SPEA weakly dominates more than 78% of the NPGA outcomes (in av-
5.4. Summary
107
erage more than 90%), whereas NPGA weakly dominates in average less than 10% of the SPEA outcomes. In other words, the nondominated sets generated by SPEA dominate most parts of the corresponding NPGA sets, whereas only very few solutions found by NPGA are not covered. This substantiates the results presented in Chapter 3 and indicates that the proposed test problems reflect important characteristics of this real-world application.
5.4
Summary In this chapter, the problem of automatic software synthesis from synchronous data flow graphs was addressed. Major results are: • When disregarding the additional run-time needed, an EA was shown to be superior to two state of the art heuristics for minimizing data memory requirements with regard to a restricted class of software implementations. However, other stochastic approaches like hill climbing might be alternatives to the EA. • A design space exploration for this problem was performed using an MOEA. The investigation revealed that there is a variety of different software implementations representing possible trade-offs between the criteria data memory, program memory, and execution time. Prior work in this field has mainly focused on one of the objectives, not taking the trade-off issue into account. Moreover, it could be observed that the shape of the obtained trade-off surface strongly depends on the chosen target processor. • As with the “artificial” test problems, SPEA provided better performance than NPGA on this application. This supports the supposition that elitism is mandatory in evolutionary multiobjective optimization.
108
Chapter 5. Software Synthesis
6 Conclusions 6.1
Fundamental Results The goal of the present thesis was to compare and improve existing evolutionary approaches to multiobjective optimization, and to apply evolutionary multicriteria methods to real-world problems in the domain of system design. Essential results are: • A comprehensive experimental methodology to quantitatively compare multiobjective optimizers has been presented. In particular, several quantitative performance measures as well as a set of test functions ranging from NP-hard to continuous problems have been proposed. As the experimental results have shown, both measures and test problems are sufficient to reveal the performance differences of various MOEA implementations. • The first time, numerous evolution-based techniques have been compared empirically on different problems by means of quantitative metrics. In contrast to what was expected beforehand, a hierarchy of algorithms emerged. Furthermore, elitism has been proven to be an important factor in evolutionary multiobjective search. • A novel approach, the strength Pareto evolutionary algorithm (SPEA), has been introduced which combines established and new techniques in a unique manner. It clearly outperformed other MOEA implementations on the test problems as well as the two real-world applications under consideration. • The elitism scheme of SPEA has been generalized for incorporation in arbitrary evolutionary approaches. Its efficiency has been shown for several non-elitist
110
Chapter 6. Conclusions
MOEAs: performance improved significantly when using this particular elitism concept. • The widespread opinion that (elitist) MOEAs can have clear advantages over traditional multicriteria optimization methods has been substantiated experimentally. In spite of significantly less computation effort, SPEA provided better solutions than the weighting and the constraint methods on the two-dimensional test problems as well as on the system synthesis application. • The first systematic approach to the multidimensional exploration of software implementation for digital signal processing algorithms has been presented. The optimization framework takes all of the three objectives data memory requirement, program memory requirement, and execution time into account, while prior work has mainly focused on the single-objective optimization of a more restricted class of implementations.
6.2
Future Perspectives Based on this work, promising areas for future research may be: • SPEA generally outperforms the other MOEAs under consideration. Identifying the major factors responsible for this gap in performance can help to develop better algorithms; preliminary experiments indicate that the external set of nondominated solutions plays an important role. • Elitism has been shown to be mandatory in evolutionary multiobjective optimization, and consequently the question arises how elitism is incorporated most effectively in MOEA implementations. Thus, a comparison of different elitism concepts in combination with various test problems, fitness assignment schemes, and niching methods is needed. • EAs seem to be especially suited to multiobjective optimization, and still there are hardly any alternatives when the goal is to capture multiple Pareto-optimal solutions in one run instead of finding a single solution. In order to clarify the question of whether MOEAs can do better than other blind search strategies, as some researchers suppose, single-objective optimization methods like hill climbing, tabu search, simulated annealing, etc. might be extended to the multiobjective case. A comparison of the resulting algorithms to MOEAs, for which the foundation has been laid in this work, may lead to new insights in this context. • The experimental results have shown that an elitist MOEA can outperform an elitist single-objective EA based on the weighting approach in spite of significantly lower computation effort. That means the nondominated set achieved by the MOEA in one optimization run dominates any solution found by the
6.2. Future Perspectives
111
single-objective EA, independent of the chosen linear combination. This might be interpreted as a hint that synergies emerge when the search space is sampled for multiple Pareto-optimal solutions in parallel. Therefore, it might be interesting to investigate the following questions: a) Can these effects be observed in general or only on particular problems? In the latter case, the problem characteristics responsible for this phenomenon must be identified. b) What are the reasons for these effects? The hope is to achieve a better understanding of evolutionary multiobjective optimization and possibly to identify the factors of success. c) Is there a systematic way of improving single-objective optimization by means of multiobjective algorithms? The underlying idea is to transform an SOP into an MOP by dividing the single criterion into multiple, conflicting criteria. This might be a new possibility to deal with premature convergence. However, this methodology would probably not be applicable to all single-objective optimization problems. • Concerning the software synthesis application, the implementation model may be refined such that, e.g., subroutine overheads are covered more precisely and different buffer models are considered. Furthermore, how to best trade-off accuracy and run-time of the looping algorithm CDPPO in order to achieve optimal results for a given period of time may also be investigated.
112
Chapter 6. Conclusions
Bibliography Anderson, M. B. and W. R. Lawrence (1996). Launch conditions and aerodynamic data extraction by an elitist pareto genetic algorithm. In AIAA Atmospheric Flight Mechanics Conference, San Diego, California. AIAA Paper 96-3361. B¨ack, T. (1996). Evolutionary Algorithms in Theory and Practice. New York, etc.: Oxford University Press. B¨ack, T., U. Hammel, and H.-P. Schwefel (1997). Evolutionary computation: Comments on the history and current state. IEEE Transactions on Evolutionary Computation 1(1), 3–17. Baker, J. E. (1985). Adaptive selection methods for genetic algorithms. In J. J. Grefenstette (Ed.), Proceedings of an International Conference on Genetic Algorithms and Their Applications, pp. 101–111. sponsored by Texas Instruments and U.S. Navy Center for Applied Research in Artificial Intelligence (NCARAI). Baker, J. E. (1987). Reducing bias and inefficiency in the selection algorithm. In J. J. Grefenstette (Ed.), Genetic Algorithms and Their Applications: Proceedings of the Second International Conference on Genetic Algorithms, New Jersey, pp. 14–21. Lawrence Erlbaum. Banzhaf, W., J. Daida, A. E. Eiben, M. H. Garzon, V. Honavar, M. Jakiela, and R. E. Smith (Eds.) (1999). Proceedings of the Genetic and Evolutionary Computation Conference (GECCO’99), San Francisco, CA. Morgan Kaufmann. Bhattacharyya, S. S., P. K. Murthy, and E. A. Lee (1995). Optimal parenthesization of lexical orderings for DSP block diagrams. In Proceedings of the International Workshop on VLSI Signal Processing, Piscataway, NJ. IEEE Press. Bhattacharyya, S. S., P. K. Murthy, and E. A. Lee (1996). Software Synthesis from Dataflow Graphs. Norwell, MA: Kluwer. Blickle, T. (1996). Theory of Evolutionary Algorithms and Application to System-Synthesis. Ph. D. thesis, Swiss Federal Institute of Technology (ETH), Zurich, Switzerland. ETH diss no. 11894. Blickle, T., J. Teich, and L. Thiele (1998). System-level synthesis using evolutionary algorithms. Design Automation for Embedded Systems 3(1),
114
BIBLIOGRAPHY
23–58. Blickle, T. and L. Thiele (1996). A comparison of selection schemes used in evolutionary algorithms. Evolutionary Computation 4(4), 361–394. Buck, J., S. Ha, E. A. Lee, and D. G. Messerschmitt (1994, April). Ptolemy: A framework for simulating and prototyping heterogeneous systems. International Journal on Computer Simulation 4, 155–182. Chambers, J. M., W. S. Cleveland, B. Kleiner, and P. A. Tukey (1983). Graphical Methods for Data Analysis. Pacific Grove, CA: Wadsworth & Brooks/Cole Publishing Company. Cieniawski, S. E., J. W. Eheart, and S. Ranjithan (1995). Using genetic algorithms to solve a multiobjective groundwater monitoring problem. Water Resources Research 31(2), 399–409. Coello, C. A. C. (1999a). A comprehensive survey of evolutionary-based multiobjective optimization. Knowledge and Information Systems. Coello, C. A. C. (1999b). An updated survey of evolutionary multiobjective optimization techniques: State of the art and future trends. In Congress on Evolutionary Computation (CEC99), Volume 1, Piscataway, NJ, pp. 3–13. IEEE. Cohon, J. L. (1978). Multiobjective Programming and Planning. New York: Academic Press. Cohon, J. L. (1985). Multicriteria programming: brief review and application. In J. S. Gero (Ed.), Design Optimization, pp. 163–191. Orlando, Florida: Academic Press. Cunha, A. G., P. Oliviera, and J. Covas (1997). Use of genetic algorithms in multicriteria optimization to solve industrial problems. In T. B¨ack (Ed.), Proceedings of the Seventh International Conference on Genetic Algorithms, San Francisco, California, pp. 682–688. Morgan Kaufmann. Davis, L. (1991). Handbook of Genetic Algorithms, Chapter 6, pp. 72–90. New York: Van Nostrand Reinhold. De Jong, K. A. (1975). An analysis of the bevavior of a class of genetic adaptive systems. Ph. D. thesis, University of Michigan. Deb, K. (1998). Multi-objective genetic algorithms: Problem difficulties and construction of test functions. Technical Report No. CI-49/98, Department of Computer Science/XI, University of Dortmund, Germany. Deb, K. (1999a, July). Personal Communication. Deb, K. (1999b). Evolutionary algorithms for multi-criterion optimization in engineering design. In Proceedings of Evolutionary Algorithms in Engineering and Computer Science (EUROGEN’99).
BIBLIOGRAPHY
115
Deb, K. and D. E. Goldberg (1989). An investigation of niche and species formation in genetic function optimization. In J. D. Schaffer (Ed.), Proceedings of the Third International Conference on Genetic Algorithms, San Mateo, CA, pp. 42–50. Morgan Kaufmann. Esbensen, H. and E. S. Kuh (1996). Design space exploration using the genetic algorithm. In IEEE International Symposium on Circuits and Systems (ISCAS’96), Volume 4, Piscataway, NJ, pp. 500–503. IEEE. Fogel, D. B. (1995). Evolutionary Computation: Toward a New Philosophy of Machine Intelligence. Piscataway, NJ: IEEE Press. Fonseca, C. M. and P. J. Fleming (1993). Genetic algorithms for multiobjective optimization: Formulation, discussion and generalization. In S. Forrest (Ed.), Proceedings of the Fifth International Conference on Genetic Algorithms, San Mateo, California, pp. 416–423. Morgan Kaufmann. Fonseca, C. M. and P. J. Fleming (1995a). Multiobjective genetic algorithms made easy: Selection, sharing and mating restrictions. In First International Conference on Genetic Algorithms in Engineering Systems: Innovations and Applications (GALESIA 95), London, UK, pp. 45–52. The Institution of Electrical Engineers. Fonseca, C. M. and P. J. Fleming (1995b). An overview of evolutionary algorithms in multiobjective optimization. Evolutionary Computation 3(1), 1–16. Fonseca, C. M. and P. J. Fleming (1996). On the performance assessment and comparison of stochastic multiobjective optimizers. In H.-M. Voigt, W. Ebeling, I. Rechenberg, and H.-P. Schwefel (Eds.), Fourth International Conference on Parallel Problem Solving from Nature (PPSN-IV), Berlin, Germany, pp. 584–593. Springer. Fonseca, C. M. and P. J. Fleming (1998a). Multiobjective optimization and multiple constraint handling with evolutionary algorithms—part i: A unified formulation. IEEE Transactions on Systems, Man, and Cybernetics 28(1), 26–37. Fonseca, C. M. and P. J. Fleming (1998b). Multiobjective optimization and multiple constraint handling with evolutionary algorithms—part ii: Application example. IEEE Transactions on Systems, Man, and Cybernetics 28(1), 38–47. Forrest, S., B. Javornik, R. E. Smith, and A. S. Perelson (1993). Using genetic algorithms to explore pattern recognition in the immune system. Evolutionary Computation 1(3), 191–211. Forrest, S. and A. S. Perelson (1991). Genetic algorithms and the immune system. In H.-P. Schwefel and R. M¨anner (Eds.), Parallel Problem Solving from Nature (PPSN I), Berlin, pp. 320–325. Springer.
116
BIBLIOGRAPHY
Fourman, M. P. (1985). Compaction of symbolic layout using genetic algorithms. In J. J. Grefenstette (Ed.), Proceedings of an International Conference on Genetic Algorithms and Their Applications, Pittsburgh, PA, pp. 141–153. sponsored by Texas Instruments and U.S. Navy Center for Applied Research in Artificial Intelligence (NCARAI). Garey, M. and D. Johnson (1979). Computers and Intractability: A Guide to the Theory of NP-Completeness. New York: Freeman. Glover, F., E. Taillard, and D. de Werra (1993). A user’s guide to tabu search. Annals of Operations Research 41, 3–28. Goldberg, D. E. (1989). Genetic Algorithms in Search, Optimization, and Machine Learning. Reading, Massachusetts: Addison-Wesley. Goldberg, D. E. and J. Richardson (1987). Genetic algorithms with sharing for multimodal function optimization. In J. J. Grefenstette (Ed.), Genetic Algorithms and their Applications: Proceedings of the Second International Conference on Genetic Algorithms, Hillsdale, NJ, pp. 41–49. Lawrence Erlbaum. Greenwood, G. W., X. S. Hu, and J. G. D’Ambrosio (1996). Fitness functions for multiple objective optimization problems: Combining preferences with pareto rankings. In R. K. Belew and M. D. Vose (Eds.), Foundations of Genetic Algorithms 4 (FOGA-96), pp. 437–455. San Francisco, CA: Morgan Kaufmann. Grefenstette, J. J. (1986). Optimization of control parameters for genetic algorithms. IEEE Transactions on Systems, Man, and Cybernetics 16(1), 122–128. Hajela, P. and C.-Y. Lin (1992). Genetic search strategies in multicriterion optimal design. Structural Optimization 4, 99–107. Harik, G. R. (1995). Finding multimodal solutions using restricted tournament selection. In L. J. Eshelman (Ed.), Proceedings of the Sixth International Conference on Genetic Algorithms, San Francisco, CA, pp. 24–31. Morgan Kaufmann. Holland, J. H. (1992). Adaption in Natural and Artificial Systems. Cambridge, MA: MIT Press. Horn, J. (1997). F1.9 multicriteria decision making. In T. B¨ack, D. B. Fogel, and Z. Michalewicz (Eds.), Handbook of Evolutionary Computation. Bristol (UK): Institute of Physics Publishing. Horn, J. and N. Nafpliotis (1993). Multiobjective optimization using the niched pareto genetic algorithm. IlliGAL Report 93005, Illinois Genetic Algorithms Laboratory, University of Illinois, Urbana, Champaign. Horn, J., N. Nafpliotis, and D. E. Goldberg (1994). A niched pareto genetic algorithm for multiobjective optimization. In Proceedings of the First IEEE Conference on Evolutionary Computation, IEEE World Congress
BIBLIOGRAPHY
117
on Computational Computation, Volume 1, Piscataway, NJ, pp. 82–87. IEEE. Horst, R. and P. M. Pardalos (1995). Handbook of Global Optimization. Dordrecht: Kluwer. Hwang, C.-L. and A. S. M. Masud (1979). Multiple Objectives Decision Making—Methods and Applications. Berlin: Springer. Ishibuchi, H. and T. Murata (1996). Multi-objective genetic local search algorithm. In Proceedings of 1996 IEEE International Conference on Evolutionary Computation (ICEC’96), Piscataway, NJ, pp. 119–124. IEEE. Khuri, S., T. B¨ack, and J. Heitk¨otter (1994). The zero/one multiple knapsack problem and genetic algorithms. In E. Deaton, D. Oppenheim, J. Urban, and H. Berghel (Eds.), Proceedings of the 1994 ACM Symposium on Applied Computing, New York, pp. 188–193. ACM-Press. Knowles, J. and D. Corne (1999a). Approximating the non-dominated front using the pareto archived evolution strategy. Technical Report RUCS/1999/TR/005/A, Department of Computer Science, University of Reading, UK, March. Knowles, J. and D. Corne (1999b). Assessing the performance of the pareto archived evolution strategy. In A. S. Wu (Ed.), Proceedings of the 1999 Genetic and Evolutionary Computation Conference (GECCO’99), Workshop Program, pp. 123–124. Koski, J. (1984). Multicriterion optimization in structural design. In E. Atrek, R. H. Gallagher, K. M. Ragsdell, and O. C. Zienkiewicz (Eds.), New Directions in Optimum Structural Design, pp. 483–503. Wiley. Koza, J. R. (1992). Genetic Programming: On the Programming of Computers by Means of Natural Selection. Cambridge, Massachusetts: MIT Press. Kursawe, F. (1991). A variant of evolution strategies for vector optimization. In H.-P. Schwefel and R. M¨anner (Eds.), Parallel Problem Solving from Nature — Proc. 1st Workshop PPSN, Berlin, pp. 193–197. Springer. Laumanns, M., G. Rudolph, and H.-P. Schwefel (1998). A spatial predatorprey approach to multi-objective optimization: A preliminary study. In A. E. Eiben, T. B¨ack, M. Schoenauer, and H.-P. Schwefel (Eds.), Fifth International Conference on Parallel Problem Solving from Nature (PPSNV), Berlin, Germany, pp. 241–249. Springer. Laumanns, M., G. Rudolph, and H.-P. Schwefel (1999). Approximating the pareto set: Concepts, diversity issues, and performance assessment. Technical Report No. CI-72/99, Department of Computer Science/XI, University of Dortmund, Germany. Lauwereins, R., M. Engels, J. A. Peperstraete, E. Steegmans, and J. V. Ginderdeuren (1990, April). Grape: A CASE tool for digital signal parallel
118
BIBLIOGRAPHY
processing. IEEE ASSP Magazine 7(2), 32–43. Lee, E. A. and D. G. Messerschmitt (1987). Synchronous dataflow. Proceedings of the IEEE 75(9), 1235–1245. Lis, J. and A. E. Eiben (1997). A multi-sexual genetic algorithm for multiobjective optimization. In Proceedings of 1997 IEEE International Conference on Evolutionary Computation (ICEC’97), Piscataway, NJ, pp. 59– 64. IEEE. Loughlin, D. H. and S. Ranjithan (1997). The neighborhood constraintmethod: A genetic algorithm-based multiobjective optimization technique. In T. B¨ack (Ed.), Proceedings of the Seventh International Conference on Genetic Algorithms, San Francisco, California, pp. 666–673. Morgan Kaufmann. Mahfoud, S. W. (1995). Niching Methods for Genetic Algorithms. Ph. D. thesis, University of Illinois at Urbana-Champaign. Martello, S. and P. Toth (1990). Knapsack Problems: Algorithms and Computer Implementations. Chichester: Wiley. Marwedel, P. and G. Goossens (1995). Code generation for embedded processors. Norwell, MA: Kluwer. Michalewicz, Z. and J. Arabas (1994). Genetic algorithms for the 0/1 knapsack problem. In Z. W. Ra´s and M. Zemankova (Eds.), Methodologies for Intelligent Systems (ISMIS’94), Berlin, pp. 134–143. Springer. Mitchell, M. (1996). An Introduction to Genetic Algorithms. MIT Press. Morse, J. N. (1980). Reducing the size of the nondominated set: Pruning by clustering. Computers and Operations Research 7(1-2), 55–66. Murata, T., H. Ishibuchi, and H. Tanaka (1996). Multi-objective genetic algorithm and its applications to flowshop scheduling. Computers & Industrial Engineering 30(4), 957–968. Murthy, P. K., S. S. Bhattacharyya, and E. A. Lee (1994). Minimizing memory requirements for chain-structured synchronous data flow programs. In Proceedings of the IEEE International Conference on Acoustics, Speech, and Signal Processing, Volume 2, Adelaide, Australia, pp. 453–456. Obayashi, S., S. Takahashi, and Y. Takeguchi (1998). Niching and elitist models for mogas. In A. E. Eiben, T. B¨ack, M. Schoenauer, and H.P. Schwefel (Eds.), Fifth International Conference on Parallel Problem Solving from Nature (PPSN-V), Berlin, Germany, pp. 260–269. Springer. Oei, C. K., D. E. Goldberg, and S.-J. Chang (1991, December). Tournament selection, niching, and the preservation of diversity. IlliGAL Report 91011, University of Illinois at Urbana-Champaign, Urbana, IL 61801.
BIBLIOGRAPHY
119
Paredis, J. (1995, July 15–19). The symbiotic evolution of solutions and their representations. In L. J. Eshelman (Ed.), Proceedings of the Sixth International Conference on Genetic Algorithms, San Francisco, CA, pp. 359–365. Morgan Kaufmann. Pareto, V. (1896). Cours D’Economie Politique, Volume 1. Lausanne: F. Rouge. Parks, G. T. and I. Miller (1998). Selective breeding in a multiobjective genetic algorithm. In A. E. Eiben, T. B¨ack, M. Schoenauer, and H.P. Schwefel (Eds.), Fifth International Conference on Parallel Problem Solving from Nature (PPSN-V), Berlin, Germany, pp. 250–259. Springer. Poloni, C. (1995). Hybrid ga for multi objective aerodynamic shape optimisation. In G. Winter, J. P´eriaux, M. Gal´an, and P. Cuesto (Eds.), Genetic Algorithms in Engineering and Computer Science, New York, pp. 397– 415. Wiley. Ringuest, J. L. (1992). Multiobjective Optimization: Behavioral and Computational Considerations. Boston: Kluwer. Ritz, S., M. Pankert, and H. Meyr (1992, August). High level software synthesis for signal processing systems. In Proceedings of the International Conference on Application-Specific Array Processors, Berkeley, CA. Ritz, S., M. Willems, and H. Meyr (1995). Scheduling for optimum data memory compaction in block diagram oriented software synthesis. In Proceedings of the International Conference on Acoustics, Speech and Signal Processing, Volume 4, pp. 2651–2654. Rosenman, M. A. and J. S. Gero (1985). Reducing the pareto optimal set in multicriteria optimization. Engineering Optimization 8, 189–206. Rudolph, G. (1998). On a multi-objective evolutionary algorithm and its convergence to the pareto set. In IEEE International Conference on Evolutionary Computation (ICEC’98), Piscataway, NJ, pp. 511–516. IEEE. Ryan, C. (1995). Niche and species formation in genetic algorithms. In L. Chambers (Ed.), Practical Handbook of Genetic Algorithms, Volume 1, Chapter 2, pp. 57–74. Boca Raton: CRC Press. Sakawa, M., K. Kato, and T. Shibano (1996). An interactive fuzzy satisficing method for multiobjective multidimensional 0-1 knapsack problems through genetic algorithms. In Proceedings of 1996 IEEE International Conference on Evolutionary Computation (ICEC’96), Piscataway, NJ, pp. 243–246. IEEE. Sawaragi, Y., H. Nakayama, and T. Tanino (1985). Theory of Multiobjective Optimization. Orlando, Florida: Academic Press. Schaffer, J. D. (1984). Multiple Objective Optimization with Vector Evaluated Genetic Algorithms. Ph. D. thesis, Vanderbilt University. Unpublished.
120
BIBLIOGRAPHY
Schaffer, J. D. (1985). Multiple objective optimization with vector evaluated genetic algorithms. In J. J. Grefenstette (Ed.), Proceedings of an International Conference on Genetic Algorithms and Their Applications, Pittsburgh, PA, pp. 93–100. sponsored by Texas Instruments and U.S. Navy Center for Applied Research in Artificial Intelligence (NCARAI). Shaw, K. J., C. M. Fonseca, and P. J. Fleming (1999). A simple demonstration of a quantitative technique for comparing multiobjective genetic algorithm performance. In A. S. Wu (Ed.), Proceedings of the 1999 Genetic and Evolutionary Computation Conference (GECCO’99), Workshop Program, pp. 119–120. Shaw, K. J., A. L. Northcliffe, M. Thompson, J. Love, P. J. Fleming, and C. M. Fonseca (1999). Assessing the performance of multiobjective genetic algorithms for optimization of a batch process scheduling problem. In Congress on Evolutionary Computation (CEC99), Volume 1, Piscataway, NJ, pp. 37–45. IEEE. Smith, R. E. and S. Forrest (1992). Population diversity in an immune system model: Implications for genetic search. In L. D. Whitley (Ed.), Foundations of Genetic Algorithms 2 (FOGA-92), San Mateo, California. Morgan Kaufmann. Smith, R. E., S. Forrest, and A. S. Perelson (1993). Searching for diverse, cooperative populations with genetic algorithms. Evolutionary Computation 1(2), 127–149. Spillman, R. (1995). Solving large knapsack problems with a genetic algorithm. In IEEE International Conference on Systems, Man and Cybernetics, Volume 1, Piscataway, NJ, pp. 632–637. IEEE. Srinivas, N. and K. Deb (1994). Multiobjective optimization using nondominated sorting in genetic algorithms. Evolutionary Computation 2(3), 221–248. Steuer, R. E. (1986). Multiple Criteria Optimization: Theory, Computation, and Application. New York: Wiley. Syswerda, G. (1989). Uniform crossover in genetic algorithms. In J. D. Schaffer (Ed.), Proceedings of the tird international conference on genetic algorithms, San Mateo, CA, pp. 2–9. Morgan Kaufmann. Tamaki, H., H. Kita, and S. Kobayashi (1996). Multi-objective optimization by genetic algorithms: A review. In Proceedings of 1996 IEEE International Conference on Evolutionary Computation (ICEC’96), Piscataway, NJ, pp. 517–522. IEEE. Tamaki, H., M. Mori, M. Araki, Y. Mishima, and H. Ogai (1994). Multicriteria optimization by genetic algorithms: A case of scheduling in hot rolling process. In M. Fushimi and K. Tone (Eds.), Proceedings of APORS’94, Singapore, pp. 374–381. World Scientific Publishing.
BIBLIOGRAPHY
121
Teich, J., T. Blickle, and L. Thiele (1997, March 24–26). System-level synthesis using evolutionary algorithms. In Proceedings of Codes / CASHE’97, the 5th International Workshop on Hardware / Software Codesign, Los Alamitos, California, pp. 167–171. IEEE Computer Society Press. Teich, J., E. Zitzler, and S. S. Bhattacharyya (1998). Buffer memory optimization in DSP applications — an evolutionary approach. In A. E. Eiben, T. B¨ack, M. Schoenauer, and H.-P. Schwefel (Eds.), Fifth International Conference on Parallel Problem Solving from Nature (PPSN-V), Berlin, Germany, pp. 885–894. Springer. Teich, J., E. Zitzler, and S. S. Bhattacharyya (1999). 3d exploration of software schedules for DSP algorithms. In 7th International Workshop on Hardware/Software Codesign (CODES’99), New York, pp. 168–172. ACM Press. Todd, D. S. and P. Sen (1997). A multiple criteria genetic algorithm for containership loading. In T. B¨ack (Ed.), Proceedings of the Seventh International Conference on Genetic Algorithms, San Francisco, California, pp. 674–681. Morgan Kaufmann. ˇ T¨orn, A. and A. Zilinskas (1989). Global Optimization. Berlin: Springer. Vaidyanathan, P. P. (1993). Multirate Systems and Filter Banks. Englewood Cliffs, New Jersey: Prentice Hall. Valenzuela-Rend´on, M. and E. Uresti-Charre (1997). A non-generational genetic algorithm for multiobjective optimization. In T. B¨ack (Ed.), Proceedings of the Seventh International Conference on Genetic Algorithms, San Francisco, California, pp. 658–665. Morgan Kaufmann. Veldhuizen, D. A. V. (1999, June). Multiobjective Evolutionary Algorithms: Classifications, Analyses, and New Innovations. Ph. D. thesis, Graduate School of Engineering of the Air Force Institute of Technology, Air University. Veldhuizen, D. A. V. and G. B. Lamont (1998a). Evolutionary computation and convergence to a pareto front. In J. R. Koza, W. Banzhaf, K. Chellapilla, K. Deb, M. Dorigo, D. B. Fogel, M. H. Garzon, D. E. Goldberg, H. Iba, and R. Riolo (Eds.), Genetic Programming 1998: Proceedings of the Third Annual Conference, San Francisco, CA, pp. 22–25. Morgan Kaufmann. Veldhuizen, D. A. V. and G. B. Lamont (1998b). Multiobjective evolutionary algorithm research: A history and analysis. Technical Report TR-98-03, Department of Electrical and Computer Engineering, Graduate School of Engineering, Air Force Institute of Technology, Wright-Patterson AFB, Ohio. Wolpert, D. H. and W. G. Macready (1997, April). No free lunch theorems for optimization. IEEE Transactions on Evolutionary Computation 1(1),
122
BIBLIOGRAPHY
67–82. Zitzler, E., J. Teich, and S. S. Bhattacharyya (1999a). Evolutionary algorithm based exploration of software schedules for digital signal processors. In W. Banzhaf, J. Daida, A. E. Eiben, M. H. Garzon, V. Honavar, M. Jakiela, and R. E. Smith (Eds.), Proceedings of the Genetic and Evolutionary Computation Conference (GECCO’99), Volume 2, San Francisco, CA, pp. 1762–1769. Morgan Kaufmann. Zitzler, E., J. Teich, and S. S. Bhattacharyya (1999b). Evolutionary algorithms for the synthesis of embedded software. IEEE Transactions on VLSI Systems. To appear. Zitzler, E., J. Teich, and S. S. Bhattacharyya (1999c). Multidimensional exploration of software implementations for DSP algorithms. VLSI Signal Processing Systems. To appear. Zitzler, E., J. Teich, and S. S. Bhattacharyya (1999d, July). Optimized software synthesis for DSP using randomization techniques (revised version of TIK Report 32). Technical Report 75, Computer Engineering and Networks Laboratory (TIK), Swiss Federal Institute of Technology (ETH) Zurich, Gloriastrasse 35, CH-8092 Zurich, Switzerland. Zitzler, E. and L. Thiele (1998a, May). An evolutionary algorithm for multiobjective optimization: The strength pareto approach. Technical Report 43, Computer Engineering and Networks Laboratory (TIK), Swiss Federal Institute of Technology (ETH) Zurich, Gloriastrasse 35, CH8092 Zurich, Switzerland. Zitzler, E. and L. Thiele (1998b). Multiobjective optimization using evolutionary algorithms — a comparative case study. In A. E. Eiben, T. B¨ack, M. Schoenauer, and H.-P. Schwefel (Eds.), Fifth International Conference on Parallel Problem Solving from Nature (PPSN-V), Berlin, Germany, pp. 292–301. Springer. Zitzler, E. and L. Thiele (1999). Multiobjective evolutionary algorithms: A comparative case study and the strength pareto approach. IEEE Transactions on Evolutionary Computation. To appear.