TRD 383
No. of Pages 13, Model 3+
ARTICLE IN PRESS
27 August 2007 Disk Used
1
Transportation Research Part D xxx (2007) xxx–xxx www.elsevier.com/locate/trd
3
Elizabeth J. Wilson
4
, Ryan Wilson b, Kevin J. Krizek
a
b
Humphrey Institute of Public Affairs, University of Minnesota, 301 19th Avenue S., Minneapolis, MN 55455, USA Active Communities/Transportation (ACT) Research Group, University of Minnesota, 301 19th Avenue S., Minneapolis, MN 55455, USA
7
Abstract
ED
8
b
PR
5 6
a,*
OO F
The implications of school choice on travel behavior and environmental emissions
2
We examine the implications of school choice on walkability, school travel mode and overall environmental emissions. In developing this proof-of-concept model we show—and quantify—differences between city-wide schools and their neighborhood school counterpart. Our analysis demonstrates how children attending city-wide schools may have heightened travel distance, greenhouse gas emissions, and exposure to bus fumes. Using available data along with a series of informed assumptions we figure the city-wide school had six times fewer children walking, 4.5 times as many miles traveled, 4.5 times the system cost, and 3–4.5 times the amount of criteria air pollutants and greenhouse gas emissions. By providing bus service, the overall miles traveled (and resulting emissions) decreased 30–40% compared to the scenario without bus service, however system costs were higher for both the neighborhood and city-wide school (no pollution externality costs were factored in). Ó 2007 Elsevier Ltd. All rights reserved.
19 20
Keywords: School choice; School transportation; Child travel; Environmental impact
21
1. Introduction
22
One is hard pressed these days to find community-planning initiatives in the not stressing the importance of walking. Motivated by issues ranging from traffic congestion to obesity, increasing walkability is front and center in countless planning programs throughout Europe and North America. School-age children are an often targeted population of such walking initiatives. In the US, for example, major transportation legislation has helped programs to spring up under the banner of Safe Routes to School. These programs require satisfying at least three criteria to advance their success: (1) the presence of a neighborhood school, (2) school-age children in the neighborhood, and of course and (3) safe routes between the two (safe usually meaning lower traffic speeds, highly visible street crossings, sidewalks, etc.). However, a fourth—and critical—ingredient that often goes unacknowledged stems from whether school-age children in the neighborhood attend the neighborhood
25 26 27 28 29 30
RE
CO R
24
UN
23
CT
9 10 11 12 13 14 15 16 17 18
*
Corresponding author. E-mail address:
[email protected] (E.J. Wilson).
1361-9209/$ - see front matter Ó 2007 Elsevier Ltd. All rights reserved. doi:10.1016/j.trd.2007.07.007
Please cite this article in press as: Wilson, E.J. et al., The implications of school choice on travel behavior ..., Transport. Res. Part D (2007), doi:10.1016/j.trd.2007.07.007
TRD 383 27 August 2007 Disk Used 2
No. of Pages 13, Model 3+
ARTICLE IN PRESS
E.J. Wilson et al. / Transportation Research Part D xxx (2007) xxx–xxx
50
2. History and costs of school choice
51 52
70
School choice advocates span the political spectrum and often cite benefits such increased accountability of educators, improved performance of schools, greater involvement of parents, and most importantly, better outcomes for children (Schneider et al., 1997). Such programs initially emerged, in the UK as well as the US, in efforts to promote voluntary desegregation of schools. The research on the efficacy of such claims remains mixed (Taylor and Gorard, 2001; Schellenberg and Porter, 2003). Alternatively, advocates cite the market-based competition driving better school outcomes (Whitty, 1998). While various forms of school choice exist (e.g., inter-district, intra-district and public vouchers among others), each geographically divorces the location of the residence with the location of the school that the student will attend. Overall, school choice has become a popular and preferred schooling strategy with parents. The 2002 US legislation, No Child Left Behind, also encourages school choice. The legislation allows students whose school has not maintained adequate progress for two years to attend a school with better test scores and encourages the funding of magnet schools (see Part B, Voluntary Public School Choice Program 115 Stat. 1803 (2002)). Such programs have been fervently embraced by liberals, conservatives, economists, and social activists (Gorard et al., 2001). Parent satisfaction ranks higher among parents who choose their child’s school (Witte and Thorn, 1996; Powers and Cookson, 1999). However, school choice imposes societal costs. Because schools that many children attend are no longer located in their immediate neighborhoods, fewer children can walk-to-school. From a transportation perspective alone, the additional travel to and from a non-neighborhood school increases total miles driven, bussing services, subsequent air pollutant emissions, and in some cases imposes an additional burden to the household. We describe, in narrative form, many of these costs below.
71
2.1. Physical activity and health
72 Q1
School location is a critical factor influencing child travel behavior. In the words of McMillan et al. (2006), ‘‘living within one mile of a school appears to have the most significant effect on active travel to school. The odds ratios indicate a distance of less that one mile between home and school makes it almost three times more likely that a child will walk/bike to school’’. Fewer children now walk-to-school than 35 years ago, decreasing from 41% in 1969 to 13% in 2003. In addition to the importance of location this decrease in walking is tied to higher rates of car ownership, mothers’ participation in the labor force, and other social factors (McDonald,
39 40 41 42 43 44 45 46 47 48
53 54 55 56 57 58 59 60 61 62 63 64 65 66 67 68 69
73 74 75 76 77
PR
38
ED
37
CT
36
RE
34 35
CO R
33
UN
32
OO F
49
school. Not satisfying both of the first two criteria possibly undermines the importance of—and need for—the third criteria. An issue often de-linking the first two ingredients, school choice, is one of the most passionately felt public policies conceptualized, at least in the US School choice has radically transformed where children go to school and the role of the neighborhood school. Curricular and other considerations lead millions of school-age children to bypass their neighborhood school in favor of one across town. Just like many families often bypass the closest grocery store on account of tastes, quality, or preferences, children pass up their neighborhood school, bringing into question the merits of geographically based urban planning programs such as Safe Routes to School. In this paper we examine how children’s travel to school is affected by two distinct but related issues: school choice and providing bus service. We analyze children’s travel to two types of schools, one neighborhood school and one city-wide magnet school, with and without bus service. This proof-of-concept approach allows us to estimate first order implications of environmental emissions and allows for the discussion of larger economic and travel considerations. This work advances our understanding of how school choice affects distance traveled for school travel and mode choice within a US context. We present a methodology, drawn from interdisciplinary approaches, that provides a systems approach to respond to different, yet related questions related to school choice: travel, environmental emissions, children’s activity and health. This approach allows us to account for other system ‘externalities’ that stem from school choice policy.
31
Please cite this article in press as: Wilson, E.J. et al., The implications of school choice on travel behavior ..., Transport. Res. Part D (2007), doi:10.1016/j.trd.2007.07.007
TRD 383
No. of Pages 13, Model 3+
ARTICLE IN PRESS
27 August 2007 Disk Used
E.J. Wilson et al. / Transportation Research Part D xxx (2007) xxx–xxx
3
2005). Taken together, this shift away from children walking to school also adversely impacts both traffic and environmental emissions. 80 Many schools are no longer requiring physical education and many children are not engaging in sufficient 81 levels of physical activity (Trost et al., 2002). Driven by concerns of increasing childhood obesity, several fed82 eral and state initiatives focus on increasing the percentage of children walking to school. The Center for Dis83 ease Control’s Kids Walk-to-School program and state ‘‘Safe Walk to School’’ initiatives are two examples. 84 Among a child’s overall travel budget, the walk-to-school—and the physical environment surrounding the 85 school—are suggested to be an integral component of a child’s daily physical activity (Krizek et al., 2004). 86 Subsequently, considerable funding has been made available for programs such as the national Safe Routes 87 to School Program funded through the Safe, Accountable, Flexible, Efficient Transportation Equity Act 88 (SAFETEA-LU) (Sec. 1404) (2005). 89 While research confirms declining levels of child activity overall and among children entering adolescence 90 Q2 (Sallis et al., 2000) studies examining the role of walking to school on activity levels are not as conclusive. 91 Walking to school is cited as a factor to increase activity (Dietz and Gortmaker, 2001), although the few pub92 lished reports that have specifically focused on the impact of walking to school on overall activity are ambig93 uous. The difficulty is understanding where such activity fits, if at all, into a child’s travel or physical activity 94 budget. One British study found no effect on activity for five-year olds driven to school (Metcalf et al., 2004), 95 and a second British study found increased activity correlated to walking to school, yet the effect was only 96 significant for boys (Cooper et al., 2003). Additional research for US populations and older children is crucial 97 before any substantive conclusions can be drawn. 78
ED
PR
OO F
79
2.2. Increased in auto and bus travel distance
99
Vehicle miles traveled (VMT) in the US has been increasing steadily at an estimated 2.5% per year, placing further concern on rising congestion, air pollution and greenhouse gas emissions from the transportation sector (Pickrell and Schimek, 1998). Increasing numbers of children unable to walk-to-school leads to longer vehicle travel distances and driving times, resulting in at least three impacts: congestion, localized air pollution, and greenhouse gas emissions. If children do not walk or bicycle to school, they are driven by car or bus. Approximately 55% of school trips were by automobile in 2001, up from 16% in 1969. This increase has implications for overall traffic and environmental emission patterns. Additionally, concentrated traffic congestion around schools and busy roadways greatly decreases child safety in walking to school, a reason many successful walk-to-school programs have targeted traffic calming measures. A number of states in the US require districts to provide bussing to school, at significant cost, while others do not, assuring that more children will travel by private car. Overall traffic increases can intensify congestion and raise emission rates of criteria air pollutants (Nitrogen oxides, particulate matter, carbon monoxide) impacting local air quality. From an accident risk perspective, school buses are one the safest forms of transportation; only 0.32% of all fatal accidents involve school buses (National Highway Traffic Safety Administration, 2004). However, diesel emissions are well known carcinogens and respiratory irritants, implicated in exacerbation asthma attacks (Sydbom et al., 2001). Concentrations of harmful diesel emissions inside school buses has been measured at two to five times that of ambient concentrations for black carbon and other diesel related pollutants (Solomon et al., 2001). Sabin et al. (2005) estimate that roughly 30% of a child’s exposure to diesel pollutants comes from a 1-h bus ride in a 24-h day. Emissions from automobiles also impact local air quality and Table 1 shows the additional transportation emissions and additional exposures from traffic exhaust from different modes of travel. With new ultra-low sulfur diesel (ULSD) regulations requiring a 15 ppm sulfur limit phased in October 2006, followed by heavy duty engine requirements (reducing allowable on-road particulate levels an order of magnitude from 0.1 g/brake horse-power to 0.01 g/bh-p) effective in January 2007, school bus emissions will improve over time. However, with one-third of the current US school bus fleet built before 1990, existing school buses will be used a long time. Penetration of new technology and its diffusion will be slow. Retrofits with particulate traps or catalysts can also reduce harmful diesel emissions in the short term. Additionally, recent high cost of diesel fuel has highlighted the overall expense of providing bus service to municipalities.
103 104 105 106 107 108 109 110 111 112 113 114 115 116 117 118 119 120 121 122 123 124 125 126 127
RE
102
CO R
101
UN
100
CT
98
Please cite this article in press as: Wilson, E.J. et al., The implications of school choice on travel behavior ..., Transport. Res. Part D (2007), doi:10.1016/j.trd.2007.07.007
TRD 383 27 August 2007 Disk Used 4
No. of Pages 13, Model 3+
ARTICLE IN PRESS
E.J. Wilson et al. / Transportation Research Part D xxx (2007) xxx–xxx
Table 1 Additional transportation emissions and additional exposure from traffic exhaust Additional exposures from traffic exhaust
None None
Car School bus
(reference condition) Marginal emissions as per student are very small. Average emissions per student are small (see below for data)
None Similar to car. Use of side streets reduces exposures, but travel duration per mile is greater for non-motorized than for motorized travel (see reports by David Briggs) (reference condition) Higher than car owing to self-pollution and longer travel time
OO F
Additional transportation emissions No travel Bicycle/ walk
Source: Gulliver and Briggs (2005).
133
2.3. School bus cost
134
138
The cost of transportation for school choice is often hotly debated, especially with rising fuel costs. School bus costs are calculated as bus ‘‘runs’’. For example, in St. Paul, Minnesota (MN), a single bus serves at least three schools a day. School bus costs decrease significantly with each run. In St. Paul, the first run costs $264.11, the second, $5.17, the third $5.46, and the fourth $3.26. An estimated 5% of the St. Paul school district’s budget is spent on transportation (School Choice Taskforce, 2005).
139
2.4. Travel burden on households
140 141
148
Additionally, there is a potential burden placed on households who end up driving children to school. The daily school schedule locks a parent or guardian into specific travel times, routes, and patterns of chauffeuring that may or may not align with their overall schedule. Many caregivers may be able to seamlessly work chauffeuring responsibilities into their timetable (e.g., on the way to or from work or other errands) and it some cases, we acknowledge that walking a child to school may be more time consuming than driving them to school. However, available research suggests that over one-half of parents who bring a child to school return home immediately afterwards (McMillan, 2005). For many households, transporting children to a school that is further away than their neighborhood school is a task that places an additional travel burden on the household.
149
3. Framework and analysis
150
3.1. Case study setting
151
Having articulated various costs associated with theoretically greater levels of travel, for both school-age children and their caregivers, we now turn to presenting a methodology and analysis to estimate values that directly measure three costs described in narrative form above: decreased children walking, increased travel distances, and increased pollution. Our investigation takes place in St. Paul, Minnesota. St. Paul, together with the adjacent city of Minneapolis, forms the Twin Cities, with each city covering approximately 57 square miles. The separate central business districts for the two cities are within 10 miles of one another. According to the 2000 Census of Population and Housing, Minneapolis has roughly 100,000 more residents than St. Paul (382,618 versus 287,151) (US
137
142 143 144 145 146 147
152 153 154 155 156 157 158
ED
136
CT
135
RE
131
CO R
130
UN
129
PR
132
In addition to the health and air quality implications from cars and bus emissions, increased driving also results in additional greenhouse gas emissions. In the US, the transportation sector produces roughly 30% of the seven billion tons of CO2 equivalent greenhouse gases (US Environmental Protection Agency, 2006a,b,c). Eighty percent of transport-related greenhouse gas emissions come from gasoline powered vehicles, with diesel burning vehicles tallying the remaining 20%.
128
Please cite this article in press as: Wilson, E.J. et al., The implications of school choice on travel behavior ..., Transport. Res. Part D (2007), doi:10.1016/j.trd.2007.07.007
TRD 383
No. of Pages 13, Model 3+
ARTICLE IN PRESS
27 August 2007 Disk Used
5
CT
ED
PR
OO F
E.J. Wilson et al. / Transportation Research Part D xxx (2007) xxx–xxx
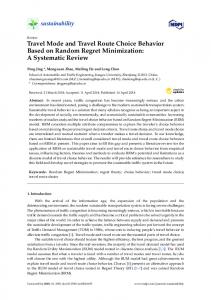
Fig. 1. Location of Public K-6 Schools in St. Paul, MN, with 1-mile buffers.
163 164 165 166 167 168 169 170 171 172 173 174 175 176
RE
162
Census Bureau, 2006). Each is governed by separate school districts and both support open enrollment of elementary, middle, and high school-age children. For a ‘walk to school’ poster city, St. Paul is hard to beat. We estimate that 96% of children live within one mile of an elementary school. Fig. 1 displays the location of public K-61 neighborhood, city-wide and magnet schools with one mile (airline distance) buffers around each to highlight areas within potential walking distance to school for children (displayed in grey). Nearly all streets in the city have sidewalks and the urban form, mostly dating from pre-WWII, creates a sense of intimacy (i.e., there are few urban form features commonly associated with post WWII building such as large parking lots or extremely wide roadways). St. Paul is also home to many successful and popular city-wide, magnet, and charter schools,2 which are often located in another neighborhood or even across town from where the student lives. The school district designates schools as either a neighborhood school or a city-wide school. For the neighborhood school, children are able to attend if they live within a certain geographic boundary. In order to preserve racial diversity in the face of high levels of neighborhood and residential segregation, these boundaries are not always contiguous but usually draw from the community surrounding the school. Children living anywhere within St. Paul are eligible to attend a city-wide school. While race is no longer a deciding characteristic for admittance, the ‘‘number of students receiving free or reduced lunch’’ is often used to ensure varied socio-economic classes (Schellenberg and Porter, 2003). St. Paul currently houses 20 neighQ3 borhood schools and 32 city-wide or magnet schools (Belden, 2006). In 1974 almost all students within the
CO R
160 161
UN
159
1
Kindergarten through sixth grade, approximately children aged 5–12. Magnet schools are open to all students in the district and are usually oriented around a theme (language, culture, science). Charter schools operate independently of the school district and usually governed by a board or organization under a charter with the state. Charter schools are not included in the analysis here. 2
Please cite this article in press as: Wilson, E.J. et al., The implications of school choice on travel behavior ..., Transport. Res. Part D (2007), doi:10.1016/j.trd.2007.07.007
TRD 383 27 August 2007 Disk Used
E.J. Wilson et al. / Transportation Research Part D xxx (2007) xxx–xxx
ED
PR
OO F
6
No. of Pages 13, Model 3+
ARTICLE IN PRESS
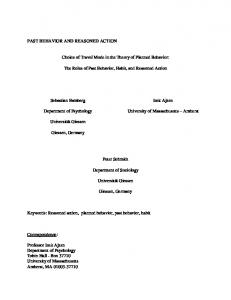
Fig. 2. Methodological approach.
180
3.2. Methodology
181 182
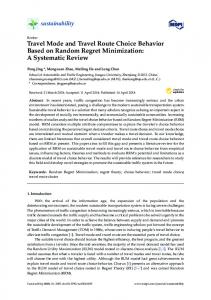
Our analysis is based on comparing student travel behaviors from one neighborhood K-6 school and one city-wide K-8 school. For purposes of this illustrative analysis, we were guided by enrollment data and bus schedule and route information that was readily available to the research team. We have little reason to believe that the schools we chose were notably different than the ‘‘average’’ schools of their type. Our first task is to estimate travel differences between the two schools. Local data for such is preferred; however, as it was unavailable, we resorted to using national level data on children’s home-to-school travel behavior that has been carefully analyzed in other contexts (McDonald, 2005). We have little reason to believe such national level estimates are not applicable to our case setting. The methodology follows the steps summarized in Fig. 2. The first is to geo-code the home address of students attending each school.3,4 The analysis mapped multiple students from a single address attending the same school separately. However, trip distances were calculated from each address.5 The second step was to glean information about the child’s travel mode to the respective schools, either by walking or cycling, driven by bus, or driven by automobile. We obtained bus routes for each school—three for
184 185 186 187 188 189 190 191 192 193
RE
CO R
183
3
UN
178
CT
179
St. Paul school district attended a school located within or near their neighborhood; in 2005, an estimated 67% of St. Paul district students attended a school that was not their neighborhood school (School Choice Taskforce, 2005).
177
While these lists do not contain all students’ information (parents must agree to publication of the data), they illustrate the spatial distribution of the student population (Note: one of the authors is a parent at one of the schools). 4 After geo-coding the address information (295 points for the neighborhood school, 933 for the city-wide school), addresses outside of St. Paul city limits were removed (about 7% and 5% of data points respectively), as the research question here is to focus on the implications of intra-district choice and to avoid inadvertently weighting the travel distance data, leaving 274 points for the neighborhood school and 882 for the city-wide school. 5 For example, if three children attend the same school, each contributes only one-third of the household miles to account for household carpooling.
Please cite this article in press as: Wilson, E.J. et al., The implications of school choice on travel behavior ..., Transport. Res. Part D (2007), doi:10.1016/j.trd.2007.07.007
TRD 383
No. of Pages 13, Model 3+
ARTICLE IN PRESS
27 August 2007 Disk Used
7
Q7
PR
OO F
E.J. Wilson et al. / Transportation Research Part D xxx (2007) xxx–xxx
Fig. 3. Distribution of students (points) and bus routes (lines) for the neighborhood (left) and city-wide (right) schools. Table 2 Percent of children traveling via different modes based on distances from home to school 3.0
CO R
195
2.0–3.0
6
UN
194
1.0–2.0
CT
Source: adapted from McDonald (2005).
ED
Distance (miles)
The national travel mode data in McDonald (2005) covers K-12 students, yet our study population is elementary schools. These assumptions may overestimate the number of young students walking longer distances and highlights the usefulness of further investigation on younger student travel behavior. 7 Using more localized data would be preferred. One notable improvement is that it would be ideal to know how rate of use in Table 1 differed for student populations who did and did not have a school bus available. 8 For example, McMillan et al. (2006) found that 54% of caregivers returned home after dropping off the child. We only calculated oneway travel, once to the school in the morning, and once home in the afternoon. For this analysis, we only included the portion of the trip where the child was present.
Please cite this article in press as: Wilson, E.J. et al., The implications of school choice on travel behavior ..., Transport. Res. Part D (2007), doi:10.1016/j.trd.2007.07.007
TRD 383 27 August 2007 Disk Used 8
No. of Pages 13, Model 3+
ARTICLE IN PRESS
E.J. Wilson et al. / Transportation Research Part D xxx (2007) xxx–xxx
Table 3 Percent of children using different travel mode splits for the ‘No Bus Service’ scenario 3.0
School bus Auto Walk/bike Total
0 16.3 83.7 100
0 44.1 55.9 100
0 60.7 39.3 100
0 85.7 14.3 100
0 92.3 7.7 100
0 99.0 1.0 100
Source: adapted from McDonald (2005).
Table 4 Vehicle assumptions, CO2 and criteria pollutant emissions factors, from Mobile 6.2 Vehicle miles traveled distribution
Miles/ gallon
CO2 (g/ mi)
Total PM10 g/mi
CO2 (g/ mi)
NOx (g/ mi)
Light duty gasoline vehicle Light duty gasoline truck 6000 lbs School bus
0.4091 0.3449 0.1176
24.1 18.7 14.4 6.2
335.8 485.6 592.5 1632
0.0115 0.012 0.0128 0.7171
18.31 21.32 26.38 2.63
0.888 1.164 1.642 11.946
218 219 220 221 222 223 224 225 226 227 228 229 230 231 232 233 234 235 236 237 238 239
ED
CT
217
RE
215 216
CO R
214
eled per bus to explore the effect of bus transportation on emissions. These upper and lower scenarios for nonwalking students—all private travel versus bus and private travel—bound the potential range of emissions. We again use information from Table 1 to determine the percentage of children riding a bus at each distance. Adding geo-coded bus routes provides a bus distance and subsequently an average total-distance traveled for each bus. For each scenario, we then calculated the average bus miles traveled per student. The number of bus routes serving each school was proportionally allotted, with the normalized neighborhood school being served by three bus routes and the city-wide school having eight. To estimate the cost of school buses, we assumed that each bus serves three schools, making six runs daily. According to 2005 figures for the St. Paul School District, the average cost of a run is roughly $47 (which assumes runs five and six were the same cost as run four, $3.47) (School Choice Taskforce, 2005). Using the national average 180 day school year, we then calculated annual costs of bus service (National Center for Education Statistics, 2006). Barring per mile charges on bus service, this approach underestimates the financial implications of the longer city-wide bus routes. Personal vehicle costs of $0.56 per mile were taken from the American Automobile Association (AAA) (American Automobile Association, 2006) to estimate the cost of driving a personal vehicle. Finally, criteria pollutant and greenhouse gas emissions are estimated for each scenario using emissions factors from running the US EPA’s Mobile 6.2 emissions model (US Environmental Protection Agency, 2006a,b,c).9 While criteria pollutant emissions significantly vary depending on the individual vehicle, values in Table 4 provide a rough estimate of the emission rates (Frey, 1997). We assumed a national personal vehicle fleet mix of 50% light duty cars and 50% SUVs Trucks/Minivans (US Environmental Protection Agency, 2005) and other fleet characteristics as shown in Table 3. From this data, we calculated per capita emissions for a student at each school. To summarize, the data sources and assumptions implicit in our framework employed: (a) local student populations from ‘‘typical’’ neighborhood and city-wide St. Paul schools to estimate distances traveled per student, (b) actual routes from local school buses, (c) the number of runs and distance parameters for typical bus routes from local data, (d) rates of walking/cycling (for varying distances) carefully gleaned from national figures, (e) emissions calculations from Mobile 6.2, specified for St. Paul weather conditions (September–June) and (f) personal vehicle costs from the AAA. Other assumptions include: a normalized 350 student school, national fleet mix, and average St. Paul cost of bus service.
UN
213
PR
Mobile 6.2 model assumptions and emission rates
Source: US Environmental Protection Agency (2005).
212
OO F
Distance (miles)
9
St. Paul specific temperature (September–June) and diesel sulfur data and otherwise are used as model defaults. The particulate matter (PM2.5) PM2.5 incorporates organic carbon, sulfite particles, elemental and residual carbon, brake wear.
Please cite this article in press as: Wilson, E.J. et al., The implications of school choice on travel behavior ..., Transport. Res. Part D (2007), doi:10.1016/j.trd.2007.07.007
TRD 383
No. of Pages 13, Model 3+
ARTICLE IN PRESS
27 August 2007 Disk Used
E.J. Wilson et al. / Transportation Research Part D xxx (2007) xxx–xxx
9
4. Results
241
246
Table 5 presents the results from the analysis for a school that, for comparative purposes, has been normalized to 350 students. The table shows system difference between neighborhood and city-wide school cases on mode choice, system miles driven (car and bus), and estimated environmental emissions. Two scenarios are explored, one examining a system without bus service and the other with bus service. The difference between city-wide and neighborhood results is shown. Only trips where the child was present were included in calculating distance and environmental emissions.
247
4.1. Walking to school rates
248
254
The number of students walking to the neighborhood school was calculated at more than six times greater than the city-wide school. For the 32–34.7% of the neighborhood children walking, the median daily distance walked (to and from school) was estimated at 0.8 miles when bus service was provided and 0.9 miles when no bus service was provided. The 5–6.6% of city-wide children walking had a median distance (to and from school) of 2.5 miles for the scenario where bus service was provided and 2.8 miles without bus service, reflective of the greater dispersion of residences throughout the urban area and adhering to the walking percentages in Tables 1 and 2.
255
4.2. Bus service impact on travel behavior
256
In the scenario without bus service, reflecting the situation in many urban communities, 93% of the citywide students were driven by automobile, compared to 65% of the neighborhood students. The distances traveled were greater too, with neighborhood school caregivers driving 2.2 miles to transport their children and city-wide caregivers driving 7 miles, again reflecting the dispersion of students across the city. The annual miles traveled and associated air emissions were 4.5 times as great for the city-wide school as for the neighborhood school. The second scenario assumed bus service was provided to a percentage of students in accordance with Table 1. A slightly lower number of children walked to school (as the location of their homes did not move), but
252 253
257 258 259 260 261 262 263
PR
251
ED
250
CT
249
RE
245
Table 5 Difference between neighborhood and city-wide School mode choice, system miles driven, and estimated environmental emissions 350 child school
No bus service
CO R
244
Neighborhood
City-wide
Bus service Difference
Neighborhood
City-wide
31.8(0.9) 50.4(1.7) 17.9(14.3)
5.1 (2.5) 58.4 (6.5) 36.5(17.3)
11,642 54,613 7722 62,335
8033 237,676 21,748 259,424
0.7 4.4 2.8 4.2
4.5
$35,032 $50,760 $85,792
$145,796 $118,440 $264,236
4.2 2.3 3.1
4.5 4.5 4.5 4.5
35 1.1 0.148 6179
133 4.8 0.504 18,388
3.8 4.4 3.4 3.0
Mode choice % (miles per day) Walking/biking 34.7 (0.8) Driving 65.3 (2.2) Bussing 0
6.6 (2.8) 93.4 (6.9) 0
Annual system impacts Total walked miles Total car miles Total bus miles Total miles driven
17,926 90,505 0 90,505
11,642 406,010 0 406,010
0.6 4.5
Transportation costs Total car cost Total bus cost Total system cost
$50,864 $0 $50,864
$228,178 $0 $228,178
4.5
Environmental emissions CO2 (tons) CO (tons) NOx (tons) Total PM10 (g)
37 1.8 0.093 1063
167 8.0 0.417 4771
UN
242 243
OO F
240
4.5
Difference
Please cite this article in press as: Wilson, E.J. et al., The implications of school choice on travel behavior ..., Transport. Res. Part D (2007), doi:10.1016/j.trd.2007.07.007
TRD 383 27 August 2007 Disk Used 10
No. of Pages 13, Model 3+
ARTICLE IN PRESS
E.J. Wilson et al. / Transportation Research Part D xxx (2007) xxx–xxx
Table 6 Difference between no school bus service and bus service scenarios
266 267 268 269
Difference
Walking/biking Driving Bussing
31.8(0.9) 50.4(1.7) 17.9(14.3)
34.7 (0.8) 65.3 (2.2) 0
Annual system impacts Total walked miles Total car miles Total bus miles Total miles driven
11,642 54,613 7722 62,335
17,926 90,505 0 90,505
Transportation costs Total car cost Total bus cost Total system cost
$35,032 $50,760 $85,792
$50,864 $0 $50,864
0.7
Environmental emissions CO2 (tons) CO (tons) NOx (tons) Total PM10 (g)
35 1.1 0.148 6179
37 1.8 0.093 1063
0.9 0.6 1.6 5.8
0.6 0.6 0.7
1.7
Bus service
No bus service
5.1 (2.5) 58.4 (6.5) 36.5 (17.3)
6.6 (2.8) 93.4 (6.9) 0
OO F
No bus service
Difference
8033 237,676 21,748 259,424
11,642 406,010 0 406,010
0.7 0.6
$145,796 $118,440 $264,236
$228,178 $0 $228,178
0.6
133 4.8 0.504 18,388
167 8.0 0.417 4771
0.8 0.6 1.2 3.9
0.6
1.2
ED
265
City-wide
Bus service
driving went down. Fifty percent of the neighborhood school children were driven compared to 58% of the city-wide school children, with 18% and 37% taking the bus respectively. While the environmental emissions for the city-wide school were more than for the neighborhood school, the magnitude of carbon monoxide (CO) and carbon dioxide (CO2) emissions were lower than the no bus alternative. Emissions of oxides of nitrogen (NOx) and particulate matter (PM2.5) were higher for this case than the no bus service scenario, highlightQ5 ing the impact of school buses that have not been retrofitted (see Table 6).
CT
264
Neighborhood
PR
350 child school
5. Discussion
271
In the scenario without buses, the city-wide school had six times fewer children walking, 4.5 times more miles traveled, 4.5 times the system cost, and 4.5 times the emissions of criteria air pollutants and greenhouse gases. By providing bus service, the overall miles traveled (and resulting emissions) were 60–70% of the scenario where no bus service was provided, however system costs were higher for both the neighborhood school and city-wide schools (no pollutant externality costs were factored in). Still, the neighborhood school was 3.1– 4.5 times less expensive for transportation cost under both scenarios than the city-wide school. These findings alone suggest school choice has an important and demonstrable effect on travel distance and system cost. As six times fewer children were able to walk to the city-wide school, this questions the merits of investing in Safe Routes to Schools programs (over $612 million between 2005 and 2009) where school choice programs are available. The larger policy recommendation for neighborhood walkability suggests that the implications of specific school district choice programs must be addressed in conjunction with traffic patterns, which are often the sole focus for safe routes to school initiatives.10 In an era of increasing VMT and congestion, farther distances mean increased travel time and associated air emissions. For city planners interested in air quality and reducing VMT, the implications of school choice on congestion modeling and air emissions around school zones is ripe for study, given that the modeled city-wide school emitted roughly 4.5 times the amount of transportation-related air emissions compared to the neighborhood school.
275 276 277 278 279 280 281 282 283 284 285 286 287
CO R
274
UN
272 273
RE
270
10 The travel mode data used for this study covers K-12 students, yet our sample schools are K-6. It seems probable that younger student walking is more limited, and these national assumptions potentially overestimated the walking proportion at longer distances; further investigation on younger student travel behavior is warranted.
Please cite this article in press as: Wilson, E.J. et al., The implications of school choice on travel behavior ..., Transport. Res. Part D (2007), doi:10.1016/j.trd.2007.07.007
TRD 383
No. of Pages 13, Model 3+
ARTICLE IN PRESS
27 August 2007 Disk Used
E.J. Wilson et al. / Transportation Research Part D xxx (2007) xxx–xxx
11
316
6. Conclusions
317
Integrating district policies on school choice and children’s school travel with information on child physical activity and environmental pollutant emissions will allow for educators and planners to better manage potential side-effects of school choice programs. The primary contribution of this research is that it provides a proof-of-concept approach that weaves together different analysis—and disciplines—to demonstrate ‘‘first order’’ implications of school choice policies; we recognize the case study approach warrants more comprehensive study. Natural extensions to this work include pairing analyses of school choice with travel behavior and activity models, calculating risk from different modes of travel, linking to emissions exposure models, and exploring different kinds of school choice within rural, suburban and urban environments. Furthermore, in the US, at least two factors are important for understanding school choice and travel, which may have little to do with school choice in some communities. First, many ‘‘neighborhood’’ schools in newer neighborhoods are no longer walkable schools given their location at the fringe of residential areas on arterial streets (US Environmental Protection Agency, 2003). Second, the growing size of schools (more so for secondary schools than elementary schools, at least in the US) also increases average travel distances and reduces the option to walk. Altering children’s travel patterns for school choice carries significant transportation and cost implications for school districts, inconvenience implications for households, and societal implications in terms of traffic congestion, criteria pollutant emissions, and overall greenhouse gas emissions. However, while the societal
296 297 298 299 300 301 302 303 304 305 306 307 308 309 310 311 312 313 314
318 319 320 321 322 323 324 325 326 327 328 329 330 331 332 333
PR
295
ED
294
CT
293
RE
291 292
CO R
290
UN
289
OO F
315
Table 5 illustrates the need for a systems perspective when addressing emissions and transportation change, highlighting the importance of spillover effects. For example, the city-wide school with no bus service requires roughly 350,000 more miles driven compared to the neighborhood school with bus service, affecting both overall environmental emissions and societal cost. While a city manager accounting for greenhouse gas emissions might only focus upon the proportion of emissions directly attributed to the municipality, this analysis highlights the importance of quantifying spillover effects within the transportation sector. When the system costs are summed, the cost of a metric ton of CO2 ranges from roughly $1380–1900, costly, yet within the range of other greenhouse gas reduction costs in the transportation sector. Within each school type, CO and CO2 emissions increased in the no bus service scenario, but NOx and PM2.5 was higher in the presence of buses.11 Predictably, the length of the bus route was longer for the city-wide school, suggesting the average time that children spend on the bus is longer, yet the daily bus route times reflect this difference only slightly. The three neighborhood school bus routes averaged 76 min and the 8 city-wide school bus routes averaged 84 min. This could be an artifact of where the schools are located within the city, with the neighborhood school located in a corner of the city and the city-wide school being more centrally located. Increased travel time could mean an increased exposure to diesel emissions (Sabin et al., 2005), dependent upon the age of the bus fleet and the types of pollution controls installed. From a policy perspective, installing $1000–2000 pollution control retrofits on the longest bus routes could provide a cost effective way of controlling PM and NOx from diesel emissions and help to reduce exposure (Jones, 2006). We calculated the public, private and system costs to show the different financial implications of budgetary boundaries. In an era of shrinking educational budgets, school districts often focus on the public cost of transportation, sometimes prompting districts to limit or eliminate school bus service. However, the relative transportation cost difference between the neighborhood and city-wide school was twenty times greater than the cost difference of providing or not providing bus service, 450% greater rather than 20% more, suggesting strategies to efficiently implement school choice could be important for district planners interested in controlling transportation costs. Indeed, many districts have instituted ‘‘regional choice’’ where the metropolitan area is divided into different zones and school choice exists only within those particular zones. This option was also under consideration by St. Paul, but ultimately was too politically difficult to implement (School Choice Taskforce, 2005).
288
11
We did not quantify diesel retrofits or the costs of externalities (diesel exhaust, greenhouse gases) in this study, but they would allow for a more complete societal evaluation.
Please cite this article in press as: Wilson, E.J. et al., The implications of school choice on travel behavior ..., Transport. Res. Part D (2007), doi:10.1016/j.trd.2007.07.007
TRD 383 27 August 2007 Disk Used 12
No. of Pages 13, Model 3+
ARTICLE IN PRESS
E.J. Wilson et al. / Transportation Research Part D xxx (2007) xxx–xxx
336
implications may be important, they tend to weigh little on the family decision deciding where to send children to school. Integrating these factors into the planning by school districts could help to account for overall travel patterns and allow for more economically and environmentally sound implementation of school choice.
337
7. Uncited reference
335
338 Q6
Frey and Eichenberger (1997).
OO F
334
References
340 341 342 343 344 345 346 347 348 349 350 351 352 353 354 355 356 357 358 359 360 361 362 363 364 365 366 367 368 369 370 371 372 373 374 375 376 377 378 379 380 381 382 383 384 385 386 387 388 389
No Child Left Behind Act of 2001, 2002. 107–110, 107th Congress, January 8, 2002. Safe, Accountable, Flexible, Efficient Transportation Equity Act: A Legacy for Users (SAFETEA-LU), 2005. Public Law 109-59, August 10, 2005. American Automobile Association, 2006. AAA Says Average Driving Cost is 56.2 Cents per Mile (retrieved June 26, 2006). . Cooper, A.R., Page, A.S., Foster, L.J., Qahwahi, D., 2003. Commuting to school: are children who walk more physically active? American Journal of Preventative Medicine 25, 273–276. Dietz, W.H., Gortmaker, S.L., 2001. Preventing obesity in children and adolescents. Annual Review of Public Health 22, 337–353. Frey, H.C., 1997. Variability and Uncertainty in Highway Vehicle Emission Factors, in Emission Inventory: Planning for the Future. Air and Waste Management Association, Research Triangle Park, NC. Frey, H.C., Eichenberger, D.A., 1997. Remote sensing of mobile source air pollutant emissions: variability and uncertainty in on-road emissions estimates of carbon monoxide and hydrocarbons for school and transit buses. Center for Transportation Engineering Studies – North Carolina State University, Raleigh. Gorard, S., Fitz, J., Taylor, C., 2001. School choice impacts: what do we know? Educ. Res. 30, 18–23. Gulliver, J., Briggs, D.J., 2005. Time-space modeling of journey-time exposure to traffic-related air pollution using GIS. Environmental Research 97, 10–25. Jones, K. 2006. Minnesota Environmental Initiative, Wilson E, Personal Communication on June 23, 2006. Krizek, KJ., Birnbaum, A.S., Levinson, D.M., 2004. A schematic for focusing on youth in investigations of community design and physical activity. American Journal of Health Promotion 19, 33–38. McDonald, N., 2005. Children’s Travel: Patterns and Influences Ph.D. dissertation, City and Regional Planning, University of California at Berkeley, Berkeley. McMillan, T.E., 2005. Urban form and a child’s trip to school: the current literature and a framework for future. Research Journal of Planning Literature 19, 440–456. McMillan, T., Day, K., Boarnet, M., Alfonzo, M., Anderson, C., 2006. Johnny walks to school – does jane? Sex differences in children’s active travel to school. Children, Youth and Environments 16, 75–89. Metcalf, B., Voss, L., Jeffery, A., Perkins, J., Wilkin, T., 2004. Physical activity cost of the school run: impact on schoolchildren of being driven to school. British Medical Journal 329, 832–833. National Center for Education Statistics, 2006. Private School Universe Survey (PSS), 2001–2002 (retrieved June 23, 2006). . National Highway Traffic Safety Administration, 2004. School Transportation-related Crashes, Department of Transportation, Washington, DC. Pickrell, D., Schimek, P., 1998. Trends in Personal Motor Vehicle Ownership and Use: Evidence from the Nationwide Personal Transportation Survey. US DOT Volpe Center, Cambridge, MA. Powers, JM., Cookson, J.P.W., 1999. The politics of school choice research: fact, fiction, and statistics. Educational Policy 13, 104– 122. Sabin, L.D., Behrentz, E., Winer, A.M., Jeong, S., Fitz, D.R., Pankratz, D.V., Colome, S.D., Fruin, S.A., 2005. Characterizing the range of children’s air pollutant exposure during school bus commutes. Journal of Exposure Analysis and Environmental Epidemiology 15, 377–387. Sallis, JF., Prochaska, J.J., Taylor, W.C., 2000. A review of correlates of physical activity of children and adolescents. Medicine and Science in Sports and Engineering 32, 963–975. Schellenberg, S.J., Porter, C., 2003. School choice in established magnet school systems: voluntary desegregation after thirty-five years. In: Symposium on Are School Choice and Charter Schools Resegregating Public Schooling? at the Annual Meeting of the American Educational Research Association, Chicago. Schneider, M., Teske, P., Marschall, M., Mintrom, M., Roch, C., 1997. Institutional arrangements and the creation of social capital: the effects of public school choice. The American Political Science Review 91, 82–93. School Choice Taskforce, 2005. The Report of the School Choice Taskforce, Saint Paul Public Schools, St. Paul. Solomon, G.M., Campbell, T.R., Feuer, G.R., Masters, J., Samkian, A., Paul, K.A. 2001. No Breathing in the Aisles: Diesel Exhaust Inside School Buses, Natural Resources Defense Council, New York. Sydbom, A., Blomberg, A., Parnia, S., Stenfors, N., Sandstrom, T., Dahlen, S.-E., 2001. Health effects of diesel exhaust emissions. European Respiratory Journal 17, 733–746.
UN
CO R
RE
CT
ED
PR
339
Please cite this article in press as: Wilson, E.J. et al., The implications of school choice on travel behavior ..., Transport. Res. Part D (2007), doi:10.1016/j.trd.2007.07.007
TRD 383
No. of Pages 13, Model 3+
ARTICLE IN PRESS
27 August 2007 Disk Used
E.J. Wilson et al. / Transportation Research Part D xxx (2007) xxx–xxx
OO F
Taylor, C., Gorard, S., 2001. The role of residence in school segregation: placing the impact of parental choice in perspective. Environment and Planning A 30, 1829–1852. Trost, SG., Pate, R.R., Sallis, J.F., Freedson, P.S., Taylor, W.C., Dowda, M., Sirard, J., 2002. Age and gender differences in objectively measured physical activity in youth. Medicine and Science in Sports and Exercise 34, 350–355. US Census Bureau, 2006. 2000 Census of Population and Housing (retrieved June 27, 2006). . US Environmental Protection Agency, 2003. Travel and Environmental Implications of School Siting, US Environmental Protection Agency, Washington, DC. US Environmental Protection Agency, 2005. Light-Duty Automotive Technology and Fuel Economy Trends: 1975 Through 2005, US Environmental Protection Agency, Washington, DC, . US Environmental Protection Agency, 2006. MOBILE6 Vehicle Emission Modeling Software (retrieved June 23, 2006). . US Environmental Protection Agency, 2006. Replacing Old School Buses – What School Districts Should Consider (retrieved June 28, 2006). . US Environmental Protection Agency, 2006. The US Inventory of Greenhouse Gases and Sinks: Fast Facts (retrieved June 22, 2006). . Whitty, G., 1998. School choice policies in England and the United States: an exploration of their origins and significance. Comparative Education 34, 211–227. Witte, J.F., Thorn, C.A., 1996. Who chooses? Voucher and interdistrict choice programs in milwaukee. American Journal of Education 104, 186–217.
PR
390 391 392 393 394 395 396 397 398 399 400 401 402 403 404 405 406 407 408 409
13
UN
CO R
RE
CT
ED
410
Please cite this article in press as: Wilson, E.J. et al., The implications of school choice on travel behavior ..., Transport. Res. Part D (2007), doi:10.1016/j.trd.2007.07.007