Nov 4, 2011 - C. Buisson,1 A. Amato,2 C. Baines,2 and A. D. Hillier3. 1Institut Nanosciences et Cryogénie, SPSMS, CEA and University Joseph Fourier, ...
PHYSICAL REVIEW B 84, 184403 (2011)
Exotic transition in the three-dimensional spin-liquid candidate Tb2 Ti2 O7 A. Yaouanc,1 P. Dalmas de R´eotier,1 Y. Chapuis,1 C. Marin,1 S. Vanishri,1 D. Aoki,1 B. F˚ak,1 L.-P. Regnault,1 C. Buisson,1 A. Amato,2 C. Baines,2 and A. D. Hillier3 1
Institut Nanosciences et Cryog´enie, SPSMS, CEA and University Joseph Fourier, F-38054 Grenoble, France 2 Laboratory for Muon-Spin Spectroscopy, Paul Scherrer Institute, 5232 Villigen-PSI, Switzerland 3 ISIS Facility, Rutherford Appleton Laboratory, Chilton, Didcot, OX11 0QX, United Kingdom (Received 15 September 2011; revised manuscript received 12 October 2011; published 4 November 2011)
The insulator pyrochlore Tb2 Ti2 O7 is a three-dimensional spin liquid candidate: the strength of the magnetic interaction would normally induce order at ≈20 K, but according to published muon-spin relaxation and neutron diffraction measurements, it is still in a correlated paramagnetic state down to a temperature of 0.05 K. Our detailed experimental investigation shows that an exotic transition takes place at Tt = 0.15 (2) K. It is characterized by an anomaly in the muon precession frequency shift but not in the specific heat, which nevertheless reveals the signature of degrees of freedom at very low energy. It might be associated with a cooperative Jahn-Teller transition. The robustness of the experimental results is discussed. DOI: 10.1103/PhysRevB.84.184403
PACS number(s): 75.10.Kt, 75.30.Kz, 75.40.Cx, 75.40.Gb
The family of insulating rare-earth cubic compounds for which the magnetic rare-earth sublattice is composed of a network of corner-sharing regular tetrahedra exhibits a rich variety of magnetic ground states.1 For example, when the rare-earth magnetic ions are characterized by a very strong Ising magnetic anisotropy fixed along the local [111] axis and coupled by a net ferromagnetic interaction, the spin-ice ground state is formed.2 The spin-ice state is characterized by a huge magnetic degeneracy as revealed by the large residual entropy. Such a ground state has been found for the pyrochlores Ho2 Ti2 O7 ,3 Dy2 Ti2 O7 ,4 Ho2 Sn2 O7 ,5 and spinel CdEr2 Se4 .6 It has been predicted that the magnetic excitations of these spin-ice systems can be described as effective magnetic monopoles.7 Signatures of these emergent particles have been reported.7–13 On the other hand, when the net interaction is still ferromagnetic, but the magnetic moments are small and the crystal-field anisotropy is of the XY type, as for Yb2 Ti2 O7 , a first order transition in the spin dynamics is observed with a low-temperature ground state characterized by short-range correlations.14 Other examples of magnetic ground states for pyrochlore rare-earth compounds have been recently discussed.1 Within the whole family of these systems two compounds stand alone: Tb2 Ti2 O7 and Tb2 Sn2 O7 . The analysis of their specific heat leads to the conclusion that their crystal-field ground state is a singlet, i.e., the Tb3+ magnetic moments are exchange induced.15 This conclusion is supported by the results of inelastic neutron scattering which evidences the splitting of the ground state at low temperature.16 More recent measurements confirm it in the case of the stannate.17 This evidence has recently been disputed in Ref. 18 in the case of the titanate. We note that this study fails to find the inelastic neutron scattering line around 0.2 meV in zero field which yet was present in previous measurements.16,19 No indication about the characterization of the sample used in Ref. 18, e.g., by specific heat measurement at low temperature, is provided. Besides, the authors argue that the lifting of the degeneracy of the ground state doublet deduced from the entropy variation is due to the presence of magnetic correlations. Unfortunately, no attempt is made to check whether the observed splitting 1098-0121/2011/84(18)/184403(7)
between the lowest two energy levels is consistent with the magnitude of the exchange energy between the Tb3+ ions in the pyrochlore structure. In Tb2 Ti2 O7 the magnetic susceptibility, muon-spin relaxation (μSR), and neutron diffraction measurements do not detect any signature of a magnetic ordering down to 0.05 K, despite strong superexchange interactions,20,21 i.e., it is a spin liquid candidate system or a fluidlike magnetic system.22,23 Magnetic order with a strong dynamical character occurs below Tc � 0.88 K in the stannate.24 This picture was first proposed in Ref. 25 and was subsequently confirmed.26–29 Here we report specific heat, μSR, and quasielastic neutron scattering measurements performed on single crystals of Tb2 Ti2 O7 . As the compound is cooled down, a strongly correlated paramagnetic regime is first entered at Tcp � 2 K, followed by an exotic transition at Tt ≈ 0.15 K. Below this temperature new degrees of freedom are detected. The organization of this paper is as follows. In Sec. I we describe the growth of the single crystals and the experimental methods used in the present work. Section II presents our experimental data and their analysis. The next section (Sec. III) discusses the robustness of our results. Finally a summary of our result is given in Sec. IV. Three appendices complete the description of our work. I. EXPERIMENTAL
Crystals of Tb2 Ti2 O7 were prepared with different starting oxides and growth velocity under either argon or oxygen gas.30 The best quality crystals, i.e., the ones with the lowest residual entropy, were obtained starting from compacted polycrystalline Tb2 Ti2 O7 rods prepared using TiO2 and Tb2 O3 powders. The crystals were grown under oxygen atmosphere by the traveling solvent floating zone technique with a growth velocity of 7 mm/h, as done previously for Gd2 Ti2 O7 .31 Specific heat data were recorded above 0.4 K with a Quantum Design physical property measurement system (PPMS) using a relaxation method. At lower temperatures and in a overlapping range up to 0.8 K, the measurements were performed in a 3 He-4 He dilution refrigerator, also using a relaxation method with a homemade calorimeter. The spin dynamics was studied
184403-1
©2011 American Physical Society
A. YAOUANC et al.
PHYSICAL REVIEW B 84, 184403 (2011)
by positive muon-spin relaxation (μSR) and quasielastic neutron scattering at the MuSR and IN12 spectrometers of the ISIS facility (Rutherford Appleton Laboratory, Chilton, United Kingdom) and the Institut Laue Langevin (Grenoble, France), respectively. The μSR frequency shifts were measured at the low temperature facility (LTF) and general purpose surfacemuon (GPS) instruments of the Swiss Muon Source at the Paul Scherrer Institute (Villigen, Switzerland).
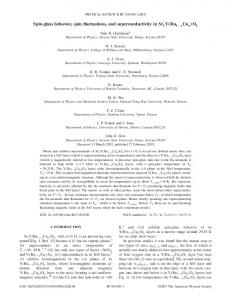
Frequency shift Δν/νext (-)
0
II. EXPERIMENTAL RESULTS
10
fc 60 mT
fc 20 mT
−0.3
Tb2Ti2O7
(a)
−0.4
−0.55
−0.5
−0.60
Tt
−0.6
−0.65
−0.7
−0.70 0.0
0.2
Specific heat Cp (J/(K mol Tb))
0.0
0.4 0.2
0.4
0.6 0.6 2.0
8
(b)
1.5 1.0
6
Tt
0.5 0.0
4 2
Celec (J/(K mol Tb))
The results for the static magnetic properties of Tb2 Ti2 O7 as probed by μSR and specific heat measurements are presented in Fig. 1. In this μSR measurement, under the action of an external field applied to the sample and perpendicular to the muon polarization, the spins of the implanted muon precess at a frequency νμ = γμ Bμ , where Bμ is the local field at the muon site and γμ = 851.6 Mrad s−1 T−1 the muon gyromagnetic ratio. The frequency shift shown in Fig. 1(a) is defined as �ν/νext , where �ν = νμ − νext and νext = γμ Bext . An anomaly is observed in this shift at a temperature of 0.15 (2) K that we define as Tt . A minimum value for the electronic specific heat is observed at approximately the same temperature [see inset of Fig. 1(b)]. Looking at the results of longitudinal μSR measurements probing spin dynamics in Tb2 Ti2 O7 shown in Fig. 2(a) and to be commented on below, no signature of Tt is found, in agreement with published results.20,32 The marked extremum of �ν/νext at Tt makes the lack of an anomaly in longitudinal μSR and specific heat measurements very paradoxical indeed. One would expect to observe μSR oscillations at a magnetic phase transition, or at least a partial loss of the signal if the oscillations are too fast or too strongly damped to be detected. There is one material which represents an exception to this rule: the aforementioned compound Tb2 Sn2 O7 .25 The local field at the muon site evolves in a time shorter than the muon-spin precession time. This means that magnetic modes fluctuating in the 10−11 –10−10 s time range are present below Tc , as confirmed by neutron scattering.29 For Tb2 Ti2 O7 , the behavior of �ν/νext below Tt seems, at a first glance, consistent with the system entering a spin-glass ground state.34 However, the presence of a marked minimum in the specific heat and the persistent spin dynamics down to temperatures as low as 0.06 K, as evidenced by the significant value of the spin-lattice relaxation rate λZ [Fig. 2(a)], contradicts the assumption that the transition is spin-glass-like at Tt . The maximum strength of the applied field for the measurements of �ν/νext is appreciable with respect to the measured molecular field. Referring to the value found in the sibling compound Tb2 Sn2 O7 , the applied field is about one fifth.15 This can explain the high sensitivity of �ν/νext to the field magnitude [Fig. 1(a)]. While no anomaly is present in the spin dynamics at Tt , a change of regime in the dynamics occurs at a temperature an order of magnitude higher. This is clearly seen from the muonspin relaxation and quasielastic neutron scattering experiments that we describe now. Weak longitudinal field muon-spin relaxation spectra on crystals of Tb2 Ti2 O7 have been recorded. Contrary to previous
zfc
−0.2
Temperature (K) 4 6 8
2
Tb2Ti2O7
0 0
2
4 6 8 Temperature (K)
10
FIG. 1. (Color online) Static magnetic properties of Tb2 Ti2 O7 . (a) Temperature dependence of the μSR frequency shift �ν/νext for two fields applied along the [110] direction. For the measurements at T � 0.9 K, two experimental procedures were used: either a zerofield cooling (zfc) or a field-cooling (fc) protocol starting from 3 K. The inset shows that a branching occurs at T < Tt ≈ 0.15 K between the zfc and fc data taken at 60 mT. A kink is observed in the zfc data at Tt . At 0.3 K and below �ν/νext is field dependent. The dashed lines are guides to the eyes. (b) The temperature dependence of the specific heat Cp . The sum of the nuclear and phonon contributions to the specific heat is shown as a dashed line. Details about their evaluation are presented in Appendix A. The inset displays the low-temperature electronic specific heat Celec obtained from the difference between the total specific heat and the nuclear and phonon contributions. An upturn is clearly observed below Tt .
results,20,32 the exponential line shape does not provide a good account of the data over the whole investigated temperature range; see Appendix B for a discussion. This is especially manifest at low temperature. An exponential-power relaxation function PZ (t) = exp[−(λZ t)β ] is found to properly fit the data. Figure 2(a) shows the temperature dependence of the muonspin-lattice relaxation rate λZ and of the exponent β. λZ (T ) exhibits little thermal dependence outside the temperature interval between 1 and 5 K. On the contrary, it exhibits a marked increase on cooling between about 5 and 1 K: this is the signature of a slowing down of the spin dynamics.35 Roughly in the same interval, the exponent β increases from a high-temperature value of ≈0.9 to ≈1.2 below 1 K. In general terms, in the case of fast dynamics one expects the spectra to be exponential, i.e., β = 1, while this exponent is β = 2 for static or quasistatic fields. We interpret the increase of β
184403-2
EXOTIC TRANSITION IN THE THREE-DIMENSIONAL . . .
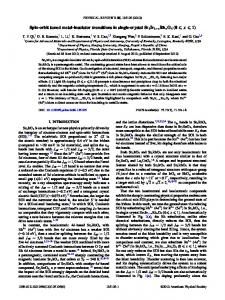
0
(a) 1.0
2.0 1.5
0.5
1.0
Tcp
12 Selec (J/(K mol Tb))
2.5
Exponent β (-)
Relaxation rate λZ (μs−1)
3.0
PHYSICAL REVIEW B 84, 184403 (2011)
0.5
Tb2Ti2O7
0.0
Quasielastic linewidth Γ (meV)
0.1
0.0
1 10 Temperature (K)
100
10
5
Temperature (K) 10 15 20
R ln(4)
Tb2Ti2O7
8 6
2.0
4
0.10
Tb2Ti2O7 (0, 0, 2.1) this work
0.06
Yasui et al 0
2
4 6 8 Temperature (K)
1.0
2
0.5 0.0 0.0
Tcp
1.5
Tt
0
0.12
0.08
25
(b) 10
FIG. 2. (Color online) Spin dynamics in Tb2 Ti2 O7 . (a) Temperature dependence of the spin-lattice relaxation rate λZ and exponent β characterizing the μSR relaxation function measured with a longitudinal field of 13 mT. In panel (b) we display the half-width at half-maximum of the quasielastic neutron scattering linewidth measured for the wave vector (0,0,2.1) in reduced units. We complement our data with published results from Yasui et al.33 The dashed lines are guides to the eyes. Both muon and neutron data suggest a crossover to a correlated paramagnetic regime for T < Tcp � 2 K. Experimental details about these measurements can be found in Appendixes B and C.
toward the value of 2 as an additional signature of the slowing down of the spin dynamics. The dynamics of the Tb3+ spins can also be probed by quasielastic neutron scattering. In Fig. 2(b) is shown the quasielastic linewidth � which is proportional to the inverse correlation time of the spins. While � is independent of the temperature above Tcp � 2 K, it decreases below this temperature. Interestingly, Tcp is in the temperature range where λZ (T ) and β(T ) signal the change of regime in the spin dynamics. Tcp can be interpreted as the crossover temperature below which Tb2 Ti2 O7 becomes a collective paramagnet, i.e., it is in a paramagnetic state characterized by strong correlations. In Fig. 3 we display the variation of the electronic entropy. It is deduced from the measured specific heat to which the nuclear and phonon contributions have been subtracted (see Appendix A). The fact that the entropy variation is larger than R ln(2) confirms that the degeneracy of the trigonal crystal-field ground state is lifted at low temperature. Relative to the previous work of Chapuis et al.,15 thanks to the extension of the specific heat measurement below 0.4 K, here we determine that
0.2
0.4
0.6
FIG. 3. (Color online) Temperature dependence of the entropy of electronic origin Selec per mole of terbium in Tb2 Ti2 O7 . The entropy variation has been computed from Celec (T ) and has been shifted to match the prediction of the model described below in the temperature range 15–20 K. The prediction shown as a dashed line is for a crystal-field scheme with energy levels lying at 0, 2, 19.5, 21.9, 123, and 171 K in units of temperature. The value of the first excited level has been determined for the entropy to be consistent to the experimental data. The splitting between the levels at 19.5 and 21.9 K was computed to be consistent with the splitting between the ground and first excited states. The last two values for the energy levels (123 and 171 K) result from the predictions for recently determined crystal-field parameters.15,16 Note that all these energy levels match very well the transitions which have been observed by inelastic neutron scattering.16 The subsequent levels are above 400 K and do not affect the entropy in the displayed temperature range. The inset shows the low-temperature part of the experimental data.
there is a weak residual entropy at 0.06 K, the lowest measured temperature (inset of Fig. 3). A plateau in the electronic entropy Selec of width ≈ 0.05 K and centered at Tt is present. The entropy decreases when cooling below 0.1 K. In connection with the thermal behavior of Selec at low temperature, we stress that a sizable electronic specific heat appears below Tt [inset of Fig. 1(b)] on top of the nuclear contribution. This specific heat below Tt is a clear signature of the presence of degrees of freedom at very low energy. This is a definite signature of the exotic nature of the ground state of Tb2 Ti2 O7 . III. ROBUSTNESS OF OUR RESULTS
The robustness of our results has been tested.30 Basically, the spin dynamics as displayed in Fig. 2(b) of the main text is sample independent: two samples of completely different origin give fully consistent results. Our longitudinal field μSR data measured on two different crystals are also consistent. On the other hand, some magnetic properties are partly sample dependent. The temperature of the kink in the frequency shift for a sample with a larger residual entropy is changed from 0.15 K down to about 0.10 K. Interestingly, a branching between zero-field and field-cooling in alternating current susceptibility data was reported in the past at ≈0.10 K by Luo et al.36 Beside the crystals mentioned so far, we have grown another one with a growth velocity of 3 mm/h. Its
184403-3
A. YAOUANC et al.
PHYSICAL REVIEW B 84, 184403 (2011)
specific heat displays peak at about 0.37 K. This result is consistent with the observation of Hamaguchi et al. for a crystal of an unspecified growth velocity.37 A polycrystalline sample with such a specific heat peak has been recently studied by inelastic neutron scattering.38 The spin dynamics as probed by this experiment seems to suggest that it changes in nature at the peak temperature. IV. SUMMARY
In summary, while Tb2 Ti2 O7 enters a correlated paramagnetic regime at Tcp � 2 K, characterized by a pronounced slowing of the magnetic fluctuations, we have observed an exotic transition at Tt = 0.15 (2) K which is not spin-glasslike. It manifests itself through an anomaly in the μSR frequency shift (magnetic measurement) and the presence of unconventional excitations detected by specific heat below Tt . The magnetic transition at Tt is of quantum nature, since Tb2 Ti2 O7 is an exchange-induced magnet with a small splitting of the first two crystal-field energy levels.15 This transition could be associated with a cooperative Jahn-Teller transition, which has been suggested to exist at ≈0.1 K. The inference arose from the interpretation of the temperature dependence of the elastic modulus.39 The observation of a broadening of Bragg reflections below ≈20 K in recent x-ray scattering experiments was interpreted as a precursor of the Jahn-Teller transition.40 However, this precursor effect seems sample dependent.41 Spin dynamics is still observed below Tt . The magnetic ground state is built up of crystal-field states of Ising character, and the system fluctuates between these two states by quantum tunneling. We have unraveled its quantum excitations below Tt , and it is now a theoretical challenge to relate them to the possible finite density of monopoles in the quantum-mechanical ground state42 and their artificial gauge fields.7,42 From the experimental viewpoint, our work shows that a full panel of experimental techniques, including specific heat at extremely low temperatures, is required to fully characterize samples of Tb2 Ti2 O7 . Many reports discussing the results from an experimental technique can be found in the literature but most of them fail to provide a complete characterization of the sample. Examples are listed in this work. ACKNOWLEDGMENTS
We thank V. Glazkov, S. S. Sosin, and C. Vˆaju for their contribution to some of the specific heat measurements. This research project has been partially supported by the European Commission under the 6th Framework Programme through the Key Action: Strengthening the European Research Area, Research Infrastructures (Contract No. RII3-CT-2003-505925) and under the 7th Framework Programme through the “Research Infrastructures” action of the “Capacities” Programme, Contract CP-CSA INFRA-2008-1.1.1 No. 226507-NMI3. We also thank the European Science Foundation through the Highly Frustrated Magnetism program for partial support. Part of this work was performed at the Swiss Muon Source, Paul Scherrer Institute, Villigen, Switzerland, and the ISIS facility, Rutherford Appleton Laboratory, Chilton, United Kingdom.
APPENDIX A: SPECIFIC HEAT DATA ANALYSIS
The measured specific heat is the sum of three contributions: (i) the electronic specific heat which is of interest here, (ii) the specific heat from the lattice vibration modes, and (iii) the specific heat associated with the population of the nuclear quantum levels. The second and third contributions are sizable only above about 4 K and below approximately 0.5 K, respectively. The lattice contribution was estimated from the specific heat measured in the nonmagnetic compound Y2 Ti2 O7 , which crystallizes in the same structure as Tb2 Ti2 O7 . The difference in the molar masses of the two systems was accounted for following common practice (see, e.g., Ref. 15). We now detail the estimate of the nuclear specific heat. It arises from the non-spinless isotopes present in our compound, namely, 159 Tb, which is the only isotope present in natural terbium, and 47 Ti and 49 Ti, which are found in natural titanium with abundances of 7.4 and 5.4%, respectively. 159 Tb is a spin I = 3/2 nucleus and its nuclear levels are lifted by the Zeeman and quadrupole interactions, written as HZee = −¯hωZee Iz and HQ = h ¯ ωQ {[3(Iz )2 − (I )2 ] + η[(Ix )2 − (Iy )2 ]}, eQVzz with h ¯ ωQ = 4I (2I −1) , respectively. In this last formula, Vzz is the principal component of the electric field gradient tensor acting on the nucleus, η its asymmetry parameter, and Q = 1.432 barn is the quadrupole moment of 159 Tb. It is here implicitly assumed that the principal axis z of the electric field gradient which is parallel to the local trigonal symmetry axis at the Tb crystalline site coincides with the orientation of the magnetic field acting on the nucleus. This should be a fair approximation if we refer to the results obtained for Tb2 Sn2 O7 .24,25 We now proceed to the estimate of Vzz using a conventional method.43–46 Since Tb2 Ti2 O7 is an insulator, Vzz is the sum of 4f only two terms, i.e., Vzz = Vzz + Vzzlatt , where the first and the second terms model the 4f -electron and lattice contributions, respectively. For the first contribution we can write Vzz4f = −
e θ2 (1 − RQ )�r −3 �4f E. 4π ε0
(A1)
All the parameters of this equation refer to the Tb3+ ion. The atomic parameters are the second-order Stevens factor θ2 = −1/99,47 the Sternheimer coefficient RQ = 0.12,48 and the expectation value of the cube of the inverse distance from the 159 Tb nucleus to the 4f shell, �r −3 �4f = 8.983 in atomic units.49 The matrix element E is the expectation value of the quadrupole operator 3Jz2 − J (J + 1) acting on the Tb3+ crystal-electric-field (CEF) state: it depends on the ion environment. It is a fair approximation to retain only the lowest two CEF electronic states, since at the temperatures of interest here the population of the other ones is negligible. We recall that the third CEF state lies at about 20 K in temperature units above the ground state. The first two states |φ1,2 � are a linear combination of the states |±�, namely, |φ1,2 � = − sin(α1,2 /2)|+� + cos(α1,2 /2)|−�, with |±� = −0.958| ± 4� ±0.129| ± 1� − 0.121| ∓2� ∓ 0.226| ∓ 5�,15 α1 = π/2, and α2 = α1 + π . We compute E = 6.1, a value which is actually independent of the mixing angles α1,2 . This 4f leads to Vzz = 4.7 × 10²¹ V m−2 .
184403-4
EXOTIC TRANSITION IN THE THREE-DIMENSIONAL . . .
PHYSICAL REVIEW B 84, 184403 (2011)
|−3/2〉 3h-ω Zee
|−1/2〉 |1/2〉 |3/2〉 Zeeman only
Zeeman + quadrupole
FIG. 4. Schematic view of the 159 Tb nuclear levels. In the presence of the Zeeman interaction only, the four levels are equidistant. When the quadrupole interaction is included, the two levels in the middle are shifted upward. For the sake of clarity the shift is enlarged in the figure. The actual normalized values for the four levels are 0, 1/3, 2/3, 1 and 0, 0.346, 0.679, 1 for the pure Zeeman case and when the quadrupole interaction is added, respectively.
For the lattice contribution to Vzz we have Vzzlatt = −
4(1 − γ∞ ) B 0. e θ2 �r 2 �4f (1 − σ2 ) 2
(A2)
The new parameters are the Sternheimer coefficient γ∞ = −60,48 the expectation value of the square distance from the 159 Tb nucleus to the 4f electrons, �r 2 �4f = 0.822 in atomic units,49 the screening coefficient of the crystal field σ2 = 0.6,50 and the crystal-field parameter B20 = −4.93 × 10⁻²³ J.16,30 Numerically we get Vzzlatt = −8.1 × 10²¹ V m−2 . Altogether we compute Vzz = −3.3 × 10²¹ V m−2 . Compared to other compounds the absolute value is quite small.43 We can now estimate h ¯ ωQ and find −3.9 × 10⁻⁵ meV. With such a small magnitude, it is legitimate to consider the quadrupolar electric interaction as a perturbation of the Zeeman interaction. In the presence of the sole Zeeman interaction, the Zeeman nuclear eigenstates | ± 3/2� and | ± 1/2� are equidistant in energy, as displayed in the left side of Fig. 4. To first order perturbation, the repartition is changed by the quadrupole interaction to the one shown in the right side. Note that the energy shift of the levels is independent of η. In the pyrochlore compounds, titanium is nonmagnetic and the contribution of the two non-spinless titanium nuclei can be readily estimated from the nuclear splittings measured with a 47 Ti nuclear quadrupole resonance experiment on Dy2 Ti2 O7 : transitions are found by this technique at 4.37 MHz and the double of this value.51 It is indeed a good approximation to consider the electric field gradient acting on the Ti nuclei in Dy2 Ti2 O7 and Tb2 Ti2 O7 to be very close to each other. Then it is easily shown that the overall contribution of the Ti nuclei to the total nuclear specific heat down to 0.06 K is absolutely negligible compared to the Tb one. The nuclear contribution to the specific heat of Tb2 Ti2 O7 shown in Fig. 1(b) of the main text has been computed with an overall splitting of the 159 Tb levels of 3¯hωZee = 0.0191 (4) meV. In principle our experimental data do not provide a definite value for 3¯hωZee , but as a matter of fact, the bounds for 3¯hωZee are quite tight. The higher bound is the value used for the plot. Indeed, if a higher value for 3¯hωZee was used, the electronic specific heat in the 0.1 − 0.2 K range, which is obtained from subtracting the nuclear estimate to the experimental
data, would be negative. The lower bound is 0.0172 (4) meV, since any smaller value for 3¯hωZee would result in a negative electronic entropy when T → 0 (see Fig. 3 of the main text). Interestingly, if the lower bound is retained for 3¯hωZee , the electronic specific heat still exhibits a minimum value around Tt , i.e., the shape of the temperature variation of Celec shown in the inset of Fig. 1(b) of the main text is conserved. Basically, in this case only a vertical shift of the data is observed with a minimum value for Celec , which is around 0.4 J/(K mol Tb) at Tt instead of about 0 in Fig. 1(b) of the main text. Since ωZee can be written in terms of the hyperfine field Bhyp as ωZee = γ159 Tb Bhyp , where γ159 Tb = 64.31 Mrad s−1 T−1 is the nucleus gyromagnetic ratio, we find Bhyp = 142 (8) T from 3¯hωZee = 0.018 (1) meV, a mean value of the two bounds. It would be interesting to compare this value with the one deduced from the ground state magnetic moment using the published hyperfine constant of 40 (4) T/μB .52 The main physical purpose would be to determine whether the hyperfine field is reduced because of the dynamical nature of the electronic ground state.53 However, this would require a value for the moment which is still unknown. APPENDIX B: EXPERIMENTAL DETAILS FOR MUON-SPIN RELAXATION EXPERIMENTS
The spin dynamics as probed by the longitudinal μSR technique consists of measuring the spatial asymmetry exp a0 PZ (t) in the muon decay positron distribution.35 The exp function PZ (t) which models the evolution of the muon polarization is well described by the sum of two compoexp nents: a0 PZ (t) = as exp[−(λZ t)β ] + abg . The exponentialpower relaxation function provides an effective model for the relaxation arising from the muons implanted into the sample. It is characterized by the spin-lattice relaxation rate λZ and the exponent β (β > 0). The constant term abg accounts for the muons which have missed the sample. A longitudinal magnetic field of 13 mT was applied on the sample. This magnetic field strength was chosen, after a series of tests, to be sufficiently strong to quench the relaxation from the nuclear magnetic moments, i.e., the 159 Tb nuclear magnetic moments, but small enough such that the relaxation from the Tb3+ magnetic moment is not disturbed too much.54,55 Relative to Tb2 Sn2 O7 for which a pronounced λZ maximum was observed at low field,25 only a slight maximum is observed (with a maximum increase of 0.2 μs−1 ) and only for T � 0.4 K. The values of the μSR parameters β and λZ were found identical within error bars for the three investigated orientations of the field relative to the crystal axes. They were [111], [110], and [100]. Previously measured longitudinal μSR spectra were analyzed with an exponential relaxation function down to the lowest measured temperature, in contrast to our results.20,32 In Fig. 5 we show that the relaxation deviates substantially at low temperature from the previously assumed exponential behavior. We believe that the deviations from the exponential form were missed in the past because of either insufficient statistics in the spectra, or the deviation from the exponential shape was simply not looked for. An exponent with a value above 1 indicates that the measured spin dynamics is not in the motional narrowing limit, i.e., a slowing down of the dynamics is observed.35
184403-5
A. YAOUANC et al.
PHYSICAL REVIEW B 84, 184403 (2011)
Tb2Ti2O7
Sμ
Neutron counts (arb. unit)
Asymmetry: a0 PZexp(t)
0.20
[111]
0.7 K, 13 mT
0.15 0.10 β=1
0.05 0.00
×3 β = 1.27 (3) 0.0
0.5
1.0 1.5 2.0 Time t (μs)
2.5
3.0
Tb2Ti2O7 (0, 0, 2.1) 1.6 K
6000 4000 2000 0 −1.0
FIG. 5. (Color online) Muon-spin relaxation spectrum measured at 0.7 K on a crystal of Tb2 Ti2 O7 in a longitudinal field of 13 mT. This field is collinear to the incoming muon polarization and to the [111] crystallographic direction. The full line results from a fit of the spectrum according to the function given in the main text. The lower part of the figure displays the difference between the data and the best fits for two different values of the exponent β. For the sake of clarity a difference is magnified by a factor of 3.
APPENDIX C: EXPERIMENTAL DETAILS FOR QUASIELASTIC NEUTRON EXPERIMENTS
Measurements were performed on the cold neutron triple axis spectrometer IN12 installed at the high-flux reactor of the ILL. IN12 was operated with a vertically focusing PG(002) monochromator, a horizontally focusing PG(002) analyzer, and a liquid-nitrogen-cooled Be filter in the scattered beam to remove higher-order neutrons. The final energy was fixed to 3.78 meV and the energy resolution at elastic energy transfer was 0.12 meV (full width at half maximum). Scans were performed in energy with a typical counting time of 90 seconds per point. The sample was mounted such that the [hh�] plane was accessible to the measurements. Our quasielastic neutron scattering data were analyzed taking into account different contributions: (i) the elastic incoherent scattering described by a Gaussian function which
1
8000
J. S. Gardner, M. J. P. Gingras, and J. E. Greedan, Rev. Mod. Phys. 82, 53 (2010). 2 S. T. Bramwell and M. J. P. Gingras, Science 294, 1495 (2001). 3 M. J. Harris, S. T. Bramwell, D. F. McMorrow, T. Zeiske, and K. W. Godfrey, Phys. Rev. Lett. 79, 2554 (1997). 4 A. P. Ramirez, A. Hayashi, R. J. Cava, R. Siddharthan, and B. S. Shastry, Nature (London) 399, 333 (1999). 5 H. Kadowaki, Y. Ishii, K. Matsuhira, and Y. Hinatsu, Phys. Rev. B 65, 144421 (2002). 6 ˇ J. Lago, I. Zivkovi´ c, B. Z. Malkin, J. Rodriguez Fernandez, P. Ghigna, P. Dalmas de R´eotier, A. Yaouanc, and T. Rojo, Phys. Rev. Lett. 104, 247203 (2010). 7 C. Castelnovo, R. Moessner, and S. L. Sondhi, Nature (London) 451, 42 (2008).
−0.5 0.0 Energy transfer (meV)
0.5
FIG. 6. (Color online) An example of a quasielastic neutron scattering spectrum recorded at 1.6 K for crystals of Tb2 Ti2 O7 . The value of the wave vector is given in reduced units. The full line results from the fit. We explicitly display the different components to the spectrum: the crystal-field contribution with the dotted line, the incoherent and background scattering with the dashed line, and the quasielastic scattering with the dashed-dotted line.
is also the resolution function, (ii) a background independent of the temperature and energy transfer, (iii) the inelastic scattering arising from the first crystal-field excited state at a thermal energy of ∼2 K, which is described by the sum of two symmetric Lorentzian functions centered at approximately ±0.2 meV, and finally (iv) the quasielastic scattering component of electronic origin which is modeled by a Lorentzian function of half-width at half-maximum equal to �. In Fig. 6 we display a quasielastic neutron scattering spectrum recorded at 1.6 K at the scattering vector (0, 0, 2.1) given in reduced units. The different components of the spectrum are explicitly shown. In addition to our own spectra, we have reanalyzed spectra presented in Ref. 33, since the effect of the crystal-field level at the thermal energy of ∼2 K was not taken into account in the published analysis. Our analysis provides a notably improved account of the experimental data compared to the original fit. The values obtained for � are compatible with the values of Ref. 33: the additional scattering from the crystal-field levels does influence � only within error bars.
8
T. Fennell, S. T. Bramwell, D. F. McMorrow, P. Manuel, and A. R. Wildes, Nature Phys. 3, 566 (2007). 9 H. Kadowaki, N. Doi, Y. Aoki, Y. Tabata, T. J. Sato, J. W. Lynn, K. Matsuhira, and Z. Hiroi, J. Phys. Soc. Jpn. 78, 103706 (2009). 10 L. D. C. Jaubert and P. C. W. Holdsworth, Nature Phys. 5, 258 (2009). 11 T. Fennell, P. P. Deen, A. R. Wildes, K. Schmalzl, D. Prabhakaran, A. T. Boothroyd, R. J. Aldus, D. F. McMorrow, and S. T. Bramwell, Science 326, 415 (2009). 12 D. J. P. Morris, D. A. Tennant, S. A. Grigera, B. Klemke, C. Castelnovo, R. Moessner, C. Czternasty, M. Meissner, K. C. Rule, J.-U. Hoffmann, K. Kiefer, S. Gerischer, D. Slobinsky, and R. S. Perry, Science 326, 411 (2009).
184403-6
EXOTIC TRANSITION IN THE THREE-DIMENSIONAL . . . 13
PHYSICAL REVIEW B 84, 184403 (2011)
S. T. Bramwell, S. R. Giblin, S. Calder, R. Aldus, D. Prabhakaran, and T. Fennell, Nature (London) 461, 956 (2009). 14 J. A. Hodges, P. Bonville, A. Forget, A. Yaouanc, P. Dalmas de R´eotier, G. Andr´e, M. Rams, K. Kr´olas, C. Ritter, P. C. M. Gubbens, C. T. Kaiser, P. J. C. King, and C. Baines, Phys. Rev. Lett. 88, 077204 (2002). 15 Y. Chapuis, A. Yaouanc, P. Dalmas de R´eotier, C. Marin, S. Vanishri, S. H. Curnoe, C. Vˆaju, and A. Forget, Phys. Rev. B 82, 100402(R) (2010). 16 I. Mirebeau, P. Bonville, and M. Hennion, Phys. Rev. B 76, 184436 (2007). 17 S. Petit, P. Bonville, I. Mirebeau, H. Mutka, and J. Robert, e-print arXiv:1109.1960. 18 B. D. Gaulin, J. S. Gardner, P. A. McClarty, and M. J. P. Gingras, Phys. Rev. B 84, 140402(R) (2011). 19 K. C. Rule, J. P. C. Ruff, B. D. Gaulin, S. R. Dunsiger, J. S. Gardner, J. P. Clancy, M. J. Lewis, H. A. Dabkowska, I. Mirebeau, P. Manuel, Y. Qiu, and J. R. D. Copley, Phys. Rev. Lett. 96, 177201 (2006). 20 J. S. Gardner, S. R. Dunsiger, B. D. Gaulin, M. J. P. Gingras, J. E. Greedan, R. F. Kiefl, M. D. Lumsden, W. A. MacFarlane, N. P. Raju, J. E. Sonier, I. Swainson, and Z. Tun, Phys. Rev. Lett. 82, 1012 (1999). 21 J. S. Gardner, A. Keren, G. Ehlers, C. Stock, E. Segal, J. M. Roper, B. F˚ak, M. B. Stone, P. R. Hammar, D. H. Reich, and B. D. Gaulin, Phys. Rev. B 68, 180401(R) (2003). 22 P. A. Lee, Science 321, 1306 (2008). 23 L. Balents, Nature (London) 464, 199 (2010). 24 I. Mirebeau, A. Apetrei, J. Rodr´ıguez-Carvajal, P. Bonville, A. Forget, D. Colson, V. Glazkov, J. P. Sanchez, O. Isnard, and E. Suard, Phys. Rev. Lett. 94, 246402 (2005). 25 P. Dalmas de R´eotier, A. Yaouanc, L. Keller, A. Cervellino, B. Roessli, C. Baines, A. Forget, C. Vaju, P. C. M. Gubbens, A. Amato, and P. J. C. King, Phys. Rev. Lett. 96, 127202 (2006). 26 Y. Chapuis, A. Yaouanc, P. Dalmas de R´eotier, S. Pouget, P. Fouquet, A. Cervellino, and A. Forget, J. Phys. Condens. Matter 19, 446206 (2007). 27 K. C. Rule, G. Ehlers, J. R. Stewart, A. L. Cornelius, P. P. Deen, Y. Qiu, C. R. Wiebe, J. A. Janik, H. D. Zhou, D. Antonio, B. W. Woytko, J. P. Ruff, H. A. Dabkowska, B. D. Gaulin, and J. S. Gardner, Phys. Rev. B 76, 212405 (2007). 28 I. Mirebeau, H. Mutka, P. Bonville, A. Apetrei, and A. Forget, Phys. Rev. B 78, 174416 (2008). 29 K. C. Rule, G. Ehlers, J. S. Gardner, Y. Qiu, E. Moskvin, K. Kiefer, and S. Gerischer, J. Phys. Condens. Matter 21, 486005 (2009). 30 Y. Chapuis, Ph.D. thesis, Universit´e Joseph Fourier, Grenoble, 2009. 31 A. Yaouanc, P. Dalmas de R´eotier, V. Glazkov, C. Marin, P. Bonville, J. A. Hodges, P. C. M. Gubbens, S. Sakarya, and C. Baines, Phys. Rev. Lett. 95, 047203 (2005). 32 A. Keren, J. S. Gardner, G. Ehlers, A. Fukaya, E. Segal, and Y. J. Uemura, Phys. Rev. Lett. 92, 107204 (2004).
33
Y. Yasui, M. Kanada, M. Ito, H. Harashina, M. Sato, H. Okumura, K. Kakurai, and H. Kadowaki, J. Phys. Soc. Jpn. 71, 599 (2002). 34 K. Binder and A. P. Young, Rev. Mod. Phys. 58, 801 (1986). 35 A. Yaouanc and P. Dalmas de R´eotier, Muon Spin Rotation, Relaxation, and Resonance: Applications to Condensed Matter (Oxford University Press, Oxford, 2011). 36 G. Luo, S. T. Hess, and L. R. Corruccini, Phys. Lett. A 291, 306 (2001). 37 N. Hamaguchi, T. Matsushita, N. Wada, Y. Yasui, and M. Sato, Phys. Rev. B 69, 132413 (2004). 38 H. Takatsu, H. Kadowaki, T. J. Sato, Y. Tabata, and J. W. Lynn, e-print arXiv:1106.3649. 39 L. G. Mamsurova, K. S. Pigal’skii, and K. K. Pukhov, JETP Lett. 43, 755 (1986). 40 J. P. C. Ruff, B. D. Gaulin, J. P. Castellan, K. C. Rule, J. P. Clancy, J. Rodriguez, and H. A. Dabkowska, Phys. Rev. Lett. 99, 237202 (2007). 41 K. Goto, H. Takatsu, T. Taniguchi, and H. Kadowaki, e-print arXiv:1109.1980. 42 M. Hermele, M. P. A. Fisher, and L. Balents, Phys. Rev. B 69, 064404 (2004). 43 M. Bog´e, J. Chappert, A. Yaouanc, and J. M. D. Coey, Solid State Commun. 31, 987 (1979). 44 G. A. Stewart and J. Zukrowski, in Crystalline Electric Effetcs in f-Electron Magnetism, edited by R. P. Guertin, W. Suski, and Z. Zolnierek (Plenum Press, New York, 1981). 45 G. K. Shenoy, G. W. Crabtree, D. Niarchos, F. Behroozi, B. D. Dunlap, D. Hinks, and D. R. Noakes, in Crystalline Electric Effetcs in f-Electron Magnetism, edited by R. P. Guertin, W. Suski, and Z. Zolnierek (Plenum Press, New York, 1981). 46 R. A. B. Devine and Y. Berthier, in Crystalline Electric Effetcs in f-Electron Magnetism, edited by R. P. Guertin, W. Suski, and Z. Zolnierek (Plenum Press, New York, 1981). 47 M. T. Hutchings, in Solid State Physics, Vol. 16, edited by F. Seitz and D. Turnbull (Academic Press, New York, 1964), p. 227. 48 R. P. Gupta and S. K. Sen, Phys. Rev. A 7, 850 (1973). 49 A. J. Freeman and J. P. Desclaux, J. Mag. Mag. Mater. 12, 11 (1979). 50 R. P. Gupta, B. K. Rao, and S. K. Sen, Phys. Rev. A 3, 545 (1971). 51 K. Kitagawa, R. Higashinaka, K. Ishida, Y. Maeno, and M. Takigawa, Phys. Rev. B 77, 214403 (2008). 52 A. Abragam and B. Bleaney, Electron Paramagnetic Resonance of Transition Ions (Clarendon, Oxford, 1970). 53 E. Bertin, P. Bonville, J.-P. Bouchaud, J. A. Hodges, J. P. Sanchez, and P. Vulliet, Eur. Phys. J. B 27, 347 (2002). 54 P. Dalmas de R´eotier and A. Yaouanc, J. Phys. Condens. Matter 9, 9113 (1997). 55 P. Dalmas de R´eotier, P. C. M. Gubbens, and A. Yaouanc, J. Phys. Condens. Matter 16, S4687 (2004).
184403-7