central to the NASA/GSFC Software Engineering Laboratory, the Data and. Analysis Center for ... development of effective software programs, where âeffectiveâ depends upon specific ..... and collect the usual accounting data from the project.
EXPERIMENTAL MODELS FOR VALIDATING COMPUTER TECHNOLOGY* Marvin V. Zelkowitz NIST/ITL Gaithersburg, MD 20899 and Dept. of Computer Science University of Maryland College Park, MD 20742
Dolores Wallace NIST/ITL Gaithersburg, MD 20899
Abstract Experimentation is important within science for determining the effectiveness of proposed theories and methods. However, computer science has not developed a concise taxonomy of methods applicable for demonstrating the validity of a new technique. In this paper we discuss the methods generally employed to validate an experiment and propose a taxonomy consisting of 12 techniques that can be used to show that a new technology achieves its hypothesized goals. An evaluation of over 600 papers published from 1985 through 1995 shows that the 12 methods can be effectively applied to research papers, and we provide some observations of how well the research community validates its claims in these papers. Keywords: Classification; Experimentation; Measurement; Qualitative studies; Quantitative studies; Taxonomy; Validation
1. Experimentation Experimentation and data collection are needed to evaluate practices within the software engineering community as a means to understand both software and the methods used in its construction. Data collection is central to the NASA/GSFC Software Engineering Laboratory, the Data and Analysis Center for Software (DACS) located at Rome Laboratories and the Software Engineering Institute's (SEI) Capability Maturity Model (CMM). However, there are many ways to collect information within the software engineering community. The purpose of this paper is to explore these methods and to understand when each is applicable toward our understanding of the underlying software development process. In this section we explore experimentation and why it is necessary. In Section 2 we present our classification model of the various forms of experiments that can be applied to software development, what data we can collect by this experimentation, and the strengths and weaknesses of the various methods. In Section 3 we apply this model to a collection of some 600 published papers in order to understand how *
Contribution of the National Institute of Standards and Technology. Not subject to copyright. To appear in IEEE Computer.
1
experimentation is being used by the software engineering community. We then compare our results with a related study performed by Tichy [8], who also looked at the role of experimental validation in published papers.
1.1 Goals for Experimentation Software engineering is concerned with techniques useful for the development of effective software programs, where “effective” depends upon specific problem domains. Effective software can mean software that either is low cost, reliable, rapidly developed, safe, or has some other relevant attribute. We make the assumption that to answer the question “Is this technique effective?” we need some measurement of the relevant attribute. Saying only that a technique is “good” conveys no real information. Instead, we need a measurement applied to each attribute so that we can say one technique is more or less effective than another. For some attributes, this mapping from an effective attribute to a measurement scale is fairly straightforward. If effective means low cost, then cost of development is such a measure. For other attributes (e.g., reliability, safety, and security), measures may not be. Measures like number of failures in using the product per day, errors found during development, or MTBF (Mean Time Between Failure) indicate reliability between two products in hardware domains. For software a count of the number of errors found during testing does not, by itself, indicate if there are further errors remaining to be found. While safety is related to reliability, it is not the same. A very unreliable program can be very safe if it can turn itself off each time the software fails. Does security mean the time it takes to penetrate the software to bypass its security protection, how many data protection “items” it contains, or what level of information the program is allowed to process? Experimentation is a crucial part of the evaluation of these attributes. Experimentation determines whether methods used in accordance with some underlying theory during the development of a product results in software being as effective as necessary. Should we modify the underlying theory upon which the technique is based? What predictions can we make upon future developments based upon using these techniques?
1.2 Experimentation -- Not! Experimentation is one of those terms frequently used incorrectly in the computer science community. Papers are written that explain some new technology and then “experiments” are performed to show the technology is effective. In almost all of these cases, this means that the creator of the technology has implemented the technology and shown that it seems to work. Here, “experiment” really means an example that the technology exists or an existence proof that the technique can be employed. Very rarely does it involve any collection of data to show that the technology adheres to some underlying model or theory of
2
software development, or that it is effective, as “effective” was defined previously, to show that application of that technology leads to a measurable improvement in some relevant attribute. A typical example could be the design of a new programming language where the ”experiment” would be the development of a compiler for the new language and sample programs compiled on this compiler. The designer may claim this language is better than others. However, the “success” for the experiment may be the demonstration that the compiler successfully compiles the sample programs, instead of providing data that shows the value or effectiveness of this new language. A confirming experiment would have demonstrated attributes proving utility of the language. Without a confirming experiment, why should industry select a new method or tool? On what basis should another researcher enhance the language (or extend a method) and develop supporting tools? As a scientific discipline we need to do more than simply say, “I tried it, and I like it.”
1.3 So, How Do We Experiment? When one thinks of an “experiment,” one often thinks of a roomful of subjects, each being asked to perform some task, followed by the collection of data from each subject for later analysis. However, there are four approaches toward experimentation [1]: 1. Scientific method. A theory to explain a phenomenon is developed. A given hypothesis is proposed and then alternative variations of the hypothesis are tested and data collected to verify or refute the claims of the hypothesis. 2. Engineering method. A solution to a hypothesis is developed and tested. Based upon the results of the test, the solution is improved, until no further improvement is required. 3. Empirical method. A statistical method is proposed as a means to validate a given hypothesis. Unlike the scientific method, there may not be a formal model or theory describing the hypothesis. Data is collected to verify the hypothesis. 4. Analytical method. A formal theory is developed, and results derived from that theory can be compared with empirical observations. The common thread of these methods is the collection of data on either the development process or the product itself. When we do an experiment, more properly an experiment using the scientific method described above, we are interested in the effect that a method or tool, called a factor, has on an attribute of interest. The running of an experiment with a specific assignment to the factors is called a treatment. Each agent that we are studying and collecting data on (e.g., programmer, team, source program module) is called a subject or an experimental unit. The goal of an experiment is to collect enough
3
data from a sufficient number of subjects, all adhering to the same treatment, in order to obtain a statistically significant result on the attribute of concern compared to some other treatment. In developing an experiment to collect data on this attribute, we have to be concerned with several aspects of data collection [7]: 1. Replication -- We have to be able to replicate the results of an experiment to permit other researchers to reproduce the findings. To ensure that this is so, we must not confound two effects. That is, we must make sure that unanticipated variables are not affecting our results. If we cannot get a homogeneous sample of subjects for all treatments, paradoxically, we counteract this confounding effect by randomizing the factors that we are not concerned about. 2. Local control -- Local control refers to the degree to which we can modify the treatment applied to each subject (e.g., we usually have little control over the treatment in a case study.) Local control is a major problem in computer science research since many of the treatments incur significant costs or expenditures of time. In a blocking experiment, we assume each subject of a treatment group comes from a homogeneous population. Thus if we randomly select subjects from a population of students, we say that we have a blocked experiment of students. In a factorial design we apply every possible treatment for each factor. Thus if there are three factors to evaluate, and each has 3 possible values, then we need to run 9 experiments, with subjects randomly chosen from among the blocked factors. With software development, there are two additional aspects to consider: 1. Influence. In developing experiments involving large, complex, and expensive methods, such as software development, we need to know the impact that a given experimental design has on the results of that experiment. We will call this influence and classify the various methods as passive (viewing the artifacts of study as inorganic objects that can be studied with no effects on the object itself) or active (interacting with the artifacts under study often affecting the behavior of the objects as in the case of the well-known “Hawthorne” effect). 2. Temporal properties. Data collection may be historical (e.g., archaeological) or current (e.g., monitoring a current project). Historical data will certainly be passive, but may be missing just the information we need to come to a conclusion.
2. Validation Models Table 1. Summary of Validation Models.
4
Validation method Project monitoring Case study
Description Collection of development data Monitor project in depth
Assertion
Ad hoc validation
Field study
Monitor multiple projects
Literature search
Examine previously published studies Examine data from completed projects Examine qualitative data from completed projects Examine structure of developed product Develop multiple versions of product Replicate one factor in laboratory setting Execute developed product for performance Execute product with artificial data
Legacy Lessons learned Static analysis Replicated Synthetic Dynamic analysis Simulation
Weakness No specific goals Poor controls for later replication Insufficient validation Treatments differ across projects Selection bias; Treatments differ Cannot constrain factors; Data limited No quantitative data; Cannot constrain factors Not related to development method Very expensive; “Hawthorne” effect Scaling up; Interactions among multiple factors Not related to development method Data may not represent reality; Not related to development method
Strength Provides baseline for future; Inexpensive Can constrain one factor at low cost Basis for future experiments Inexpensive form of replication Large available database; Inexpensive Combine multiple studies; Inexpensive Determine trends; Inexpensive Can be automated; Applies to tools Can control factors for all treatments Can control individual factors; Costs moderate Can be automated; Applies to tools Can be automated; Applies to tools; Evaluate in safe environment
By looking at multiple examples of technology validation, we have developed a taxonomy for software engineering experimentation that describes 12 different experimental approaches. We are not claiming that this list of 12 is the ultimate list, but we have not seen any such list before that effectively categorizes multiple instances of experimental designs that are appropriate for our community. We believe that this list is a good start for such an understanding of software engineering experimentation. Table 1 summarizes these 12 models, and the following sections describe them in greater detail. The various data collection methods can be grouped into three broad categories: 1. An observational method will collect relevant data as a project develops. There is relatively little control over the development process other than using the new technology that is being studied. 2. An historical method collects data from projects that have already been completed. The data already exists; it is only necessary to analyze what has already been collected. 3. A controlled method provides for multiple instances of an observation in order to provide for statistical validity of the results. This is the more classical method of experimental design in other scientific disciplines.
5
2.1 Observational Methods An observational method will collect relevant data as a project develops. There are four such methods: Project monitoring, Case study, Assertion, and Field study.
Project Monitoring Project monitoring represents the lowest level of experimentation and measurement. It is the collection and storage of data that occurs during project development. It is a passive model since the available data will be whatever the project generates with no attempt to influence or redirect the development process or methods that are being used. The assumption is made that the data will be used for some immediate analysis. If an experimental design is constructed after the project is finished, then we would call this an historical lessons learned study. A problem is the centralization of the collection process and the capability to retrieve this information later. This solution requires some minimal coordination among the various development activities in an organization. A 1982 survey [9] found that although project information was often collected, this information was “owned” by the project manager and might not be available for future projects. The situation is often true today in many organizations. This method lacks any experimental goals or consistency in the data that is collected. It is important, however, to collect this information so that a baseline can be established later (e.g., Basili's Quality Improvement Paradigm (QIP) [2]).
Case Study In a case study, a project is monitored and data collected over time. The project is often a large development and would be undertaken whether data was to be collected or not. With a relatively minimal addition to the costs to the project, valuable information can be obtained on the various attributes characterizing its development. This differs from the project monitoring method above in that data collection is derived from a specific goal for the project. A certain attribute is monitored (e.g., reliability, cost) and data is collected to measure that attribute. Similar data is often collected from a class of projects to build a baseline to represent the organization's standard process for software development. While project monitoring is considered passive, a case study is an active method because of the influence we may have on the development process itself. The very nature of filling out a certain form (e.g., hours worked, errors found), which, by itself, may not be intrusive to the development group, may have the side effect of having the staff
6
think about, and react to, certain issues in order to fill out the form. The strength of this method is that the development is going to happen regardless of the needs to collect experimental data, so the only additional cost is the cost of monitoring the development and collecting this data. There are many developments currently happening, so if the organization is attuned to the needs for experimentation and data collection, data from many projects can be amassed over a short period of time. The weakness of this method is that each development is relatively unique, so it is not always possible to compare one development profile with another. Determining trends and statistical validity becomes difficult. There have been some efforts at collecting different profiles and looking at techniques such as cluster analysis [5] or optimized set reduction statistical techniques to combine diverse projects. Because case studies are often large commercial developments, the needs of today's customer often dominate over the desire to learn how to improve the process later. The practicality of completing a project on time, within budget, with appropriate reliability, may mean that experimental goals must be sacrificed. Experimentation may be a risk, which management is not willing to undertake.
Assertion There are many examples where the developer of the technology is both the experimenter and the subject of the study. Sometimes this may be a preliminary test before a more formal validation of the effectiveness of the technology. But all too often, the experiment is a weak example favoring the proposed technology over alternatives. As skeptical scientists, we would have to view these as potentially biased since the goal is not to understand the difference between two treatments, but to show that one particular treatment (the newly developed technology) is superior. We will refer to such experiments as assertions. However, if the developer is using a new technology on some larger industrial project, we will classify it as a case study since the developer of the technology does not have the same degree of control over experimental conditions that need to be imposed.
Field study It is often desirable to compare several projects simultaneously. This is related to the case study, but is less intrusive to the development process. If the field study becomes very intrusive with a significant involvement of the development staff in the collection of the necessary data, then this method is a form of the replicated experiment to be described later. Since a primary goal is often not to perturb the activity under study, it is often impossible to collect all relevant data.
7
Typically, survey data are collected from each activity in order to determine the effectiveness of that activity. Often an outside group will monitor the actions of each subject group, whereas in the case study model, the subjects themselves perform the data collection activities. This model best represents an organization that wishes to measure its development practices without changing the process to incorporate measurement. An outside group will come and monitor the subject groups to collect the relevant information. The method also works best for products that are already complete. If a new tool has been established in one organization, field study teams can monitor groups that use the new tool and ones that do not in order to determine differences in the effectiveness of what they produce.
2.2 Historical Methods An historical method collects data from projects that have already been completed using existing data. There are four such methods: Literature search, Legacy data, Lessons learned, and Static analysis.
Literature Search The literature search represents the least invasive and most passive form of data collection. It requires the investigator to analyze the results of papers and other documents that are publicly available. This can be useful to confirm an existing hypothesis or to enhance the data collected on one project with data that has been previously published on similar projects (e.g., meta-analysis [6]). This inexpensive method places no demands on a given project and provides information across a broad range of domains. However, a major weakness with a literature search is selection bias or the tendency of researchers, authors, and journal editors to publish positive results. Contradictory results often are not reported, so a meta-analysis of previously published data may indicate an effect that is not really present if the full set of observable data was presented. Quantitative data is often lacking due to the proprietary nature of much of this information. Understanding the environment of the published experiment is crucial for interpreting the results, and such an understanding is often lacking.
Study of Legacy Data We often want to understand a previously completed project in order to apply that information on a new project under development. In this method we consider the available data to include all artifacts involved in the product. These artifacts can include the source program, specification, design, and testing documentation, as well as data
8
collected in its development. We assume there is a fair amount of quantitative data available for analysis. When we do not have such quantitative data, we call the analysis a lessons learned study (described later). We will also consider the special case of looking at source code and specification documents alone under the separate category of static analysis. Study of legacy data can be called a form of software archaeology as we examine existing files trying to determine trends. Data mining is another term often used for parts of this work as we try to determine relationships buried in the collected data. Here we are not encumbered by an ongoing project, so costs, schedules, and the needs for delivery of a product are not involved in this activity. All interactions with the project artifacts are passive and are not bound by the real-time pressures of delivering a finished product according to some contractual schedule. Much like a case study, each experiment will be unique and it will be difficult to compare one project with another due to great variability in the availability of the collected information.
Study of Lessons-learned Lessons-learned documents are often produced after a large industrial project is completed. A study of these documents often reveals qualitative aspects which can be used to improve future developments. If project personnel are still available, it is possible to interview them to understand the effects of methods used. Such data is severely limited. This form of project may indicate various trends, but cannot be used for statistical validity of the results. Unfortunately, lessons-learned documents are often “write only,” and the same comments about what should have been done is repeated in each successive document. We never seem to learn from our previous mistakes.
Static Analysis We can often obtain needed information by looking at the completed product, which we call the static analysis method. This is a special case of studying legacy data except that we centralize our concerns on the product that was developed, whereas legacy data also included development process measurement. In these cases, we analyze the structure of the product to determine characteristics about it. Software complexity and data flow research fit under this model. For example, since we do not fully understand what the effective measurements are, the assumption is made that products with a lower complexity or simple data flow will be more effective. We examine the product to learn if its complexity value is lower because of the development method used. This method is generally a favorite in the academic world, but it is difficult to show that a model's quantitative definition relates directly to the attribute of interest. Program size, for example, is often used as a measure of program complexity, yet numerous studies
9
have shown that lines of code is only marginally related to such complexity.
2.3 Controlled Methods A controlled method provides for multiple instances of an observation in order to provide for statistical validity of the results. This is the more classical method of experimental design in other scientific disciplines. We consider four such methods: Replicated, Synthetic environment, Dynamic analysis, and Simulation.
Replicated Experiment In a replicated experiment several projects (i.e., the subjects) are staffed to perform a task in multiple ways (i.e., the treatments). Control variables are set (e.g., duration, staff level, methods used) and statistical validity can be more easily established than the case study previously mentioned. In a replicated experiment, a given task is replaced by another task (e.g., replace Ada by C++, eliminate walkthroughs, add independent verification and validation). Several treatments are formed that implement products using either the old or new task. Data is collected on both approaches, and the results are compared. This represents the “classical” scientific experiment. If there are enough replications, statistical validity of the method under study may be established. The cost of this form of experiment limits its usefulness. Industrial programmers are expensive and even a small experiment may represent 6 months to a year of staff time. Since we need about 20 to 40 replications to ensure good statistical validity of our results, the total costs for such an experiment can be enormous. Replications are often limited to at most 2 to 4, which greatly increases the risk that the results cannot be duplicated elsewhere. The effects of performing a replicated experiment among human subjects (i.e., the development team) perturb the experiment. Since the various groups know that they are part of a replicated experiment, they may not take their task as seriously as if they were developing a product that would be delivered to a customer. This could have an adverse impact on their care and diligence in performing their tasks, which of course would have an impact on the observed results. We could avoid this by having each replication represent a slightly different product, each one required by a different customer. This then becomes a variation of the case study method described earlier.
Synthetic Environment Experiments
10
In software development, projects are usually large and the staffing of multiple projects (e.g., the replicated experiment) in a realistic setting is usually prohibitively expensive. For this reason, most software engineering replications are performed in a smaller artificial setting, which only approximates the environment of the larger projects. We call these synthetic environment experiments. Such experiments often appear as a human factors study investigating some aspect in system design or use. Typically, a large group of individuals (e.g., students or industrial programmers) work at some task for several hours, leading to data being collected on this task. A relatively small objective is identified and all variables are fixed except for the control method being modified. Personnel are often randomized from a homogeneous pool of subjects, duration of the experiment is fixed, and as many variables as possible are monitored. A task involving a large group of 20 or 30 people cannot be effectively tested in an experimental setting involving only 2 or 3programmers. The scaling-up problem of transferring a result covering a few subjects may not apply to large groups of individuals. Often such experiments are conducted because they are easy to conduct and lead to statistical validity. We often lose sight of the fact that the experiment itself has little value since it doesn't relate to problems actually encountered in an industrial setting.
Dynamic Analysis The controlled methods we have so far discussed generally evaluate the development process. We can also look at controlled methods that execute the product itself. We call these dynamic analysis methods. Many instrument the given product by adding debugging or testing code in such a way that features of the product can be demonstrated and evaluated when the product is executed. For example, a tool which counts the source program (e.g., number analysis of the program, whereas test its execution time would be
the instances of certain features in of if statements) would be a static a tool which executed the program to a dynamic analysis method.
The major advantage of this method is that scripts can be used to compare different products with similar functionality. The dynamic behavior of product can be determined often without a need to understand the design of the product itself. Benchmarking suites are examples of dynamic analysis techniques. These are used to collect representative execution behavior across a broad set of similar products. There are two major weaknesses with dynamic analysis. One is the obvious problem that if we instrument the product by adding source statements, we may be perturbing its behavior in unpredictable ways. Also, executing a program shows its behavior for that specific data set, which cannot often be generalized to other data sets. The tailoring of performance benchmarks to favor one vendor's product over another is a classic example of the problems with this method of data collection.
11
Simulation Related to dynamic analysis is the concept of simulation. We can evaluate a technology by executing the product using a model of the real environment. In this case we hypothesize, or predict, how the real environment will react to the new technology. If we can model the behavior of the environment for certain variables, we often can ignore other harder-to-obtain variables and obtain results more readily using a simulated environment rather than real data. By ignoring extraneous variables, a simulation is often easier, faster, and less expensive to run than the full product in the real environment. We can often test a technology without the risk of failure on an important project, and we will not be adversely affected by the needs of project personnel to complete a project. The real weakness in a simulation is a lack of knowledge of how well the synthetic environment we have created models reality. Although we can easily obtain quantitative answers, we are never quite certain how relevant these values are to the problem we are trying to solve.
2.4 Which model to use When we design an experiment (e.g., to test a new tool), data can be collected that conforms to several of our data collection models. The sidebar shows how we can collect data evaluating a tool that addresses each of our collection models. In fact, for just about any technology, a data collection method can be devised to collect relevant data on that technology that conforms to any one of the twelve given data collection methods. Our twelve methods are not the only way to classify data collection, although we believe it is the most comprehensive. For example, Basili [3] calls an experiment in vivo, at a development location, or in vitro, in an isolated controlled setting (e.g., in a laboratory). A project may involve one team of developers or multiple teams, and an experiment may involve one projector multiple projects. This permits 8 different experiment classifications. Kitchenham [4] considers 9 classifications of experiments divided into 3 general categories: a quantitative experiment to identify measurable benefits of using a method or tool, a qualitative experiment to assess the features provided by a method or tool, and performance benchmarking. Sidebar. Data collection example. The following represent uses of the evaluation methods to test a new tool: •
Project monitoring. Use the new tool in a project and collect the usual accounting data from the project.
12
•
Case study. Use the tool as part of new development; Collect data to determine if the developed product is easier to produce than similar projects in the past.
•
Assertion. Use the tool to test a simple 100 line program to show that it finds all errors.
•
Field study. Distribute the tool across several projects; Collect data on the impact that the tool had.
•
Literature search. Find other published studies that analyze the behavior of similar tools.
•
Legacy data. Find a previously-completed project that collected data on using the tool; Analyze this data to see if tool was effective.
•
Lessons learned. Find a completed project that used this tool; Interview participants to see if tool had an impact on the project.
•
Static analysis. Use a control flow analysis tool to see if one design method results in fewer logic errors than another design method.
•
Replicated experiment. Develop multiple instances of a module both using and not using the tool; Measure differences.
•
Synthetic. Have 20 programmers spend two hours trying to debug a module, half using the tool and half using other techniques.
•
Dynamic analysis. Execute a program with a new algorithm and compare its performance with the earlier version of the program.
•
Simulation. Generate a set of data points randomly and then execute the tool and another tool to determine effectiveness in finding errors in a given module. End Sidebar
3. Model Validation In order to test whether the classification presented here reflects the software engineering community's idea of experimental design and data collection, we examined software engineering publications covering three different years: 1985, 1990, and 1995. We looked at each issue of IEEE Transactions on Software Engineering (a research journal), IEEE Software (a magazine which discusses current practices in software engineering), and the proceedings from that year's International Conference on Software Engineering (ICSE). We classified each paper according to the data collection method used to validate the claims in the paper. For completeness we added the following two classifications:
13
1. Not applicable. Some papers did not address some new technology, so the concept of data collection does not apply (e.g., a paper summarizing a recent conference or workshop). 2. No experiment. Some papers describing a new technology contained no experimental validation in it. Table 2. Classification of 612 evaluated papers.
Method Not applicable No experimentation Replicated Synthetic Dynamic analysis Simulation Project monitoring Case study Assertion Field study Literature search Legacy data Lessons learned Static analysis Yearly totals
1985 1990 1995 Total ICSE Soft. TSE ICSE Soft. TSE ICSE Soft. TSE 6 6 3 4 16 2 5 7 1 50 16 11 56 8 8 41 10 3 14 167 1 0 0 0 0 1 1 0 3 6 3 1 1 0 1 4 0 0 2 12 0 0 0 0 0 3 0 0 4 7 2 0 10 0 0 11 1 1 6 31 0 0 0 0 1 0 0 0 0 1 5 2 12 7 6 6 4 6 10 58 12 13 54 12 19 42 4 14 22 192 1 0 1 0 0 1 1 1 2 7 1 1 3 1 5 1 0 3 2 17 1 1 2 2 0 2 1 1 1 11 7 5 4 1 4 8 5 7 8 49 1 0 1 0 0 0 0 0 2 4 56 40 147 35 60 122 32 43 77 612
In our survey, we were most interested in the data collection methods employed by the authors of the paper in order to determine comprehensiveness of our classification scheme. Therefore, we tried to carefully distinguish between data used as a demonstration of concept (which may involve some measurements as a “proof of concept,” but not a full validation of the method) and a true attempt at validation of their results. Therefore, as in the Tichy study, a demonstration of a technology via an example was considered part of the analytical phase. The paper had to go beyond that demonstration to show that there were some conclusions about the effectiveness of the technology before we considered that the paper had an evaluative phase. The raw data for the complete study involved classification of 612 papers that were published in 1985, 1990, and 1995. This data is presented in Table 2.
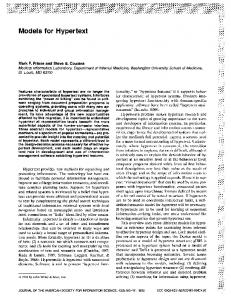
3.1 Quantitative Observations Figure 1 graphically presents the classification of the 562 papers that we classified (e.g., the 612 papers less 50 that were judged to be “not applicable”). The most prevalent validation models appear to be lessons learned and case studies, each at a level of close to 10%. Assertions were close to one-third of the papers. Simulation was used in about 5%
14
of the papers, while the remaining techniques were each used in about 1% to 3% in the papers. About one-third of the papers had no experimental validation; however, the percentages dropped from 36% in 1985 to 29% in 1990 to only 19% in 1995. Improvement in this important category seems to be occurring. Classification of 612 software engineering papers Static analysis Lessons learned Legacy data Literature search Validation method
Field study Assertion Case study Project monitoring 1995 (152 papers)
Simulation
1990 (217 papers) Dynamic analysis
1985 (243 papers)
Synthetic Replicated No experimentation 0
5
10
15
20
25
30
35
40
Per cent papers
Figure 1. Use of Validation Methods in Published Papers. Tichy, in his study, classified all papers into formal theory, design and modeling, empirical work, hypothesis testing, and other. His major observation was that about half of the design and modeling papers did not include experimental validation, whereas only 10% to 15% of papers in other engineering disciplines had no such validation. Many empirical work papers really are the result of an experiment to test a theoretical hypothesis, so it may not be fair to ignore those papers from the set of design and modeling papers. If we assume the 25 empirical work papers in Tichy's study all have evaluations in them, then the percent of design and modeling papers with no validation drops from 50% to about 40% in Tichy's study.(These numbers are approximate, since we don't have the details of his raw data.) This number is consistent with our results. We have started to investigate how these numbers compare to other disciplines. We have looked at various papers in physics, economics and the behavioral sciences. This data is reported elsewhere [10]. What we are finding, however, is that papers in archival research journals
15
(such as the Transactions) does not differ materially from other archival journals in the so-called “hard sciences.”
16
3.2 Qualitative Observations We also offer the following observations made during the classification of the 612 papers: 1. Authors often fail to clearly state the goals, or the value-added, of the method or tool they have developed. 2. Authors fail to state how they propose to validate their hypotheses. We had to inspect each paper carefully in order to determine, as best we could, what the authors were intending to show in the various sections called ”Validation” or “Experimental results.” Often such a section heading was not present and we had to determine if the data so presented could be called a validation. 3. Terms are used very loosely. Authors would use the term “case study” in a very informal manner, and even words like “controlled experiment” or “lessons learned” were used indiscriminately. We attempted to classify each paper by what the authors actually did, not what they called it. It is our hope that our paper can have some effect on formalizing these terms somewhat. There is one major caveat, however, in understanding the data presented. The papers that appear in a publication are influenced greatly by the editor of that publication or program committee in the case of conferences. In our study, the editors and program committees from 1985, 1990,and 1995 were all different. This is then a confounding factor in our analysis process that may have affected our outcome. While our goal is to understand how research in software engineering is validated, the only way to discover such research is via the publications on software engineering, which leads to this dilemma.
4. Conclusion In a 1992 report from the U. S. National Research Council [6], the Panel on Statistical Issues and Opportunities for Research in the Combination of Information recommended: “The panel urges that authors and journal editors attempt to raise the level of quantitative explicitness in the reporting of research findings, by publishing summaries of appropriate quantitative measures on which the research conclusions are based …” Such problems are well-known in the software engineering world, and surveys such as the Tichy survey and our own tend to validate the conclusion that the software engineering community can do a better job in reporting its results. On the other hand, we need to collect accurate data and avoid British economist Josiah Stamp's lament:
17
“The government is very keen on amassing statistics -they collect them, add them, raise them to the nth power, take the cube root and prepare wonderful diagrams. But what you must never forget is that every one of those figures comes in the first instance from the village watchman, who just puts down what he damn pleases.” In this paper we have addressed the need to collect both product and process data in order to appropriately understand the development of software. We have developed a classification model that divides data collection activities into twelve methods. These twelve methods are grouped into three major categories of observational methods which look at contemporary data collection, historical data collection of completed projects, and controlled methods, which apply the scientific method in a controlled setting. Via our analysis of some 600 published papers we observed: 1. Too many papers have no experimental validation at all (about onethird), but fortunately, this number seems to be dropping. 2. Too many papers use an informal (assertion) form of validation. Better experimental design needs to be developed and used. 3. Lessons learned and case studies each are used about 10% of the time; the other techniques are used only a few percent at most. 4. Terminology of how one experiments is sloppy. We hope a classification model can help to encourage more precision in the describing of empirical research. More needs to be done. We have only started to look at the role of theoretical papers (which have no validation) and need to validate such results. We want to characterize the experimental models relative to the types of data they can produce, and the types of data industry needs to select technology. Our goal is to enhance researchers' capability to report on software engineering experimentation to assist industry in selecting new technology.
Acknowledgment We acknowledge the help of Dale Walters of NIST who helped to classify the 600 papers used to validate the classification model described in this paper.
18
References [1] Adrion W. R., Research methodology in software engineering, Summary of the Dagstuhl Workshop on Future Directions in Software Engineering, W. Tichy (Ed.), ACM SIGSOFT Software Engineering Notes, 18, 1, (1993). [2] Basili V. R. and H. D. Rombach, The TAME project: Towards improvement-oriented software environments, IEEE Trans. on Soft. Eng. 14, 6 (1988) 758-773. [3] Basili, V. R., The Role of Experimentation: Past, Present, Future,(Keynote presentation), 18th International Conference on Software Engineering, Berlin, Germany, March, 1996. [4] Kitchenham B. A., Evaluating software engineering methods and tool, ACM SIGSOFT Software Engineering Notes, (January, 1996) 11-15. [5] Li N. R. and M. V. Zelkowitz, An Information Model for Use in Software Management Estimation and Prediction, Second International Conference on Information and Knowledge Management, Washington, DC, November, 1993, 481-489. [6] National Research Council, Combining Information: Statistical Issues and Opportunities for Research, Panel on Statistical Issues and Opportunities for Research in the Combination of Information, National Academy Press, Washington, DC, 1992. [7] Pfleeger S. L., Experimental design and analysis in software engineering, Annals of Software Engineering 1 (1995) 219-253. [8] Tichy W. F., P. Lukowicz, L. Prechelt, and E. A. Heinz, Experimental evaluation in computer science: A quantitative study, J. of Systems and Software 28, 1 (1995) 9-18. [9] Zelkowitz M. V., Yeh R. T., Hamlet R. G., Gannon J. D., Basili V. R., Software engineering practices in the United States and Japan, IEEE Computer 17, 6 (1984) 57-66. [10] Zelkowitz M. and D. Wallace, Experimental validation in software engineering, Information and Software Technology, November, 1997.
19