Aug 20, 2005 - (2) that UV-poor radiation fields can pump the PAH emission bands, provided ...... 1989), the number of C atoms tied up in free PAHs per cm2.
The Astrophysical Journal, 629:1188–1210, 2005 August 20 # 2005. The American Astronomical Society. All rights reserved. Printed in U.S.A.
EXPERIMENTAL NEAR-INFRARED SPECTROSCOPY OF POLYCYCLIC AROMATIC HYDROCARBONS BETWEEN 0.7 AND 2.5 �m A. L. Mattioda,1,2 D. M. Hudgins,1 and L. J. Allamandola1 Received 2005 February 3; accepted 2005 March 30
ABSTRACT The near-infrared (NIR) spectra and absolute band strengths of 27 polycyclic aromatic hydrocarbon (PAH) cations and anions ranging in size from C14 H10 to C50 H22 are reported. The spectra of all the ionized PAHs we have studied to date have strong, broad absorption bands in the NIR. This work shows that ionized PAHs have significant absorption bands at wavelengths longer than predicted by the current astronomical models that consider PAHs in their treatment of the radiation balance of the interstellar medium. Two implications are (1) that ionized/open-shell interstellar PAHs should add weak, broadband structure to the NIR portion of the interstellar extinction curve and (2) that UV-poor radiation fields can pump the PAH emission bands, provided ionized/open-shell PAHs are present. Subject heading gs: astrochemistry — dust, extinction — ISM: general — ISM: molecules — molecular data
1. INTRODUCTION
directed toward understanding their overall UV–visible and near-IR spectral properties. For these electronic transitions, most experimental effort has focused on testing the hypothesis that PAHs are responsible for some of the discrete diffuse interstellar bands (DIBs) that span the visible and near-IR spectral regions (Salama et al. 1996; Bre´chignac & Pino 1999; Biennier et al. 2003). As the IR emission bands were found to be associated with UV-rich objects and the then-available electronic spectra of PAHs showed that PAHs were very strong UV absorbers, it was generally assumed that the interstellar emission bands were pumped by UV photons in spite of occasional early reports that lower energy photons were needed to account for their luminosity (e.g., Aitken & Roche 1983). To better constrain this aspect of the emission process and provide a test of the PAH hypothesis, Uchida et al. (1998) carried out a detailed, careful study of the emission from reflection nebulae pumped by different stellar types. They showed that the interstellar infrared emission bands could be pumped by less energetic photons as well. Given the paucity of experimental data on the overall electronic spectral properties of PAHs taken under appropriate astronomical conditions, this result raised questions about the validity of the PAH model. Understanding how PAHs might moderate the interstellar radiation field as well as using them as probes of the interstellar medium has been severely limited by the lack of complete UV/ visible/near-IR spectroscopic data measured in the laboratory under conditions relevant to the emission regions, where they are isolated (i.e., individual molecules in the gas phase) and likely to be ionized. There are several studies of the UV and visible spectroscopic properties of PAHs relevant to the astrophysical problem. The general electronic spectroscopic properties of only a few PAH ions trapped in various glasses (Kasha 1948; Hoijtink 1959; Hoijtink et al. 1960; Shida & Iwata 1973) and rare gas matrices (Andrews & Blankenship 1981; Andrews et al. 1985) were available when it was recognized that PAHs might be widespread throughout the interstellar medium. These have been followed by experimental and theoretical studies on many PAHs, motivated in large part to address the astrophysical problem (e.g., Hirata et al. 2003, references 22–49). However, very little is known about the overall near-IR spectroscopic properties of many PAHs. To start to remedy this situation for so important
Ground-, air-, and space-based observations have shown that most interstellar and circumstellar objects in the Galaxy and many extragalactic objects emit a spectrum originating from a family of highly vibrationally excited polycyclic aromatic hydrocarbon (PAH) molecules (e.g., Haas et al. 1995; Cox & Kessler 1999 and references therein). The PAH bands dominate the mid-IR spectrum of many, if not most, of these objects. Thanks to a decade of focused laboratory efforts dedicated to understanding their IR spectral properties under interstellar conditions (Mattioda et al. 2003; Hudgins et al. 2000; Szczepanski et al. 1995a; Oomens et al. 2003; Kim & Saykally 2002 and references therein), these features are now being used as new diagnostics of the chemical and physical conditions in a variety of astronomical objects and environments, including planetary and reflection nebulae, the diffuse ISM, normal galaxies, starburst regions in galactic nuclei, and many other objects (e.g., Allamandola et al. 1999; Pech et al. 2002; Verstraete et al. 2001; Peeters et al. 2002, 2004; Hony et al. 2001; van Kerckhoven et al. 2000; Moutou et al. 2000; Roussel et al. 2001). Furthermore, in addition to probing local conditions, given the presence of the PAH emission spectrum in many extragalactic spectra, it can serve as an important tracer of carbon and molecular evolution in the universe (e.g., Lagache et al. 2004). Finally, and most relevant for this work, PAHs also moderate the radiation field, lending structure to the extinction curve and efficiently converting optical photons into mid-infrared photons. Although several interstellar processes such as UV photon absorption, electron recombination, and hydrogen addition can pump PAHs into highly vibrationally excited states, the mechanism that most efficiently excites the emission from the majority of objects measured to date is that of optical photon absorption. Over the past 15 years, while a significant amount of laboratory and theoretical work has been directed toward understanding the global infrared spectral properties of PAHs under conditions appropriate to the emission zones (i.e., cold, isolated molecules in their neutral and ionized forms), significantly less has been
1 2
NASA Ames Research Center, Moffett Field, CA 94035-1000. SETI Institute, 515 North Whisman Road, Mountain View, CA 94043.
1188
1189
PAH NEAR-IR SPECTROSCOPY an interstellar species, we have undertaken an ongoing, systematic study of the near-infrared (NIR) spectroscopic properties of PAH ions isolated in argon matrices in parallel to our midinfrared work. The results of this investigation are summarized here. Nearly all ionized PAHs we have studied to date have strong, broad absorption bands in the NIR arising from electronic transitions. The NIR spectra and absolute band strengths of 12 PAHs (C14 H10 to C24 H12) in the 14000–9000 cm�1 (0.7–1.1 �m) region and 15 PAHs (C18H22 to C50H22) in the 14000–4000 cm�1 (0.7–2.5 �m) region are reported in this paper. We then consider several astrophysical applications, including the possible influence interstellar PAHs may have on the NIR portion of the extinction curve and their role in pumping the IR emission features. 2. EXPERIMENTAL The matrix isolation infrared spectroscopy techniques employed in these studies have been described in detail previously (Hudgins & Allamandola 1995a; Hudgins & Sandford 1998) and will be summarized here only briefly. Matrix-isolated PAH samples were prepared by vapor codeposition of the species of interest with an overabundance of argon onto a 14 K CsI window suspended in a high-vacuum chamber ( p < 10�8 torr). The samples were vaporized from heated Pyrex tubes, while argon was admitted through an adjacent length of copper tubing cooled by liquid nitrogen, N2(l ). Deposition temperatures for the individual PAHs are provided in Table 1. Estimates based on the characteristic band intensities of PAHs and the calibrated argon deposition rate place the Ar/PAH ratio in these experiments in excess of 1000/1 (Hudgins & Sandford 1998). The PAH samples used in this investigation were obtained from a variety of sources. PAHs 15–27 (see Table 1) were obtained from Professor Werner Schmidt, Institute for PAH Research, Germany. Sources for PAHs 1–14 are identified in Hudgins et al. (2000) and Hudgins & Allamandola (1997, 1995a, 1995b). Although some of the samples are of unspecified purity, the absence of any notable discrepant spectral features between the theoretical and experimental mid-infrared spectra indicates that impurity levels are no more than a few percent. All NIR spectra reported here were measured at 2 cm�1 resolution by co-adding 500 scans or more on either a Nicolet 740 or Digilab Excalibur 4000 Fourier transform infrared spectrometer. The spectra measured with the Nicolet 740 spanned the 15000–9000 cm�1 (0.66–1.11 �m) range, and those measured with the Excalibur 4000 covered the 15000–4000 cm�1 (0.66–2.5 �m) range. Mid-infrared spectra (4000–500 cm�1, 2.5–20 �m) were measured for each of these samples as well and are reported elsewhere (see mid-IR cross references in Table 1). The 15000–9000 cm�1 (0.66–1.11 �m) spectra were collected using an NIR source, a quartz beam splitter, and a silicon detector. PAH spectra between 11000 and 7000 cm�1 (0.91–1.43 �m) were collected using the spectrometer’s NIR source (tungsten lamp) in conjunction with a quartz beam splitter and a liquid nitrogen–cooled MCT-B detector (typically used for the mid-IR). Spectra between 7000 and 500 cm�1 (1.43 and 20 �m) were collected using the MCT-B detector in combination with a KBr beam splitter. The number of scans was chosen to optimize both the signal-to-noise ratio as well as time requirements of each experiment. The spectra of PAHs numbered 1–14 in Table 1 and shown in Figures 1, 2, and 3 were measured using the Nicolet 740 as part of our initial mid-IR studies and do not include the 9000–4000 cm�1 (1.11–2.5 �m) region. These spectra were
measured in the configuration described earlier. The spectra of PAHs 4 and 7 were also measured out to 7000 cm�1 using the Digilab spectrometer. PAH ions were generated by in situ vacuum ultraviolet photolysis of the matrix-isolated neutral PAH compound. This was accomplished with the combined 120 nm Ly� (10.1 eV) and the 160 nm molecular hydrogen emission bands (centered around 7.8 eV) from a microwave-powered discharge in a flowing H2 gas mixture at a dynamic pressure of 150 mtorr. Comparison of the pre- and postphotolysis mid-infrared spectra permits identification of PAH ion features (Hudgins et al. 2000) and allows for the determination of the percent ionization of the sample (Mattioda et al. 2003). Assuming that all neutral PAH molecules that disappear are converted into ions, we can derive an upper limit to the ionization efficiency by measuring the percent decrease in the integrated areas of the neutral mid-infrared bands that accompanies photolysis. Ionization efficiencies are typically around 15%, but vary based on PAH size and structure. To confirm the attribution of a photoproduct band, in both the mid- and near-infrared spectrum, to the PAH cation, parallel experiments were conducted in which the argon matrix was doped with an electron acceptor, NO2, at a concentration of approximately 1 part in 1200. The presence of this electron acceptor quenches the formation of anions and enhances the production of cations. R Integrated intensities ( � d�) for individual bands were determined using the Win-IR Pro spectrometer control/data analysis software package provided by Digilab. Absolute intensities R [A ¼ ( � d�)/N , where � is the optical depth and N is the density of absorbers in molecules cm�2] for the experimentally measured near-infrared bands were calculated as follows. The total number of absorbers (PAH molecules) was determined by taking the ratio of the sum of the experimental integrated band areas between 1600 and 500 cm�1 (6.25 and 20 �m) to the total theoretical sum for the same region, P1600
N ¼ P500 1600 500
Aexp Athy
:
This range was chosen to exclude the contributions of (1) the far-infrared bands (� < 500 cm�1) that were not measured in the experiment; (2) the CH stretching bands, whose intensities are substantially overestimated by the calculations (Bauschlicher & Langhoff 1997; Hudgins & Sandford 1998); and (3) the overtone/combination bands in the 2000–1650 cm�1 (5–6.1 �m) region, whose intensities are not calculated in the theoretical results. This method takes advantage of the fact that although there may be significant band-to-band variability in the accuracy of the calculated intensity, the total intensity is generally accurate to 10%–20%, excluding the C�H stretching region. Based on the total surface density of absorbers (N ) and the upper ionization limit (determined by the percent decrease in the integrated areas of the neutral mid-infrared bands accompanying photolysis), one can calculate the number of ions present in each experiment and thus the A-values (in km mol�1) presented in Table 1 as well as Tables 2–12. Similarly, all spectra have been normalized to include the same number of ions (1 ; 1015 ). For presentation purposes only, the data have been baseline corrected. The anion figures were obtained by subtracting off the cation bands (obtained from the Ar/NO2 matrix isolation experiment), using the Win-IR software package. No further
1190
MATTIODA, HUDGINS, & ALLAMANDOLA
Vol. 629
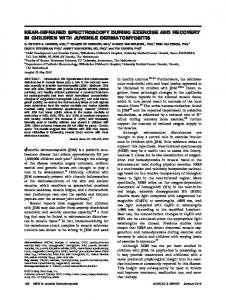
Fig. 1.—Matrix-isolated near-IR absorption spectra for phenanthrene, fluoranthene, pyrene, chrysene, and 1,2-benzanthracene cations. The numbers in the upper right-hand corners correspond to the PAH numbers in Table 1. Spectra have been normalized to an equivalent number of ions (1 ; 1015 ). Asterisks indicate bands due to artifacts.
data reduction was necessary. All numerical values were obtained from the original (unaltered) data. 3. RESULTS The near-infrared spectra of 27 different PAHs, ranging in carbon number from C14 to C50, are presented here. Table 1 presents the names, formulae, structures, deposition temperatures, total NIR band strengths, and cross references to other relevant spectroscopic studies. The PAHs are listed in order of increasing carbon number in the table with the numbers in the first column used as identifiers for each PAH throughout the text. The corresponding spectra are presented in Figures 1–6, with peak positions and integrated absorbance values for the major bands listed in Tables 2–12. 3.1. Near-Infrared Spectral Characteristics Inspection of Table 1 shows that the PAHs studied here can be divided into two groups, small PAHs (C14H10 to C24H12) and large PAHs (C34H16 to C50H22). In general, the spectra for the small PAHs (Figs. 1, 2, and 3) cover the range from 14000 to 9000 cm�1 (0.7–1.1 �m), and the spectra for the large PAHs (Figs. 3, 4, 5, and 6) cover the 14000–4000 cm�1 (0.7–2.5 �m)
range. Spectra between 14000 and 4000 cm�1 were also measured for the small PAHs 4 and 7. Although a feature was detected at 1.17 �m (8560 cm�1) in the extended molecule 4 spectrum, no additional features were identified in molecule 7. Since the purpose of this paper is to present a summary of the overall NIR spectroscopic properties of these species, rather than a detailed analysis of each spectrum, only general trends within each of these groups are described in this section. Detailed spectroscopic discussions for some of the PAH spectra presented here can be found in the electronic transition cross references listed in Table 1. Most spectra tend to be dominated by a single strong band or a cluster of strong bands falling between 13000 and 8000 cm�1 (0.77 and 1.25 �m). While bands from the smaller species tend to fall at the upper end of this range, the larger species absorb at the lower end. Anion bands, when present, tend to be substantially weaker than those of the corresponding cation. The 14 small PAH spectra presented in Figures 1–3 show that in the 14000–9000 cm�1 (0.7–1.1 �m) region, many are dominated by a strong ‘‘narrow’’ band (full width at halfheight ½FWHH� < 500 cm�1) with clear vibronic substructure to the blue. Following Andrews et al. (1985) and assigning the
No. 2, 2005
PAH NEAR-IR SPECTROSCOPY
1191
Fig. 2.—Matrix-isolated near-IR absorption spectra for tetracene, benzo[a]fluoranthene, benzo[b]fluoranthene, benzo[ j ]fluoranthene, benzo[k]fluoranthene, and benzo[e]pyrene cations. Anion features are indicated by a circled minus sign above the band. Spectra have been normalized to an equivalent number of ions (1 ; 1015 ). The numbers in the upper right-hand corners correspond to the PAH numbers in Table 1.
prominent absorption to the 0–0 band for PAHs 1, 4, 5, and 8, vibronic bands with spacings lying 600–800 cm�1 and 1200– 1600 cm�1 to the blue are clearly present. For example, the spectrum of 1,2-benzanthracene (PAH 5) is dominated by the peak at 0.8913 �m (11220 cm�1, FWHH � 250 cm�1), with two clear bands to the blue centered near 0.8434 and 0.8010 �m (11860 and 12490 cm�1). In this case, the spacings between the prominent band and the two satellite bands are 640 and 1270 cm�1, respectively. This vibronic band pattern is also evident for PAHs 6, 11, 13, and 14; however, for these species band splitting is severe. These vibronic spacings correspond to progressions involving the CH out-of-plane bends and CC stretching vibrations, respectively, and are similar to a pattern seen in the vibronic absorption spectra of many (not all) PAH cations (e.g., Andrews et al. 1985; Salama & Allamandola 1991). In addition, several of the small PAH spectra show very broad (FWHH > 500 cm�1), prominent features (PAHs 2, 7, and 9). Interestingly, of the five PAHs containing a pentagonal ring, three of them (PAHs 2, 7, and 9) have exceptionally broad, strong absorption bands. Finally, of these 14 small PAHs, only three show bands that can be exclusively attributed to the anion, PAHs 7, 9, and 11. Two of these incorporate a pentagonal ring.
The 13 larger PAH spectra shown in Figures 3–6 cover the range from 14000 to 4000 cm�1 (0.7–2.5 �m). As with the smaller PAH spectra, some have prominent broad features (PAHs 21, 24, 25, and 27), and a few are dominated by a narrow band with weak satellite bands indicating a vibronic progression involving the CH out-of-plane bending and CC stretching modes (PAHs 16, 17, and 18). The spectra of PAHs 19 and 23 may also show this pattern; however, band splitting or broadening is severe for these molecules. Of particular interest for these larger PAHs is the higher fraction for which bands solely attributable to the anion form appear (PAHs 15, 16, 17, 18, 19, 20, 21, 24, 25, 26, and 27). This is consistent with PAH electron affinity increasing with size. Where appropriate, Table 1 includes cross references to other experimental and theoretical studies of the electronic transitions in isolated PAHs. Andrews and collaborators measured the first optical spectra of several PAH cations isolated in an argon matrix (Andrews & Blankenship 1981; Andrews et al. 1985). This work included PAHs 1, 4, 5, and 6 studied here. There is excellent agreement in band positions, profiles, and relative intensities for the common wavelength regions considered in these two studies. The NIR electronic spectrum of the phenanthrene (PAH 1) cation has also been studied in a neon matrix (Salama
1192
MATTIODA, HUDGINS, & ALLAMANDOLA
Vol. 629
Fig. 3.—Matrix-isolated near-IR absorption spectra for benzo[ g,h,i ]perylene, pentacene, coronene, and 3,4;5,6;7,8-tribenzoperopyrene cations. Anion bands are displayed as insets. Spectra have been normalized to an equivalent number of ions (1 ; 1015 ). The numbers in the upper right-hand corners correspond to the PAH numbers in Table 1.
et al. 1994) and the gas phase (Bre´chignac & Pino 1999). The general features of the spectrum shown in Figure 1, a strong, narrow feature near 11000 cm�1 (0.9 �m) with two moderately strong and two weak vibronic bands to the blue, repeat in all cases. Both the neon and argon matrix bands are redshifted with respect to the gas-phase lines by roughly 100 cm�1, with the peaks in an argon matrix about 25 cm�1 to the red of those in a neon matrix. The gas-phase phenanthrene cation absorption lines are much narrower than the matrix bands. Interestingly, the FWHHs for the phenanthrene cation bands, when phenanthrene is isolated in an argon matrix (FWHH ¼ 60 cm�1), are significantly smaller than those measured for the phenanthrene cation isolated in a neon matrix (FWHH ¼ 700 cm�1). The electronic spectrum of PAH 25, isolated as a cation in a neon matrix, has also been reported (Ruiterkamp et al. 2002). As above, the argon and neon matrix spectra are very similar. Although there is a much larger redshift, about 220 cm�1, between the main peak positions in neon and argon, the FWHH is significantly smaller in an argon matrix (440 cm�1) than in a neon matrix (930 cm�1). The electronic spectrum of the pyrene cation (PAH 3) isolated in an argon matrix from 200 to 800 nm (50000–12500 cm�1) has been ana-
lyzed by Vala et al. (1994). There is excellent agreement between the pyrene cation spectrum discussed here and that reported by Vala et al. in the wavelength region common to both studies. The theoretically determined vertical excitation energies (in eV) have been compared with tabulated experimental values for nine of the 14 small PAH ions listed in Table 1 (Hirata et al. 2003). Although Hirata et al. do not present the spectra from which the experimental vertical energies were determined, in the regions of overlap, there is very good agreement between their listed experimental values in eV and the positions of the bands in Figures 1–3. 3.2. Near-Infrared Band Intensities Given the astrophysical importance of quantitative band strengths as well as spectral band information, integrated absorbance values (km mol�1) for the bands in the spectra shown in Figures 1–6 are listed in Tables 2–12. While it is not customary to describe band strengths of electronic transitions in units of km mol�1, we do so here in order to facilitate comparisons with mid-IR band strengths, which are normally presented in these units. These data are also presented as oscillator
No. 2, 2005
PAH NEAR-IR SPECTROSCOPY
1193
Fig. 4.—Matrix-isolated near-IR absorption spectra for 3,4;5,6;7,8;12,13-tetrabenzoperopyrene, 3,4;5,6;10,11;12,13-tetrabenzoperopyrene, 12,13-o-phenylene3,4;5,6;7,8-tribenzoperopyrene, and dipyreno-(10 ,30 ;10,2),(100 ,300 ;5,7)-pyrene cations. Anion features are displayed as insets or are indicated by a circled minus sign above the band. Spectra have been normalized to an equivalent number of ions (1 ; 1015 ). The numbers in the upper right-hand corners correspond to the PAH numbers in Table 1.
strength, f, in Table 1 as well as in Tables 2–12. For Table 1, the oscillator strength is defined over all of the bands that make up an electronic transition, not individual vibronic components; the integrated absorbance values (km mol�1) for each of the bands in an individual spectrum were summed before the conversion to f was made. Thus, the oscillator strength reported in Table 1 is derived from the total integrated area of the bands shown in Figures 1–6. The oscillator strength was determined by multiplying the total integrated absorbance by 1:87 ; 10�7 mol km�1 (Kjaergaard et al. 2000). Implicit in this conversion is the assumption that most of the strength of the bands corresponding to the electronic transition appears in the spectral regions studied. While this may not be the case for some of the PAHs, especially 1–14, it probably holds for most. Table 1 lists both oscillator strength and total integrated absorbance values in units of km mol�1. The reliability of these f-values is discussed further below. For most of the small PAHs considered here (PAHs 1–14, Table 1), the oscillator strengths range from 3 ; 10�3 up to 3 ; 10�2 . Within this size range the benzo[k]fluoranthene cation
(PAH 10) stands out with f ¼ 8 ; 10�2 . As one would anticipate, the oscillator strengths for most of the larger PAHs (15– 27) are slightly larger, falling between 1:9 ; 10�2 and 6:3 ; 10�2 . However, there are two remarkable exceptions in the sample considered here, PAHs 25 and 27, with oscillator strengths of 2:6 ; 10�1 and 1:3 ; 10�1 , respectively. We have considered possible connections between f-values and parameters such as molecular size (as measured in carbon number), structure, and C/H ratio. Apart from a loose correlation of f with carbon number, none of these other molecular properties strongly influences f behavior, as one might expect given such a diverse population of PAH molecular structures. Theoretically calculated oscillator strengths are available for nine of the small PAHs considered here, and they are also presented in Table 1. The theoretical values are larger than the experimental values, and the variance is quite large. For most of these species, fth/fexp lies between about 1.3 and 10. The largest discrepancy, 30, is associated with phenanthrene (PAH 1), the smallest PAH considered here. In spite of its fundamental astrophysical importance, determining reliable PAH ion oscillator
1194
MATTIODA, HUDGINS, & ALLAMANDOLA
Vol. 629
Fig. 5.—Matrix-isolated near-IR absorption spectra for 1,14-benzodinaptho-(10 ,700 ;2,4), (70 00 ,10 00 ;11,13)-bisanthene, 2,3;12,13;15,16-tribenzoterrylene, 1,18;4,5;9,10;13,14-tetrabenzoheptacene, and 1,2;3,4;5,6;7,8;9,10;12,13-hexabenzoperopyrene cations. Anion features are displayed as insets or are indicated by a circled minus sign above the band. Spectra have been normalized to an equivalent number of ions (1 ; 1015 ). The numbers in the upper right-hand corners correspond to the PAH numbers in Table 1.
strengths for electronic transitions experimentally has proven particularly challenging (Hudgins & Allamandola 1995b; Salama & Allamandola 1991). Due to the inherent difficulty in maintaining a stable, isolated PAH ion population, the vast majority of spectroscopic studies have been carried out in inert gas matrices. Comparisons between gas-phase and matrix isolation spectroscopic studies with quantum calculations have shown that matrix perturbations are minor when studying PAH ion vibrational transitions, which give rise to the well-known interstellar infrared emission bands (e.g., Hudgins & Allamandola 2004; Mattioda et al. 2003), and matrix isolation studies can be directly applied to the interstellar IR emission bands. This is not generally so for electronic transitions, which give rise to bands spanning the UV to the NIR spectral range. As illustrated above by the NIR band shifts and FWHH variations between argon and neon matrices and gas-phase studies, the matrix environment can severely perturb intrinsic electronic band positions and band shapes. Thus, it is possible that electronic transition band strengths are perturbed as well. The matrix influence on band strengths is not only matrix dependent, but is also influenced by other species present (Hudgins &
Allamandola 1995a). Furthermore, it also appears to depend on the method of determination. For example, Salama et al. (1994) studied the electronic transition of the neon matrix– isolated phenanthrene cation corresponding to the same transition reported here for phenanthrene (PAH 1) in an argon matrix. Salama et al. calculated the number of phenanthrene ions produced from the reduction in the absorbance of the neutral phenanthrene electronic bands in the UV. This is in contrast to the method employed here in which the number of phenanthrene ions produced is determined by the reduction in the absorbance of the neutral phenanthrene vibrational bands in the mid-IR. The discrepancy is unacceptably large. Salama et al. report an f-value of 6 ; 10�5 for this phenanthrene cation transition in a neon matrix, while we determine f ¼ 3:5 ; 10�3 from the argon matrix data. These values are to be compared with theoretical values that range from 0.096 to 0.16. To the best of our knowledge, the pyrene cation (PAH 3) is the only other PAH cation for which theoretical and experimental NIR oscillator strengths have been reported. In contrast to the theoretical value of 0.015 (Hirata et al. 2003), Vala et al. (1994) report f � 0:008, compared to our value of f � 0:004. Ehrenfreund
No. 2, 2005
PAH NEAR-IR SPECTROSCOPY
1195
Fig. 6.—Matrix-isolated near-IR absorption spectra for difluoranthen-(30 ,50 ;4,6),(400 ,600 ;9,11)-coronene, dicoronylene, 12,13-o-phenylene-1,2;3,4;5,6;7,8;9,10pentabenzoperopyrene, and 1,14-benzodiphenanthreno-(100 ,900 ;2,4),(9000 ,1000 ;11,13)-bisanthene cations. Anion features are displayed as inserts or are indicated by a circled minus sign above the band. Spectra have been normalized to an equivalent number of ions (1 ; 1015 ). The numbers in the upper right-hand corners correspond to the PAH numbers in Table 1.
et al. (1995) have measured the NIR spectrum for the coronene cation isolated in an argon matrix and determined f � 0:005. This compares favorably with our value of f � 0:006. In summary, there is a large variation in reported PAH ion oscillator strengths, regardless of the means of determination. In those cases for which argon matrix data are available, differences of at most a factor of 2 are encountered. Inspection of Table 1 shows that when theoretical data are available, most of our experimental values are 1.3–10 times smaller. Given that the f-values listed in Table 1 represent the largest collection of experimentally determined PAH ion oscillator strengths, we use these below. 4. ASTROPHYSICAL CONSIDERATIONS The spectra shown in Figures 1–6 and corresponding absolute absorption strengths listed in Tables 2–12 illustrate that PAH ions have NIR transitions that warrant consideration when evaluating the effects of PAHs on the interstellar radiation field. Here we consider two applications that impact observations: the ability of NIR photons to pump the mid-IR PAH emission
bands, and the possibility that PAHs can impose broadband structure on the interstellar extinction curve in addition to contributing to the discrete DIBs. 4.1. Pumping the Mid-IR PAH Emission Features with NIR Photons An important and long-standing issue concerning the model that IR fluorescence from highly vibrationally excited PAHs is responsible for the interstellar mid-IR emission features has to do with the excitation mechanism. While several processes such as chemical and electron-ion recombination reactions and radiative pumping can produce highly vibrationally excited species, the early association of the interstellar emission bands with UV-rich sources pointed to radiative excitation as the principal excitation mechanism of the unidentified infrared (UIR) features (Allamandola et al. 1979). With time, pumping by UV radiation became a central tenet of all PAH models because of this association of the interstellar emission bands with UV-rich sources and because PAHs have strong, broad UV absorption bands (Allamandola et al. 1989; Puget & Leger 1989; Schutte
1196
MATTIODA, HUDGINS, & ALLAMANDOLA
Vol. 629
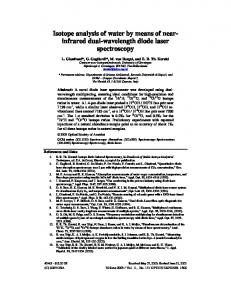
Fig. 8.—Average wavelength-dependent experimental NIR cross sections produced by the PAHs listed in Table 1 (NC ¼ 14 50) compared with the modeled cross sections for PAHs with NC ¼ 20, 40, 50, 100, and 200 C atoms.
Fig. 7.—NIR absorption cross section (per C atom) of PAHs containing NC ¼ 20, 40, and 50 C atoms taken from the spectra presented in x 3 compared with the theoretical absorption cross section of like-sized PAHs determined using the formalism described in Li & Draine (2001) for generic astronomical PAH molecules.
et al. 1993; Pech et al. 2002; Verstraete et al. 2001). However, if radiative pumping was the excitation mechanism, early work by Aitken & Roche (1983) already indicated that, to avoid UV to IR photon fluorescent efficiencies exceeding unity, excitation by visible photons would be required to account for the mid-IR band intensities from NGC 7027. More recently, this tenet of the PAH model has been questioned by very careful observations of the mid-IR emission from a number of UV-poor reflection nebulae by Uchida et al. (1998, 2000), which show that the UIR spectrum is present and largely independent of stellar type for B- to F-type stars. While small neutral PAHs have a steep and sharp absorption cutoff in the UV with weaker absorption extending into the visible, this cutoff smoothly moves to longer wavelength with increasing PAH size (Birks 1970). Since this absorption characteristic of neutral (closed shell) species was incorporated in
most PAH emission models (Schutte et al. 1993; Li & Draine 2001; Bakes et al. 2001), these models could not account for observations of the UIR bands from UV-poor objects. However, as shown here in detail, upon ionization the neutral PAH electronic configuration changes from closed shell to open shell (radical), and moderate to strong transitions at considerably longer wavelengths become possible (see references listed in Table 1 and Salama et al. [1996] and references therein for discussions of the theory). Extending their model to include this size and charge dependence, Li & Draine (2002) showed that PAHs could account for the UIR emission features in these UV-poor reflection nebulae. However, since the number of visible and near-IR PAH ion experimental spectra available upon which to extend their model was limited, they extrapolated the cutoff wavelength in accord with the data then available. The predicted wavelength-dependent absorption cross sections derived using the formalism developed in Li & Draine (2002) for specific-sized PAHs are compared with the measured wavelength-dependent NIR absorption cross sections of four individual PAHs in Figure 7. The experimental cross sections for all of the PAHs listed in Table 1 were determined from the NIR absorption spectra presented in x 3. This comparison shows that ionized PAHs absorb with substantial strength at significantly longer wavelengths than predicted for the modeled generic ‘‘astronomical PAHs.’’ Figure 8 extends this by comparing the wavelength-dependent theoretical absorption cross sections of substantially larger astronomical PAHs to the wavelengthdependent NIR cross section produced by co-adding the experimental cross sections for all the PAHs listed in Table 1 and dividing by the total number of PAHs in the sample. Remarkably, this comparison shows that although they only span the size range from C14 through C50, these ionized PAHs absorb with substantial strength at significantly longer wavelengths than predicted even for large, several-hundred-C-atom–sized PAHs. These data show that radical PAH ions readily absorb near-IR photons, permitting the pumping of PAHs into highly vibrationally excited states, which then relax via emission of IR photons even in UV-poor regions. In a separate publication we develop a semiempirical model that takes these new NIR data into account, and we assess the relative importance of NIR and UV-visible photons in pumping the mid-IR PAH emission features (Mattioda et al. 2005).
No. 2, 2005
1197
PAH NEAR-IR SPECTROSCOPY
4.2. Interstellar PAHs and the Extinction Curve
5. CONCLUSIONS
There is overwhelming evidence that ionized PAHs are widespread throughout the diffuse interstellar medium (Mattila et al. 1996; Onaka et al. 1996). NIR transitions in these species could impose detectable structure on the extinction curve. Here we estimate the extent of this possible contribution. The cases we consider are somewhat contrived, as there are likely many hundreds if not hundreds of thousands of different PAH molecular structures that could contribute spectroscopic structure to the extinction curve. Knowing neither the different structures nor their corresponding spectra, we approximate the situation as follows. Using the standard relationship, NH /E(B � V ) ¼ 5:8 ; 1021 atoms cm�2 mag�1 (Bohlin et al. 1978), where NH is the number of hydrogen atoms per cm2 along the line of sight and E(B � V ) is the reddening expressed in magnitudes taking 3 ; 10�4 for the cosmic C/ H ratio, the number of carbon atoms per cm2 per E(B � V ) becomes NC /E(B � V ) ¼ 1:7 ; 10þ18 . Assuming that 10% of the available cosmic carbon is in the form of free PAHs (e.g., Allamandola et al. 1989; Puget & Leger 1989), the number of C atoms tied up in free PAHs per cm2 per E(B � V ) is then NC-PAH /E(B � V ) ¼ 1:7 ; 10þ17 . This is, however, a very conservative lower limit for the total amount of cosmic carbon tied up in PAH structures, since the 10% value for the amount of available carbon in PAHs holds for those contributing to the mid-IR emission features. Larger PAHs, PAH clusters, and amorphous carbon particles rich in PAH structures that do not contribute to the mid-IR features must also be present, and many of these will also have NIR transitions. However, for the sake of this analysis we assume an average of 50 C atoms per PAH. In this case, NPAH ¼ 3:4 ; 10þ15 E(B � V ) molecules cm�2. Assuming a situation in which 10% of the PAHs in the total PAH ion population all absorb at nearly the same wavelength, the optical depth (� ¼ ln Io /I ) of a band in the NIR portion of the extinction curve produced by these PAHs is estimated as follows. The spectra and integrated absorbance values presented in x 3 show that PAH cations containing between 40 and 50 C atoms often possess a discrete absorption band near 9000 cm�1 (1.1 �m) with a FWHH � 400 cm�1 (�0.04 �m), having integrated absorbance values (A) between roughly 1:6 ; 105 and 6:9 ; 105 km mol�1 (2:56 ; 10�14 and 1:1 ; 10�13 cm molecule�1). Since NPAH A � (�) d�, the optical depth becomes NPAH A/d�. Taking A � 5 ; 10�14 cm molecule�1, d� ¼ 400 cm�1, and NPAH ¼ 3:4 ; 10þ14 E(B � V ) molecules cm�2 (for 10% of the PAH ion population) yields a �/mag ¼ 0:04 for an absorption band produced by these interstellar PAH molecules. Thus, the data presented here suggest that there should be weak, but detectable, broadband structure originating in ionized PAHs superposed on the NIR portion of the interstellar extinction curve.
The near-infrared (NIR) spectra and band strengths of a wide variety of polycyclic aromatic hydrocarbon (PAH) ions have been reported. Oscillator strengths and integrated absorbance values have been determined for these NIR transitions. Many of the NIR spectra of the small PAH cations are dominated by a strong, narrow band and show clear weaker vibronic substructure to the blue due to progressions involving the CH out-of-plane bends and CC stretching vibrations. As with the smaller PAH spectra, some of the larger PAH cations have spectra with prominent broad features, while others are dominated by a narrow band with weak satellite bands indicating a vibronic progression involving the CH out-of-plane bending and CC stretching modes. While all the spectra show PAH cation bands, strong PAH anion features become more important in the spectra of the larger species. Two astrophysical applications have been considered in the text. The first has to do with interstellar extinction. Since the spectra of ionized PAHs show strong NIR transitions, and PAHs are present in the interstellar medium, they could add detectable structure to the extinction curve. The band strengths reported here suggest that ionized interstellar PAHs should add weak, broadband structure to the NIR portion of the interstellar extinction curve. The second issue has to do with the important question, can UV-poor radiation fields pump the PAH bands? The data presented here show that open-shell PAH ions have significant absorption features in the near-infrared, and PAHs can be pumped into vibrationally excited states even in UVpoor regions. It is also important to keep in mind that some structures of neutral PAHs can also have open-shell, radical electronic configurations, as do the ions studied here (e.g., Hudgins et al. 2001, 2005; Szczepanski et al. 2002), and these will also possess longer wavelength electronic transitions, albeit likely having lower cross sections than ionized open-shell species. Thus, even in regions dominated by nonionizing radiation, it may be possible to detect the emission or absorption from neutral, openshell PAH species.
The research presented here was supported through the Long Term Space Astrophysics Program (399-20-40) with earlier support from NASA’s Laboratory Astrophysics Program. Andrew Mattioda acknowledges the support of the National Research Council. We are deeply indebted to Robert Walker for his outstanding technical support of all phases of the experimental work. We also gratefully acknowledge very insightful discussions with Jan Cami concerning the impact of the NIR transitions on the extinction curve.
APPENDIX Table 1 lists the PAHs used in this laboratory investigation, along with their designated number (for use with the figures), molecular formula, deposition temperature, total oscillator strength in the NIR, and appropriate references. Oscillator strengths for the individual PAH cation bands can be found in Tables 2–7, while the oscillator strengths of the individual PAH anion bands can be found in Tables 8–12. Tables 2–12 are arranged in order of increasing PAH size, in accordance with Table 1 and Figures 1–6.
TABLE 1 Name, Formula, Structure, and Related Information for the PAHs Investigated Here References Total A Chemical Structure
Oscillator Strength f
Deposition Temperature (� C)
Cation (Anion) (103 km mol�1)
Cation (Anion) (10�3)
Theorya (10�3)
Number
Compound Name
Molecular Formula
1...................
Phenanthrene
C14H10
10
19.0
3.5
96.0
2...................
Fluoranthene
C16H10
45
140.0
26.0
3...................
Pyrene
C16H10
65
20.1
4...................
Chrysene
C18H12
95
5...................
1,2-benz[a] anthracene
C18H12
6...................
Tetracene
7...................
NIR Experimental
Theory
1
1, 2, 3, 4
5
71.0
6
...
5
3.8
15.0
1, 7, 8
1, 7
5, 7, 9
160.0
31.0
...
10
2
5
85
120.0
22.0
67.0
10
2
5
C18H12
125
130.0
24.0
11, 13
2, 11, 13
5
Benzo[a] fluoranthene
C20H12
95
75.0b (25.0)
14.0 (4.7)
...
6
...
...
8...................
Benzo[b] fluoranthene
C20H12
95
79.0
15.0
...
6
...
...
9...................
Benzo[ j] fluoranthene
C20H12
95
40.0 (31.0)
7.5 (5.9)
...
6
...
...
10.................
Benzo[k] fluoranthene
C20H12
110
450.0
85.0
...
6
...
...
11.................
Benzo[e] pyrene
C20H12
105
25.0 (4.03)
4.7 (0.76)
6.0
1
1
5
12.................
Benzo[g,h,i] perylene
C22H12
130
31.0
5.9
57.0
1
1
5
13.................
Pentacene
C22H14
200
130.0
24.0
185.0
11, 12
11, 12, 14
5
14.................
Coronene
C24H12
155
32.0
6.1
8.0
1, 8
1, 15
5
15.................
3,4;5,6;7,8tribenzo peropyrene
C34H16
314
180.0 (130.0)
34.0 (24.0)
...
16
...
...
16.................
3,4;5,6;7,8;12,13tetrabenzo peropyrene
C36H16
325
220.0 (19.0)
40.0 (3.6)
...
16
...
...
17.................
3,4;5,6;10,11;12,13- C36H16 tetrabenzo peropyrene
335
110.0 (45.0)
21.0 (8.4)
...
16
...
...
1198
133
Mid-IR
TABLE 1—Continued References
Number
Compound Name
Molecular Formula
Chemical Structure
Total A
Oscillator Strength f
Deposition Temperature (� C)
Cation (Anion) (103 km mol�1)
Cation (Anion) Theorya (10�3) (10�3)
NIR Mid-IR
Experimental
Theory
18................ 12,13-ophenylene3,4;5,6;7,8tribenzoterrylene
C40H18
364
160.0 (62.0)
30.0 (12.0)
...
16
...
...
19................ Dipyreno(10 ,30 ;10,2), (100 ,300 ,5,7)pyrene
C40H18
396
170.0 (63.0)
32.0 (12.0)
...
16
...
...
20................ 1,14-benzodinaptho(100 ,700 ;2,4), (7000 ,1000 ;11,13)bisanthene
C42H18
420
320.0b (401.0)b
60.0 (75.0)
...
16
...
...
21................ 2,3;12,13;15,16tribenzo terrylene
C42H22
344
340.0 (420.0)
63.0 (78.0)
...
16
...
...
22................ 1,18;4,5;9,10;13,14tetrabenzo heptacene
C42H22
380
270.0 (NA)
50.0 (13.0)
...
16
...
...
23................ 1,2;3,4;5,6;7,8; 9,10;12,13hexabenzo peropyrene
C44H20
423
150.0 (0.51)
28.0 (0.1)
...
16
...
...
24................ Difluoranthen(30 ,50 ;4,6), (400 ,600 ;9,11)coronene
C48H20
475
340.0 (900.0)
63.0 (170.0)
...
16
...
...
25................ Dicoronylene
C48H20
480
1400.0 (640.0)
260.0 (120.0)
...
16, 17
...
...
26................ 12,13-o-phenylene1,2;3,4;5,6;7,8;9,10pentabenzo peropyrene
C48H22
447
210.0 (107.0)
40.0 (20.0)
...
16
...
...
27................ 1,14-benzo diphenanthreno(100 ,900 ;2,4), (9000 ,1000 ;11,13)bisanthene
C50H22
411
690.0b (680.0)
130.0 (130.0)
...
16
...
...
Note.—Total A is the total integrated A-value from approximately 9000 to 14500 cm�1 for molecules 1, 2, 3, 4, 5, 6, and 8–14 and from 4000 to 14500 cm�1 for PAHs 15–27. a Hirata et al. (1999). b Total value may be slightly off, major band near detector’s response limit. References.—(1) Hudgins & Allamandola 1995a; (2) Andrews et al. 1985; (3) Salama et al. 1994; (4) Bre´chignac & Pino 1999; (5) Hirata et al. 2003; (6) Hudgins et al. 2000; (7) Vala et al. 1994; (8) Weisman et al. 2003; (9) Hirata et al. 1999; (10) Hudgins & Allamandola 1997; (11) Hudgins & Allamandola 1995b; (12) Szczepanski et al. 1995a; (13) Szczepanski et al. 1995b; (14) Halasinski et al. 2000; (15) Ehrenfreund et al. 1992; (16) A. L. Mattioda, D. M. Hudgins, M. Bauschlicher, Jr., & L. J. Allamandola 2006, in preparation; (17) Ruiterkamp et al. 2002.
1199
TABLE 2 NIR Band Positions and Intensities for PAH Cations Wavelength (nm)
Wavelength (�m)
Wavenumber (cm�1)
A (103 km mol�1)
Oscillator Strength (10�3)
Comment
Molecule 1—Phenanthrene Cation 1061........................................ 900.3....................................... 880.7....................................... 858.6....................................... 838.4....................................... 820.0....................................... 790.1....................................... 762.7....................................... 757.7.......................................
1.061 0.9003 0.8807 0.8586 0.8384 0.8200 0.7901 0.7627 0.7577
9430 11110 11360 11650 11930 12200 12660 13110 13200
0.25 11 vw 2.04 0.29 vw 5.5 vw vw
0.047 2.1 vw 0.38 0.05 vw 1.03 vw vw
... Side bands 11070, 11150, 11190 vw Side bands 11610, 11730 vw vw Broad band with peaks at 12420, 12490, 12570, 12780 vw vw
Molecule 2—Fluoranthene Cation 846.7....................................... 744.0.......................................
0.8467 0.7440
11810 13440
130 12
24 2.2
Side band 12130 ...
Molecule 3—Pyrene Cation 1041........................................ 783.1.......................................
1.041 0.7831
9610 12770
12 8.1
2.2 1.5
Broad band ...
Molecule 4— Chrysene Cation 1168........................................ 1001........................................ 878.2....................................... 674.9.......................................
1.168 1.001 0.8782 0.6749
8560 9990 11390 14820
120 37 2.05 1.4
23 7.03 0.39 0.26
Shoulder 8980 ... ... ...
Molecule 5—1,2-benz[a]anthracene Cation 891.7....................................... 843.4....................................... 801.0.......................................
0.8913 0.8434 0.8010
11220 11860 12490
78 15 23
15 2.8 4.4
... ... ...
Notes.—Molecules found in this table correspond to those in Fig. 1; vw indicates very weak bands. Band positions provided in the comments column are in wavenumbers.
1200
TABLE 3 NIR Band Positions and Intensities for PAH Cations Wavelength (nm)
Wavelength (�m)
Wavenumber (cm�1)
A (103 km mol�1)
Oscillator Strength (10�3)
Comment
Molecule 6—Tetracene Cation 868.2......................................
0.8682
11520
56
10.6
840.4...................................... 821.6...................................... 816.9...................................... 801.8...................................... 774.5...................................... 765.9...................................... 759.9...................................... 745.4...................................... 730.9......................................
0.8404 0.8216 0.8169 0.8018 0.7745 0.7659 0.7599 0.7454 0.7309
11900 12170 12240 12470 12910 13060 13160 13420 13680
43 0.89 1.2 7.4 3.2 3.3 vw 13 2.4
8.03 0.17 0.22 1.4 0.60 0.62 vw 2.5 0.45
Side bands (varying strength) 11170, 11220, 11280, 11340, 11420, 11450, 11560, 11650, 11690, 11700, 11720 Side bands (varying strength) 11790, 11820, 11940 Side band 12130 ... Side bands 12330, 12370, 12440, 12510, 12570 Side bands 12730, 12800, 12950 Side bands vw ... Very broad and weak doublet with band 13810
Molecule 7—Benzo[a]fluoranthene Cation 784.7...................................... 676.9......................................
0.7847 0.6769
12740 14770
65 9.6
12 1.8
... Uncertainty in band area due to detector range
Molecule 8—Benzo[b]fluoranthene Cation 839.6...................................... 803.2...................................... 741.3......................................
0.8396 0.8032 0.7413
11910 12450 13490
56 11 11
10.6 2.1 2.2
Side bands 11860, 12070, 12180, 12240 ... ...
Molecule 9—Benzo[ j]fluoranthene Cation 1007....................................... 939.9...................................... 823.5......................................
1.007 0.9399 0.8235
9930 10640 12140
vw 24 16
vw 4.5 3.0
vw Side band 10950 ...
Molecule 10—Benzo[k]fluoranthene Cation 1051....................................... 927.7......................................
1.051 0.9277
9520 10780
410 44
77 8.2
... ...
Molecule 11—Benzo[e]pyrene Cation 917.8...................................... 879.0...................................... 820.3......................................
0.9178 0.8790 0.8203
10900 11380 12190
18 0.28 7.2
3.3 0.05 1.35
Side bands 10380, 10700, 11110 ... Side band 11670
Notes.—Molecules found in this table correspond to those in Fig. 2; vw—very weak band. Band positions provided in the comments column are in wavenumbers.
1201
TABLE 4 NIR Band Positions and Intensities for PAH Cations Wavelength (nm)
Wavelength (�m)
Wavenumber (cm�1)
A (103 km mol�1)
Oscillator Strength (10�3)
Comment
Molecule 12—Benzo[ g,h,i]perylene Cation 1052...................................... 820.3..................................... 801.1..................................... 766.1.....................................
1.052 0.8203 0.8011 0.7661
9500 12190 12480 13050
17 1.3 1.3 12
3.23 0.24 0.24 2.16
Side band 9430 ... ... Side band 13290, 13450
Molecule 13—Pentacene Cation 1119...................................... 1109...................................... 1011...................................... 985.2..................................... 954.7.....................................
1.119 1.109 1.011 0.9852 0.9547
8940 9010 9890 10150 10470
0.14 0.31 0.85 9.6 84
0.026 0.058 0.16 1.8 15.8
917.4..................................... 909.1..................................... 901.3..................................... 879.4..................................... 842.2..................................... 752.8..................................... 745.8.....................................
0.9174 0.9091 0.9013 0.8794 0.8422 0.7528 0.7458
10900 11000 11100 11370 11870 13280 13410
0.57 0.17 0.25 0.25 32 vw vw
0.11 0.032 0.047 0.047 6.0 vw vw
... ... Side bands 9920, 9950, 9990 Side bands 10040, 10100, 10130, 10180 Side bands 10280, 10300, 10330, 10350, 10400, 10440, 10500, 10560, 10610, 10650, 10670, 10740, 10760, 10820 Side bands 10850, 10880, 10930 Side band 11020 Side band 11150 ... Side band 11660, 11750, 12000, 12130 vw vw
vw vw 2.4 0.38 0.78 0.26 0.61 0.37 0.91 0.35 vw 0.08
vw vw Side bands 10457, 10486 Side bands 10660, 10700, 10730, 10760 Side bands 10820, 10930, 10960 ... Side bands Side bands 11690 Side bands 11850, 11880, 11950, 12020 ... vw ...
Molecule 14— Coronene Cation 1061...................................... 1001...................................... 960.5..................................... 936.0..................................... 918.3..................................... 894.5..................................... 875.6..................................... 861.0..................................... 834.2..................................... 801.6..................................... 791.5..................................... 783.3.....................................
1.061 1.001 0.9605 0.9360 0.9183 0.8945 0.8756 0.8610 0.8342 0.8016 0.7915 0.7833
9430 9990 10410 10680 10890 11180 11420 11620 11990 12480 12640 12770
vw vw 12 2.03 4.1 1.4 3.2 2 4.8 1.9 vw 0.44
Molecule 15—3,4;5,6;7,8-tribenzoperopyrene Cation 1539...................................... 1279...................................... 1001...................................... 863.6..................................... 826.4..................................... 787.5.....................................
1.539 1.279 1.001 0.8636 0.8264 0.7875
6500 7820 9990 11580 12100 12700
7.7 8.1 150 9.5 vw 8.6
1.4 1.5 28 1.8 vw 1.6
Shoulders 6280, 6740 Shoulder 8080 Shoulder 10240 Shoulder 11340 vw Shoulder 12990
Notes.—Molecules found in this table correspond to those in Fig. 3; vw—very weak band. Band positions provided in the comments column are in wavenumbers.
1202
TABLE 5 NIR Band Positions and Intensities for PAH Cations Wavelength (nm)
Wavelength (�m)
Wavenumber (cm�1)
A (103 km mol�1)
Oscillator Strength (10�3)
Comment
Molecule 16—3,4;5,6;7,8;12,13-tetrabenzoperopyrene Cation 2411.................................. 2232.............................. 1730.............................. 1677.............................. 1631.............................. 1582.............................. 1503.............................. 1311.............................. 1250.............................. 1200.............................. 1098.................................. 1052.................................. 1022.................................. 992.9................................. 975.2................................. 961.9................................. 919.6................................. 900.7................................. 879.4................................. 840.4................................. 785.1................................. 743.0.................................
2.411 2.232 1.730 1.677 1.631 1.582 1.503 1.311 1.250 1.200 1.098 1.052 1.022 0.9929 0.9752 0.9619 0.9196 0.9007 0.8794 0.8404 0.7851 0.7430
4150 4480 5780 5960 6130 6320 6650 7630 8000 8330 9110 9510 9780 10070 10250 10400 10870 11100 11370 11900 12740 13460
vw vw vw vw vw vw vw vw vw vw vw 170 15 4.7 0.27 0.86 11 9 1 2.8 3.9 vw
vw vw vw vw vw vw vw vw vw vw vw 31 2.9 0.89 0.051 0.16 2.02 1.7 0.19 0.53 0.73 vw
Series of weak bands going into mid-IR ... ... ... ... ... ... ... ... ... Shoulder to 9510 cm�1 band ... ... ... ... Shoulder at 10490 cm�1 Shoulders at 10741, 10700 ... ... Shoulder 11770 Side band at 12580 ...
Molecule 17—3,4;5,6;10,11;12,13-tetrabenzoperopyrene Cation 1340.................................. 1210.................................. 1108.................................. 1037.................................. 756.4................................. 705.0................................. 692.3.................................
1.340 1.210 1.108 1.037 0.7564 0.7050 0.6923
7460 8260 9030 9650 13220 14180 14440
20 60 13 8.5 vw 8.3 vw
3.8 11 2.5 1.6 vw 1.6 vw
... ... ... Shoulder 9500 vw Shoulder 140000 vw
Molecule 18—12,-13-o-phenylene-3,4;5,6;7,8-tribenzoterrylene Cation 1135.................................. 1041.................................. 978.9................................. 910.6................................. 891.8................................. 842.5................................. 794.5................................. 776.3.................................
1.135 1.041 0.9789 0.9106 0.8918 0.8425 0.7945 0.7763
8810 9600 10220 10980 11210 11870 12590 12880
4.5 130 8.8 6.3 6.8 3.8 0.39 vw
0.84 24 1.6 0.12 1.3 0.71 0.073 vw
Shoulder Shoulder Shoulder Shoulder Shoulder
9100 9870 10390, 10480 10670, 10800 11480 ... ...
vw
Molecule 19—Dipyreno-(10 ,30 ;10,2)-pyrene Cation 1301.................................. 923.3................................. 785.4, 769.3 ..................... 736.5.................................
1.301 0.9233 0.7854, 0.7693 0.7365
7690 10830 12730, 13000 13580
140 10 15 3.7
26 1.9 2.8 0.69
Shoulders 7890, 8100, 8320, 8320, 8500, 8700, 9270 ... Shoulder 12100 ...
Notes.—Molecules found in this table correspond to those in Fig. 4; vw—very weak band. Band positions provided in the comments column are in wavenumbers.
1203
TABLE 6 NIR Band Positions and Intensities for PAH Cations Wavelength (nm)
Wavelength (�m)
Wavenumber (cm�1)
A (103 km mol�1)
Oscillator Strength (10�3)
Comment
Molecule 20—1,14-benzodinaptho-(100 ,700 ;2,4),(7000 ,1000 ;11,13)-bisanthene Cation 1290...................................... 1141...................................... 1054...................................... 1008, 988.8 .......................... 875.5..................................... 837.0..................................... 761.5..................................... 683.6.....................................
1.290 1.141 1.054 1.008, 0.9888 0.8755 0.8370 0.7615 0.6836
7750 8760 9490 9920, 10110 11420 11950 13130 14630
vw vw vw 25 28 5.2 3.4 260
vw vw vw 4.6 5.2 0.98 0.63 49
vw vw vw Shoulders 9760, 10320 Shoulder 10870 ... ... Uncertainty in band area due to detector range
Molecule 21—2,3;12,13;15,16-tribenzoterrylene Cation 1251...................................... 1095, 1061 ........................... 1000...................................... 919.7..................................... 771.1.....................................
1.251 1.095, 1.061 1.000 0.9197 0.7711
8000 9140, 9430 10000 10870 12970
45 5.3 1.5 12 270
8.4 0.99 0.28 2.3 51
... ... ... ... Shoulders 11640, 12160
Molecule 22—1,18;4,5;9,10;13,14-tetrabenzoheptacene Cation 1654...................................... 1438...................................... 1079...................................... 938.6..................................... 795.1..................................... 720.9.....................................
1.654 1.438 1.079 0.9386 0.7951 0.7209
6050 6950 9270 10650 12580 13870
4.1 vw 220 16 1.3 23
0.78 vw 42 3.04 0.25 4.4
Shoulder 5740 vw Shoulders 8150, 8470 ... ... ...
Molecule 23—1,2;3,4;5,6;7,8;9,10;12,13-hexabenzoperopyrene Cation 1256...................................... 1214...................................... 1130......................................
1.256 1.214 1.130
7960 8240 8850
5.5 8.3 140
1.04 1.6 25
... Shoulder 8360 Shoulders 8700, 8740, 9030, 8260, 9440, 9630, 10470
Notes.—Molecules found in this table correspond to those in Fig. 5; vw—very weak band. Band positions provided in the comments column are in wavenumbers.
1204
TABLE 7 NIR Band Positions and Intensities for PAH Cations Wavelength (nm)
Wavelength (�m)
Wavenumber (cm�1)
A (103 km mol�1)
Oscillator Strength (10�3)
Comment
Molecule 24—Difluoranthen-(30 ,50 ;4,6),(400 ,600 ;9,11)-coronene Cation 1887.......................................... 1291.......................................... 758.1......................................... 731.7......................................... 673.7.........................................
1.887 1.291 0.7581 0.7317 0.6737
5300 7750 13190 13670 14840
vw 330 3.8 5.1 vw
vw 61 0.71 0.96 vw
vw Shoulders 6860, 8850 ... ... Uncertainty in band area due to detector range
Molecule 25—Dicoronylene Cation 1816.......................................... 1728.......................................... 1415.......................................... 1041.......................................... 828.8......................................... 801.2......................................... 789.5......................................... 694.1.........................................
1.816 1.728 1.415 1.041 0.8288 0.8012 0.7895 0.6941
5510 5790 7070 9600 12070 12480 12670 14410
0.24 0.703 21 480 5.7 2.6 0.54 870
0.045 0.13 3.9 89 1.1 0.49 0.10 160
... ... Side bands 6680, 6910, 7450, 7780 Shoulders 8710, 8870, 10970 ... ... ... ...
Molecule 26—12,13-o-phenylene-1,2;3,4;5,6;7,8;9,10-pentabenzoperopyrene Cation 1393.......................................... 1154.......................................... 1056.......................................... 905.6.........................................
1.393 1.154 1.056 0.9056
7180 86670 9470 11040
14 25 160 10
2.7 4.7 31 1.9
Shoulders 7390, 7600 ... ... Doublet with 10810
Molecule 27—1,14-benzodiphenanthreno-(100 ,900 ;2,4),(9000 ,1000 ;11,13)-bisanthene Cation 1333.......................................... 1095.......................................... 990.4......................................... 939.5......................................... 834.0......................................... 704.6.........................................
1.333 1.095 0.9904 0.9395 0.8340 0.7046
7500 9130 10100 10640 11990 14190
1.6 23 5.4 0.11 38 620
0.29 4.3 1.01 0.021 7.1 117
... ... ... vw ... Uncertainty in band area due to detector range
Notes.—Molecules found in this table correspond to those in Fig. 6; vw—very weak band. Band positions provided in the comments column are in wavenumbers.
1205
TABLE 8 NIR Band Positions and Intensities for PAH Anions Wavelength (nm)
Wavelength (�m)
A (103 km mol�1)
Wavenumber (cm�1)
Oscillator Strength (10�3)
Comment
1.8 vw vw 0.068 0.98 0.45 1.4
... ... ... ... ... ... ...
Molecule 7—Benzo[a]fluoranthene Anion 869.3....................................... 844.8....................................... 814.3....................................... 803.0....................................... 772.7....................................... 720.1....................................... 699.2.......................................
0.8693 0.8448 0.8143 0.8030 0.7727 0.7201 0.6992
11500 11840 12280 12450 12940 13890 14300
9.7 vw vw 0.36 5.2 2.4 7.6
Molecule 9—Benzo[ j]fluoranthene Anion 1077........................................ 1013........................................ 966.0....................................... 932.1....................................... 751.7.......................................
1.077 1.013 0.9660 0.9321 0.7517
9290 9870 10350 10730 13300
6.9 1.7 1.4 5 16
1.3 0.32 0.26 0.94 3.0
... ... ... Doublet with 10910 ...
Molecule 11—Benzo[e]pyrene Anion 1060........................................ 963.0....................................... 934.2....................................... 915.2....................................... 898.7....................................... 871.5.......................................
1.060 0.9630 0.9342 0.9152 0.8987 0.8715
9430 10380 10700 10930 11130 11480
0.45 0.57 1.02 1.5 0.36 0.11
0.084 0.11 0.19 0.28 0.068 0.021
Shallow shoulder 9580 ... ... Doublet 10880 ... ...
Notes.—Molecules found in this table correspond to those in Fig. 2; vw—very weak band. Band positions provided in the comments section are in wavenumbers.
TABLE 9 NIR Band Positions and Intensities for PAH Anions Wavelength (nm)
Wavelength (�m)
Wavenumber (cm�1)
A (103 km mol�1)
Oscillator Strength (10�3)
Comment
Molecule 15—3,4;5;6;7,8-tribenzoperopyrene Anion 1728........................................ 1160........................................ 713.7.......................................
1.728 1.160 0.7137
5790 8620 14010
0.77 130 0.56
0.14 24 0.11
... ... ...
Notes.—Molecules found in this table correspond to those in Fig. 3. Band positions provided in the comments column are in wavenumbers.
1206
TABLE 10 NIR Band Positions and Intensities for PAH Anions Wavelength (nm)
Wavelength (�m)
Wavenumber (cm�1)
A (103 km mol�1)
Oscillator Strength (10�3)
Comment
Molecule 16 —3,4;5,6;7,8;12-13-tetrabenzoperoprene Anion 1153........................................ 1055........................................ 982.6....................................... 866.0.......................................
1.153 1.055 0.9826 0.8660
8670 9480 10180 11550
11 5.8 0.3 2
2.1 1.1 0.056 0.38
... Significant band area remaining after cation subtraction ... ...
Molecule 17—3,4;5,6;10,11;12,13-tetrabenzoperopyene Anion 1519........................................ 1353........................................ 1052........................................ 1022........................................ 899.2....................................... 826.0.......................................
1.519 1.353 1.052 1.022 0.8992 0.8260
6580 7390 9500 9780 11120 12110
21 16 1.2 0.22 3.05 2.7
3.9 3.1 0.23 0.041 0.57 0.51
Shoulder 6810 Shoulder 7080 ... ... ... ...
Molecule 18—12,13-o-phenylene-3,4;5,6;7,8-tribenzoterrylene Anion 1120........................................ 1040........................................ 1010........................................
1.120 1.040 1.010
8930 9610 9900
56 5.8 0.63
10.5 1.1 0.12
... ... ...
Molecule 19—dipyreno-(10 ,30 ;10,2),(100 ,300 ;5,7)-pyrene Anion 1418........................................ 1285........................................ 768.4....................................... 736.7....................................... 716.8.......................................
1.418 1.285 0.7684 0.7367 0.7168
7050 7790 13010 13570 13950
14 32 1.7 1.2 15
2.6 6.0 0.32 0.23 2.8
Doublet with 7230 Trailing shoulders at 8100, 8310, 8520, 8730 ... ... ...
Notes.—Molecules found in this table correspond to those in Fig. 4; vw—very weak band. Band positions provided in the comments column are in wavenumbers.
1207
TABLE 11 NIR Band Positions and Intensities for PAH Anions Wavelength (nm)
Wavelength (�m)
Wavenumber (cm�1)
A (103 km mol�1)
Oscillator Strength (10�3)
Comment
Molecule 20—1,14-benzodinapth-(100 ,700 ;2,4),(7000 ,1000 ;11,13)-bisanthene Anion 1419.8..................................... 1245........................................ 1142........................................ 1089........................................ 1067........................................ 1048........................................ 1041........................................ 1032........................................ 1028........................................ 1010........................................ 991.1....................................... 959.7....................................... 889.6....................................... 851.2....................................... 840.2....................................... 822.4....................................... 771.8....................................... 756.1....................................... 684.8.......................................
1.420 1.245 1.142 1.089 1.067 1.048 1.041 1.032 1.028 1.010 0.9911 0.9597 0.8896 0.8512 0.8402 0.8224 0.7718 0.7561
7040 8030 8760 9180 9370 9540 9610 9690 9730 9900 10090 10420 11240 11750 11900 12160 12960 13230
0.6848
14600
1.9 45 0.401 0.5 1.1 0.37 0.15 0.017 0.62 7.4 6.4 0.204 40 2 2.4 0.24 8.4 0.32 280
0.36 8.4 0.075 0.094 0.21 0.069 0.028 0.0032 0.12 1.4 1.2 0.038 7.5 0.38 0.45 0.045 1.6 0.060 53
... Side bands 7630, 7750, 7910, 8300, 8370, 8550 ... ... ... ... ... ... ... ... ... ... ... ... Shoulder 11970 ... Shoulders 12910, 13030 ... Uncertainty in band area due to detector range
Molecule 21—2,3;12,13;15,16-tribenzoterrylene Anion 1260........................................ 1161........................................ 1094........................................ 980.6....................................... 923.4....................................... 864.2....................................... 786.2.......................................
1.260 1.161 1.094 0.9806 0.9234 0.8642
7940 8620 9140 10200 10830 11570
0.7862
12720
105 5.7 16 62 8.7 37 180
19.7 1.1 2.9 12 1.6 6.9 34
... ... ... ... ... ... ...
Molecule 22—1,18;4,5;9,10;13-14-tetrabenzoheptacene Anion 964.8.......................................
0.9648
10370
67
13
Significant band area remaining after cation subtraction
Molecule 23—1,2;3,4;5,6;7,8;9,10;12,13-hexabenzoperopyrene Anion 1151........................................ 1144........................................
1.151 1.144
8690 8740
0.25 0.26
0.047 0.049
Band area remaining after cation subtraction Band area remaining after cation subtraction
Notes.—Molecules found in this table correspond to those in Fig. 5; vw—very weak band. Band positions provided in the comments column are in wavenumbers. Although it is considered a large PAH, only the NIR (0.7–1.1 �m) data are available for molecule 22.
1208
TABLE 12 NIR Band Positions and Intensities for PAH Anions Wavelength (nm)
Wavelength (�m)
Wavenumber (cm�1)
A (103 km mol�1)
Oscillator Strength (10�3)
Comment
Molecule 24—Difluoranthene (30 ,50 ;4,6),(400 ,600 ;9,11)-coronene Anion 1797............................... 1468............................... 1313............................... 818.5.............................. 732.2..............................
1.797 1.468 1.313 0.8185
5560 6810 7620 12220
0.7322
13660
46 160 160 3.7 520
8.7 31 30.0 0.69 98
... Side band 6320 ... ... ...
Molecule 25—Dicoronylene Anion 2062............................... 1603............................... 1555............................... 1435............................... 1347............................... 1244............................... 1147............................... 1030............................... 750.4.............................. 694.0..............................
2.062 1.603 1.555 1.435 1.347 1.244 1.147 1.030 0.7504 0.6940
4850 6240 6430 6970 7420 8040 8720 9710 13330 14410
1.8 5.7 2.5 0.093 8.3 0.56 13 270 7.8 340
0.34 1.1 0.47 0.017 1.56 0.105 2.4 51 1.5 63.5
Shoulders 4790, 4750 Shoulders 5980, 6060, 6170, 6330 ... ... ... ... Side band to 9710 Side bands 8720, 10670 Shoulder to 14410 Band area remaining after cation subtraction. Includes 13330
Molecule 26—12,13-o-phenylene-1,2;3,4;5,6;7,8;9,10-pentabenzoperopyrene Anion 1757............................... 1524............................... 1417............................... 1366............................... 967.4..............................
1.757 1.524 1.417 1.366
5690 6560 7060 7320
0.9674
10340
5.2 0.22 1.04 0.11 1.01
0.98 0.041 0.20 0.021 19
... ... ... ... ...
Molecule 27—1,14-benzodiphenanthreno-(100 ,900 ;2,4),(9000 ,1000 ;11,13)-bisanthene Anion 1333............................... 1120............................... 1041............................... 902.8.............................. 737.8.............................. 677.4..............................
1.333 1.120 1.041 0.9028 0.7378 0.6774
7500 8930 9610 11080 13550 14760
73 40.1 1.9 61 486 16
14 7.5 0.36 12 91 3.0
Shoulder 7190 ... ... ... ... ...
Notes.—Molecules found in this table correspond to those in Fig. 6; vw—very weak band. Band positions provided in the comments column are in wavenumbers.
1209
1210
MATTIODA, HUDGINS, & ALLAMANDOLA
REFERENCES Aitken, D. K., & Roche, P. F. 1983, MNRAS, 202, 1233 Kjaergaard, H. G., Robinson, T. W., & Brooking, K. A. 2000, J. Phys. Chem. A, Allamandola, L. J., Greenberg, J. M., & Norman, C. A. 1979, A&A, 77, 66 104, 11297 Allamandola, L. J., Hudgins, D. M., & Sandford, S. A. 1999, ApJ, 511, L115 Lagache, G., et al. 2004, ApJS, 154, 112 Allamandola, L. J., Tielens, A. G. G. M., & Barker, J. R. 1989, ApJS, 71, 733 Li, A., & Draine, B. T. 2001, ApJ, 554, 778 Andrews, L., & Blankenship, T. A. 1981, J. Am. Chem. Soc., 103, 5977 ———. 2002, ApJ, 572, 232 Andrews, L., Friedman, R. S., & Kelsall, B. J. 1985, J. Phys. Chem., 89, 4016 Mattila, K., Lemke, D., Haikala, L. K., Laureijs, R. J., Leger, A., Lehtinen, K., Bakes, E. L. O., Tielens, A. G. G. M., & Bauschlicher, C. W. 2001, ApJ, 556, 501 Leinert, C., & Mezger, P. G. 1996, A&A, 315, L353 Bauschlicher, C. W., & Langhoff, S. R. 1997, Spectrochim. Acta A, 53, 1225 Mattioda, A. L., Allamandola, L. J., & Hudgins, D. M. 2005, ApJ, 629, 1183 Biennier, L., Salama, F., Allamandola, L. J., & Scherer, J. J. 2003, J. Chem. Mattioda, A. L., Hudgins, D. M., Bauschlicher, C. W., Jr., Rosi, M., & Phys., 118, 7863 Allamandola, L. J. 2003, J. Phys. Chem. A, 107, 1486 Birks, J. B. 1970, Photophysics of Aromatic Molecules (London: Wiley) Moutou, C., Verstraete, L., Leger, A., Sellgren, K., & Schmidt, W. 2000, A&A, Bohlin, R. C., Savage, B. D., & Drake, J. F. 1978, ApJ, 224, 132 354, L17 Bre´chignac, P., & Pino, T. 1999, A&A, 343, L49 Onaka, T., Yamamura, I., Tanabe, T., Roellig, T. L., & Yuen, L. 1996, PASJ, 48, Cox, P., & Kessler, M. F., eds. 1999, The Universe as Seen by ISO, Vol. II L59 ( ESA SP-427; Noordwijk: ESA) Oomens, J., Tielens, A. G. G. M., Sartakov, B. G., von Helden, G., & Meijer, G. Ehrenfreund, P., d’Hendecourt, L., Verstraete, L., Leger, A., Schmidt, W., & 2003, ApJ, 591, 968 Defourneau, D. 1992, A&A, 259, 257 Pech, C., Joblin, C., & Boissel, P. 2002, A&A, 388, 639 Ehrenfreund, P., Foing, B. H., d’Hendecort, L., Jenniskens, P., & Desert, F. X. Peeters, E., Hony, S., Van Kerkhoven, C., Tielens, A. G. G. M., Allamandola, 1995, A&A, 299, 213 L. J., Hudgins, D. M., & Bauschlicher, C. W. 2002, A&A, 390, 1089 Haas, M. R., Davidson, J. A., & Erickson, E. F., eds. 1995, ASP Conf. Ser. 73, Peeters, E., Spoon, H. W. W., & Tielens, A. G. G. M. 2004, ApJ, 613, 986 Airborne Astronomy Symp. on the Galactic Ecosystem: From Gas to Stars to Puget, J. L., & Leger, A. 1989, ARA&A, 27, 161 Dust (San Francisco: ASP) Roussel, H., et al. 2001, A&A, 372, 406 Halasinski, T., Hudgins, D. M., Salama, F., Allamandola, L. J., & Bally, T. Ruiterkamp, R., Halasinski, T., Salama, F., Foing, B., Allamandola, L. J., 2000, J. Phys. Chem. A, 104, 7484 Schmidt, W., & Ehrenfreund, P. 2002, A&A, 390, 1153 Hirata, S., Head-Gordon, M., Szczepanski, J., & Vala, M. 2003, J. Phys. Chem. A, Salama, F., & Allamandola, L. J. 1991, J. Chem. Phys., 94, 6964 107, 4940 Salama, F., Bakes, E., Allamandola, L. J., & Tielens, A. G. G. M. 1996, ApJ, Hirata, S., Lee, T. J., & Head-Gordon, M. 1999, J. Chem. Phys., 111, 8904 458, 621 Hoijtink, G. J. 1959, Mol. Phys., 2, 85 Salama, F., Joblin, C., & Allamandola, L. J. 1994, J. Chem. Phys., 101, 10252 Hoijtink, G. J., Velthorst, N. H., & Zandstra, P. J. 1960, Mol. Phys., 3, 533 Schutte, W. A., Tielens, A. G. G. M., & Allamandola, L. J. 1993, ApJ, 415, Hony, S., van Kerckhoven, C., Peeters, E., Tielens, A. G. G. M., Hudgins, 397 D. M., & Allamandola, L. J. 2001, A&A, 370, 1030 Shida, T., & Iwata, S. J. 1973, J. Am. Chem. Soc., 95, 3473 Hudgins, D. M., & Allamandola, L. J. 1995a, J. Phys. Chem., 99, 3033 Szczepanski, J., Banisaukas, J., Vala, M., Hirata, S., & Wiley, W. R. 2002, ———. 1995b, J. Phys. Chem., 99, 8978 J. Phys. Chem. A, 106, 6935 ———. 1997, J. Phys. Chem. A, 101, 3472 Szczepanski, J., Drawdy, J., Wehlburg, C., & Vala, M. 1995a, Chem. Phys. ———. 2004, in ASP Conf. Ser. 309, Astrophysics of Dust, ed. A. N. Witt, Lett., 245, 539 G. C. Clayton, & B. T. Draine (San Francisco: ASP), 665 Szczepanski, J., Wehlburg, C., & Vala, M. 1995b, Chem. Phys. Lett., 232, 221 Hudgins, D. M., Bauschlicher, C. W., Jr., & Allamandola, L. J. 2001, SpecUchida, K. I., Sellgren, K., & Werner, M. W. 1998, ApJ, 493, L109 trochim. Acta A, 57, 907 Uchida, K. I., Sellgren, K., Werner, M. W., & Houdashelt, M. L. 2000, ApJ, ———. 2005, ApJ, 631, in press 530, 817 Hudgins, D. M., Bauschlicher, C. W., Jr., Allamandola, L. J., & Fetzer, J. C. Vala, M., Szczepanski, J., Pauzat, F., Parisel, O., Talbi, D., & Ellinger, Y. 1994, 2000, J. Phys. Chem. A, 104, 3655 J. Phys. Chem., 98, 9187 Hudgins, D. M., & Sandford, S. A. 1998, J. Phys. Chem., 102, 329 van Kerckhoven, C., et al. 2000, A&A, 357, 1013 Kasha, M. 1948, J. Opt. Soc. Am., 38, 1068 Verstraete, L., et al. 2001, A&A, 372, 981 Kim, H., & Saykally, R. J. 2002, ApJS, 143, 455 Weisman, J. L., Lee, T. J. Salama, F., & Head-Gordon, M. 2003, ApJ, 587, 256