Eur. J. Mineral. 2003, 15, 937–951
Experimental study of the microtextural and structural transformations of carbonaceous materials under pressure and temperature ¨ ROUZAUD3 OLIVIER BEYSSAC 1,*, FABRICE BRUNET1, JEAN-PIERRE PETITET2, BRUNO GOFFE´ 1 and JEAN-NOEL 1
Laboratoire de G´eologie, CNRS UMR 8538, Ecole Normale Sup´erieure, 24 rue Lhomond, F-75231 Paris Cedex 5, France * presently at Service Photons Atomes Mol´ecules, CEA Saclay, France Corresponding author, e-mail:
[email protected] 2 Laboratoire d’Ing´ enierie des Mat´eriaux et des Hautes Pressions, Av. JB Cl´ement, F-93430 Villetaneuse, France 3 Centre de Recherche sur la Mati` ere Divis´ee, UMR 6619, 1b rue de la F´erollerie, F-45071 Orl´eans Cedex 2, France
Abstract: A coal and two reference synthetic-cokes, a lamellar graphitizing anthracene-based coke (AC) and a microporous nongraphitizing saccharose-based coke (SC), were held at pressures up to 8 GPa and temperatures up to 1473 K under dry and hydrous conditions. Their subsequent structural and microtextural modifications were characterized by high-resolution transmission electron microscopy (HRTEM) and Raman spectroscopy (microspectroscopy and area-mode spectroscopy). No significant transformation was observed in products held up to 95 hours at temperatures below 1273 K. At 1273 K and above, for constant run duration, the higher the pressure, the better is the carbonaceous material organization. The effect of pressure on the graphitization mechanisms is most obvious in the case of the non-graphitizing SC for which the main role of pressure is to transform the microporous microtexture towards a lamellar one. Graphitization is initiated in pore walls as a result of pore growth and thus appears as a local phenomenon. Triperiodic graphite was detected by HRTEM in all SC samples synthesized at 2 GPa and above (1273 K, 95 hours). In the case of the AC material, microtexture remains lamellar and the graphitization results in the reorientation and the in-plane growth of the aromatic layers and rather appears as a bulk phenomenon. The evolution of the coal is intermediate between the two synthetic cokes, as this precursor was microtexturally heterogeneous, composed of an intermediate microtexture between lamellar and microporous ones. Graphitization under pressure appears to be a progressive and continuous process that proceeds heterogeneously through the carbonaceous matrix. The products recovered from high-pressure experiments are structurally and microtexturally heterogeneous, and this heterogeneity raises important problems with respect to the characterization scale and transformation rate in the experimental products. Indeed, in comparison to graphitization temperature in natural samples, it is expected that longer run duration would have led to triperiodic graphite under most experimental conditions achieved here. However, our experimental results show that pressure mainly speeds up the graphitization process, or even makes it possible in the case of the SC, by inducing microtextural and subsequent structural transformations. In all cases, whatever the pressure, temperature defines the highest structural state. Key-words: graphitization, HP-HT experiments, HRTEM, Raman spectroscopy, carbonaceous materials.
Introduction Carbonaceous materials (CM) are widespread in terrestrial and extraterrestrial rocks and exhibit a large variety of structures and microtextures, from amorphous-like CM up to perfectly crystallized graphite or diamond. This structural diversity is of particular interest for metamorphic petrology because the CM degree of organization is directly related to metamorphic grade. Reitmeijer & McKinnon (1985) and Beyssac et al. (2002a) have demonstrated that the CM organization, when characterized by X-ray diffraction (XRD) or Raman microspectroscopy, respectively, can be used as a reliable geothermometer. Because of the irreversible character of CM transformations, this geothermometer indicates the true peak of metamorphic conditions. DOI: 10.1127/0935-1221/2003/0015-0937
Whatever the origin of solid CM, synthetic or natural, the organization of disordered CM can be defined according to two criteria: their structure and their microtexture (Oberlin, 1989). This distinction results from a multi-scale organization. At the atomic scale, disordered CM are made of polyaromatic layers of nanometric extension. These layers can either be isolated or stacked to form coherent domains. Generally, the characterization of disordered CM is based on the dimensions of these domains (i.e. layer size and stacking extension) and their organization within the CM. This is directly due to the fact that these coherent domains can diffract X-rays or electrons and can therefore be characterized using conventional diffraction techniques. The spatial distribution of these coherent domains defines the CM microtexture which can be imaged using TEM (Oberlin, 1989). 0935-1221/03/0015-0937 $ 6.75
2003 E. Schweizerbart’sche Verlagsbuchhandlung, D-70176 Stuttgart
938
O. Beyssac, F. Brunet, J.-P. Petitet, B. Goff´e, J.-N. Rouzaud
Accordingly, different precursors can display the same structure (e.g. identical XRD pattern) but can differ from their microtexture or texture. The graphitization of disordered CM acts on both structure and microtexture since it implies (1) a structural evolution towards domains of graphite-like ABAB stacking sequence and (2) a microtextural re-organization towards the ABAB stacking sequence of graphite. The combination of TEM and Raman spectroscopy has been proven to offer a powerful tool to fully characterize this multiscale organization (e.g. Beyssac et al., 2002b). In regional metamorphism, all types of organic precursors are partially transformed into graphite at ca. 773 K, and totally at ca. 923 K. By contrast, in industrial processes, synthesis of graphite at ambient pressure requires a graphitizing precursor (lamellar precursor) and a temperature above 3000 K. As a consequence, although it is generally admitted that natural graphitization is mainly controlled by temperature (T), parameters like pressure (P), process duration (t) and CM precursor type must also play a role. Nevertheless, the respective influence of those parameters is not yet precisely assessed. The aim of this study is to better constrain the respective effect of quasi-hydrostatic pressure and temperature on the transformation of two reference synthetic cokes and a coal. Compared to natural processes, the advantage of laboratory experiments is that these two parameters can be decoupled. Two cokes (an anthracene- and a saccharose-based coke) have been selected because they are microtexturally homogeneous and because their structural and microtextural organizations are similar to those of natural CM (Beyssac et al., 2002b). The experimental products have been systematically characterized using XRD, HRTEM and Raman spectroscopy.
Experimental study of graphitization under pressure: previous studies The graphitization process has been mainly studied under the effect of temperature at atmospheric pressure (see Rouzaud & Oberlin, 1989 and Oberlin, 1989 for review). Two types of CM can be distinguished from their microtexture and behaviour under thermal treatment at atmospheric pressure. Graphitizing CM are characterized by a lamellar microtexture and are transformed into graphite at 3000 K. On the other hand, non-graphitizing CM exhibit a microporous microtexture and remain microporous and turbostratic even at 3000 K. However, it is possible to obtain intermediate microtextures by modifying the content of cross-linking atoms (oxygen and sulfur) in the starting material: a continuous series of porous carbons with increasing pore diameter and therefore graphitizing character can then be obtained (Oberlin, 1989). The role of the microtexture on the ability of CM to graphitize is thus fundamental. In this context, natural CM are more or less graphitizing, depending on the origin of the organic precursor. Concerning the graphitization under pressure, the pioneer works of Noda & Kato (1965) and Kamiya et al. (1973) have shown using XRD, that graphite can be obtained from a typically non-graphitizing glassy carbon at 2773 K and 1 GPa within a few minutes. Nevertheless, the authors con-
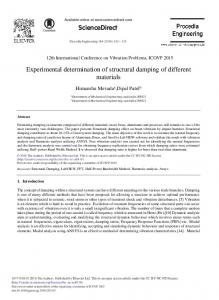
Fig. 1. HRTEM images and SAED patterns of the two synthetic starting materials. a – 002 lattice fringes image and SAED pattern of the anthracene-based coke. b – 002 lattice fringes image and SAED pattern of the saccharose-based coke.
cluded that pressure in their experiments was not strictly hydrostatic and that local shear stress should have enhanced graphitization by inducing frictions at the micro-grains boundaries. Later, Inagaki et al. (1977) and De Fonton et al. (1980) have described the presence of triperiodic graphite using HRTEM in a glassy carbon submitted to 1973 K and 0.5 GPa of quasi-hydrostatic pressure. These authors have shown that the graphitization of the starting microporous glassy carbon is made possible by the transformation of this material, above 1373 K, into an intermediate thermally stable carbon phase which is texturally macroporous. They interpreted this intermediate stage as a new carbon phase because the different transitions between the starting microporous material, the macroporous stage and graphite appeared as discontinuous. More recently, Bustin and coworkers (Ross & Bustin, 1990; Bustin et al., 1995) have studied the graphitization process of a natural anthracite and a bituminous coke under pressure with or without adding a shear component. They concluded that (1) because of the bulk anisotropy of the starting material, the hydrostatic pressure imparts some strain energy which promotes additional microtextural organization that temperature alone is unable to produce, (2) this strain energy results in the coalescence of pore walls, and thus in a brutal increase of the coherent domains extension both along and perpendicularly to the c axis as it is observed in the coaxial tests, and (3) in simple shear experiments, high shear-strain results in the rotation of small coherent domains and in the rupture of pore walls and subsequent formation of graphitic lamellae.
Experimental strategy Choice and characteristics of the starting material Graphitization is considered as a non reversible process. At ambient pressure, the final state of this process strongly depends on the microtexture of the starting material (Oberlin, 1989; Rouzaud & Oberlin, 1989). It is important to under-
Experimental study of graphitization under pressure
line that in the previous studies cited above, the starting materials, natural or not, are described as chemically, structurally and microtexturally heterogeneous. As this heterogeneity can be a decisive parameter for both the initiation and the propagation of graphitization, we rather decided to select two homogeneous synthetic cokes of well-defined structure and microtexture. Identical experiments were also performed on a coal for a better comparison with previous studies and with natural graphitization. The anthracene-based coke (AC) and the saccharosebased coke (SC) have been synthesized by the Groupe Fran¸cais d’Etude des Carbones (GFEC) and are reference homogeneous cokes. For instance, the transformation of these cokes under the effect of temperature at ambient pressure has been studied by B´eny-Bassez & Rouzaud (1985) and Rouzaud & Oberlin (1989) by both Raman spectroscopy and HRTEM. The AC was obtained by pyrolysis of anthracene (C14H10) at 723 K after 1 hour under a 0.2 MPa argon pressure. The 002 lattice fringes (002LF) image of the obtained coke is depicted in Fig. 1a. The atomic H/C ratio in the coke is ca. 0.41. The aromatic layers are a few nm long and the mutual orientation of these layers defines a typical lamellar microtexture with a preferential orientation as shown by the 00l arcs in the SAED pattern. As demonstrated by Rouzaud & Oberlin (1989), such a coke is graphitizing and graphite can be obtained by thermal treatment above 3000 K. The SC was obtained by pyrolysis of saccharose (C12H22O11) at 1273 K after 1 hour. Fig. 1b shows a 002LF image of the starting SC. The atomic H/C ratio in the coke is ca. 0.15 and the O/C ratio is ca. 0.04. Again the aromatic layers are a few nm long, but the random mutual orientation of these layers defines a microporous microtexture. The layers are randomly oriented and consequently there is no enhancement of the 00l reflections and continuous rings are observed in the SAED pattern. Such a non-graphitizing coke remains microporous and turbostratic, even at 3000 K, as shown by the lack of hkl reflections (Rouzaud & Oberlin, 1989). The coal selected for this study was sampled in the lower stephanian productive level (–590m, Mine Ricard) of the C´evennes coal basin (France). This coal is a low rank anthracite with optical parameters RMIN 1 and RMAX » 3. Compared to the two synthetic cokes, this coal is chemically, structurally and microtexturally heterogeneous. The atomic H/C ratio is ca. 0.44, the atomic O/C ratio is ca. 0.02 and the atomic N/C ratio is ca. 0.11. Sample container The starting material was encapsulated in platinum or gold tubes of 1.8 or 3 mm outer diameter, welded shut. Platinum was preferred because of its high melting point and because it allows a contact between sample and Pt-Pt90Rh10 thermocouple. Prior to piston-cylinder experiments, the capsules were stamped axially in a 2 or 3 mm die to increase the assembly density and to minimize the thermal gradient along the sample. Most experiments were performed under anhydrous conditions. However, in a few cases, hydrothermal
939
conditions were obtained by adding deionised water in the capsule. High-pressure devices In most experiments, the three starting materials were run together, i.e. under strictly identical conditions. Experiments at atmospheric pressure were performed in an air boxfurnace (HTT). The temperature was monitored by two Btype thermocouples. Experiments below 0.95 GPa were carried out in an internally heated pressure-vessel (IHPV, Edinburgh-type). The vessel is positioned horizontally and argon is used as pressure transmitting medium. Temperature was monitored by two Pt-Pt90Rh10 thermocouples with junctions separated by about 1 cm. The temperature difference between the two thermocouples junctions was systematically comprised between 10 and 30 K at 1273 K. The samples (about 5 mm long) were disposed between the thermocouples junctions or even in contact to them. The temperature is estimated to be accurate to 2%. The argon pressure was measured at the entrance of the vessel by a factory-calibrated electronic-gauge. At the end of experiment, samples were cooled down at a rate of about 100 K/min after switching off the furnace power. Experiments at higher pressure were conducted in an end-loaded piston-cylinder apparatus (PC). Talc-pyrexbased assemblies with MgO as pressure medium (assembly A, graphite furnace, ¾ inch diameter) were used as well as low-friction NaCl-based assemblies (assembly B, graphite furnace, ½ inch diameter). The pressure calibration of the A-assembly was performed at 1273 K on the farringtonite – Mg3(PO4)2-II transition (Brunet & Vielzeuf, 1996) and a correction by –25% on the nominal pressure was required for this latter assembly. In the following, we will only report corrected pressure values. The assembly B and corresponding calibrations are described in Brunet et al. (2003). A single experiment was performed at 8 GPa using the multi-anvil apparatus (MA) at Clermont-Ferrand (France) with the setup described in Schmidt et al. (2001).
Characterization methods The recovered products were crushed a few minutes by hand in an agate mortar for further characterization. This kind of mechanical treatment is considered to have no destructive effect on the CM structure (Salver-Disma et al., 1999). Raman spectroscopy was directly performed on the sample products. No polished section was made out of these samples since polishing can induce severe damages to the CM structure (Pasteris, 1989; Beyssac et al., 2003). High-resolution transmission electron microscopy (HRTEM) A few milligrams of the CM were dispersed by ultrasound in anhydrous ethanol. A drop of this suspension was then deposited on a TEM grid covered by a holey amorphous car-
940
O. Beyssac, F. Brunet, J.-P. Petitet, B. Goff´e, J.-N. Rouzaud
Table 1: Experimental conditions and Raman parameters (R2 ratio) obtained using microspectroscopy (most [MTF] and least [LTF] transformed fraction of CM) and area-mode spectroscopy (bulk). See text for abbreviations concerning HP devices. Starting material R2 ratio P (GPa)
T (K)
duration HP (h) device anthracen-based coke (AC) ambient 1273 95 0.1 1273 95 0.5 1273 5 0.5 1273 30 0.5 1273 95 0.5 1273 240 0.5 1273 580 1 1273 95 1 1473 95 2 873 95 2 1073 95 2 1273 95 3.5 1273 95 8 1273 16 0.42 1373 95 0.42 1373 95 2 1273 95 saccharose-basedcoke (SC)
HTT IHPV IHPV IHPV IHPV IHPV IHPV PC ass.A PC ass.A PC ass.B PC ass.B PC ass.B PC ass.B MA IHPV IHPV PC ass.A
ambient 0.1 0.5 0.5 0.5 0.5 0.5 1 1 2 2 2 3.5 8 0.42 0.42 2 coal
1273 1273 1273 1273 1273 1273 1273 1273 1473 873 1073 1273 1273 1273 1373 1373 1273
95 95 5 30 95 240 580 95 95 95 95 95 95 16 95 95 95
HTT IHPV IHPV IHPV IHPV IHPV IHPV PC ass.A PC ass.A PC ass.B PC ass.B PC ass.B PC ass.B MA IHPV IHPV PC ass.A
ambient 0.1 0.5 0.5 0.5 0.5 1 1 2 2 3.5
1273 1273 1273 1273 1273 1273 1273 1473 873 1273 1273
95 95 5 95 240 580 95 95 95 95 95
HTT IHPV IHPV IHPV IHPV IHPV PC ass.A PC ass.A PC ass.B PC ass.B PC ass.B
bon film. Observations were carried out on the thinnest fragments placed across the holes. Holey grids were used to reduce the background noise due to the carbon supporting film. HRTEM investigations were performed using a Philips
water
MTF (micro-)
LTF (micro-)
bulk (area mode) mean
stv
+ +
0.63 0.54 0.53 0.47 0.37 0.32 0.35 0.31 0.15 0.68 0.62 0.29 0.31 0.22 0.20 0.17 0.28
0.74 0.63 0.66 0.60 0.65 0.68 0.64 0.65 0.42 0.75 0.74 0.64 0.43 0.46 0.61 0.60 0.53
0.54 0.58 0.59 0.57 0.55 0.56 0.46 0.48 0.28 0.67 0.67 0.45 0.37 0.36 0.49 0.47
0.03 0.04 0.02 0.04 0.05 0.03 0.06 0.02 0.03 0.01 0.01 0.02 0.01 0.05 0.02 0.04
0.78 0.76 0.75 0.73 0.72 0.75 0.69 0.73 0.69 0.77 0.77 0.73 0.73 0.46 0.72 0.72 0.51
0.68 0.66 0.70
0.01 0.02 0.02
+ +
0.71 0.4 0.66 0.47 0.35 0.38 0.21 0.34 0.38 0.70 0.67 0.11 0.27 0.22 0.44 0.17 0.07
0.65 0.66 0.57 0.69 0.65 0.68 0.72 0.70 0.67 0.56 0.62 0.47
0.02 0.03 0.03 0.01 0.02 0.01 0.02 0.01 0.01 0.01 0.01 0.04
0.68 0.60 0.45 0.24 0.25 0.27 0.23 0.17 0.63 0.28 0.19
0.81 0.75 0.75 0.73 0.72 0.73 0.71 0.36 0.74 0.70 0.51
0.65 0.65 0.68 0.65 0.62 0.64 0.66 0.28 0.61 0.62 0.40
0.02 0.01 0.03 0.03 0.02 0.02 0.01 0.03 0.01 0.01 0.02
CM20 transmission electron microscope working at 200 kV with a 0.144 nm resolution in lattice fringes. We used bright field (BF) and dark field (DF) low-magnification modes, 002 lattice fringes (002LF) high-resolution mode and selected-area electron diffraction (SAED). Rouzaud & Ober-
Experimental study of graphitization under pressure
941
Fig. 2. Evolution of the 002 reflection profile (XRD) with experimental conditions. a – Anthracene-based coke. b – Saccharosebased coke.
lin (1989) and Oberlin (1989) have made an extensive review of these different techniques and their applicability to the study of CM. Raman spectroscopy The Raman spectroscopy investigations were performed directly on sample powders deposited on a glass slide. The eventual effect of orientation between the CM structure and the incident laser beam is discussed by Beyssac et al. (2003). Raman microspectroscopy was performed with a Dilor XY double subtractive spectrograph with premonochromator, equipped with confocal optics before the spectrometer entrance, and a nitrogen-cooled SPECTRUM1 CCD detector. A microscope is used to focus the excitation laser beam (514.5 nm exciting line of a Spectra Physics Ar+ laser) on the sample and to collect the Raman signal in the backscattered direction. The presence of the confocal pinhole before the spectrometer entrance ensures a sampling of a 2-4 µm diameter area with 50 × objective with a final laser power of about 1-5 mW on the sample. Acquisition time was 20-300s and 15-20 spectra were recorded on each sample. Moreover, for each sample, about 15 to 20 additional reconnaissance spectra have been acquired (spectrometer live mode) but not recorded. To obtain a large spot analysis, we used also the Raman area-mode spectroscopy manufactured by Jobin Yvon SA.
A microscope is used to focus the excitation laser beam (532 nm exciting line of a Nd-YAG laser) on the sample and to collect the Raman signal in the backscattered direction. This method consists of passing the laser beam into an optical fiber before it enters the microscope optics. It is then possible to obtain a beam with a homogeneous energy distribution on a large surface, the beam diameter depending on both the optical fiber diameter and the objective magnification. With a fiber diameter of 100 µm and 50× magnification used in this study, the analyzed surface reaches 40-µm diameter and the laser power is about 1-5 mW onto the sample. A conventional Jobin Yvon LabRam spectrometer is used. The main advantages of this system are (1) to analyze large sampled area in a short time and (2) to achieve a homogeneous distribution of the laser energy on the sampled area (Beyssac et al., 2003). The Raman spectrum of CM can be divided in first- and second-order regions (Tuinstra & Koenig, 1970; Nemanich & Solin, 1979). In the first-order region (1100-1800 cm-1), the E2g2 vibration mode of graphite with D6h4 crystal symmetry occurs at ca. 1580 cm-1 (G band). For poorly organized CM, additional bands appear in the first-order region around 1150, 1350, 1500 and 1620 cm-1. The 1350 cm-1 band (D1 band) is commonly called the defect band. Its characteristics (i.e. integrated area, FWHM, intensity) when compared to those of the G band allow one to quantify the graphitization process (Tuinstra & Koenig, 1970; Lespade et al., 1984; B´eny-Bassez & Rouzaud, 1985; Wopenka & Pasteris, 1993; Beyssac et al., 2003). Both the 1150 and 1500 cm-1 bands
942
O. Beyssac, F. Brunet, J.-P. Petitet, B. Goff´e, J.-N. Rouzaud
b
a
D1
G
G
D1
D2 D2 1273 K, 580 h, 0.5 GPa
1273 K, 95 h, 3.5 GPa
D3
D3 1273 K, 95 h, P ambient
1100
1500
Raman shift (cm-1 )
1900
1100
1500
Raman shift (cm-1 )
1900
Fig. 3. First-order region of selected Raman spectra obtained by Raman area-mode spectroscopy at various experimental conditions. The dotted line indicates the position of G band for pristine graphite (1580 cm-1). a – Anthracene-based coke. b – Saccharose-based coke.
appear only in very poorly organized CM, but their significance is still debated. Last, the 1620 cm-1 band (D2 band) forms a shoulder on the G band. In perfect graphite, this component is absent while in very poorly organized CM, the two bands cannot be resolved and then a single broad band occurs at around 1600 cm-1. The second-order region (~ 2200-3400 cm-1) shows several features about 2400, 2700, 2900 and 3300 cm-1, attributed to overtone or combination scattering (Nemanich & Solin, 1979). The most visible one, near 2700 cm-1 (S1 band), splits into two bands in well crystallized graphite. According to Lespade et al. (1984), this splitting occurs when CM acquires a triperiodic organization. With respect to the second-order region, we will focus on the 2700-2900 cm-1 region to trace the development of the triperiodic order, i.e. the appearance of graphite stricto sensu. In order to quantify the CM degree of organization in our products, spectra were decomposed with a sum of Voigt functions using the Picfit software (Jandel scientific). Different parameters are then calculated: D1/G peak height (intensity) ratio (R1 ratio), D1/(G+D1+D2) peak area ratio (R2 ratio). The different R2 ratio parameters obtained by both microspectroscopy and area-mode spectroscopy are presented in Table 1 with the corresponding experimental conditions. More details concerning the fitting procedure are given by Beyssac et al. (2003). X-ray diffraction (XRD) XRD patterns were acquired on an INEL diffractometer (CoK radiation) equipped with a CPS 120 detector. Silicon (NBS standard) pattern is used to convert channels into diffraction angle (2 ). XRD analyses were performed on sample powder using an oriented silicon monocrystal slide as sample holder to enhance the signal/background ratio.
Fig. 4. Results of decomposition of Raman spectra obtained by Raman area-mode spectroscopy with increasing pressure (1273 K, 95 h) for the three precursors.a – R1 ratio (D1/G peak height ratio). b – R2 ratio (D1/[G+D1+D2] peak area ratio). c – G band position.
Results At a temperature below 1273 K, we did not observe any significant transformation of the different precursors, except for the coal. Consequently, only the results obtained at 1273 K and above are presented here. First, the results of the anhydrous experiments are presented and then, a paragraph is dedicated to the description of the hydrothermal experiments. In all experiments under pressure, the products are strongly structurally and microtexturally heterogeneous at both the HRTEM and Raman microspectroscopy scales of observation (i.e. from the nm to the µm scale). There is always a wide and continuous range of transformation degree
Experimental study of graphitization under pressure
within a single sample from almost no transformation up to graphite in some instances. These characterization techniques, however, do not allow a quantification of the proportion of the different fractions. Therefore, for each sample, we decided to emphasize (1) Raman spectra corresponding to both least and most transformed fractions (called LTF and MTF, respectively, in the following) and (2) HRTEM images showing the general mechanism of transformation of those materials.
0.8
R2 ratio
0.6
0.4
AC SC coal
0.2
Anthracene-based coke
0 0
943
200
400
600
run duration (h) Fig. 5. Evolution of the R2 ratio (D1/[G+D1+D2] peak area ratio) obtained by Raman area-mode spectroscopy as a function of experiment duration (1273 K, 0.5 GPa) for the three precursors.
The profile of the 002 reflection from a selection of representative XRD patterns obtained at various experimental conditions is depicted in Fig. 2a. The 002 reflection narrows with increasing synthesis pressure and/or run duration. In G
a D1
S1
D2
1273 K, 580 h, 0.5 GPa
S2
1273 K, 5 h, 3.5 GPa
1273 K, 95 h, 0.5 GPa
1273 K, 5 h, 0.5 GPa 1273 K, 95 h, P atm. raw AC
1050
1250
1450
1650
Raman shift (cm -1 )
1850
2550
2750
2950
Raman shift (cm -1 )
3150
G S1
b
D1
D2
1273 K, 580 h, 0.5 GPa
S2
1273 K, 5 h, 3.5 GPa
1273 K, 95 h, 0.5 GPa
Fig. 6. First- and corresponding second-order regions of selected Raman spectra obtained by Raman microspectroscopy at various experimental conditions after quench. The dotted line indicates the position of G band for pristine graphite (1580 cm-1). a – Anthracene-based coke. b – Saccharose-based coke.
1273 K, 5 h, 0.5 GPa 1273 K, 95 h, P atm. raw SC
1050
1250
1450
1650
Raman shift (cm -1 )
1850
2550
2750
2950
Raman shift (cm -1 )
3150
944
O. Beyssac, F. Brunet, J.-P. Petitet, B. Goff´e, J.-N. Rouzaud
a
0.8
LTF
R2 ratio
0.6 0.4
MTF
0.2 0
0
1
2
3
4
AC SC coal
P (GPa)
Fig. 7. Evolution of the R2 ratio (D1/[G+D1+D2] peak area ratio) obtained by Raman microspectroscopy with increasing pressure (1273 K, 95 h) for the least and most transformed fractions (LTF and MTF, respectively) of the three precursors.
10 nm
b
0.8
LTF
R2 ratio
0.6
0.4
MTF 0.2
0
0
200
400
run duration (h)
600
AC SC coal
Fig. 8. Evolution of the R2 ratio (D1/[G+D1+D2] peak area ratio) obtained by Raman microspectroscopy as a function of experiment duration (1273 K, 0.5 GPa) for the least and most transformed fractions (LTF and MTF, respectively) of the three precursors.
addition, the d002 interlayer spacing decreases from about 3.55 Å down to 3.45 Å (3.35 Å for pristine graphite). In the run at 8 GPa (1273 K, 16 h) and 1473 K (1 GPa, 95 h), graphite is obtained as confirmed by the modulation of the 11. band. The spectra obtained by Raman area-mode spectroscopy with the AC under various experimental conditions are displayed in Fig. 3a. As already indicated by the XRD data, there is a significant improvement of the CM organization with increasing pressure and/or run duration as confirmed by (1) the narrowing and shifting of the G band towards the graphite value (1580 cm-1), (2) the strong decrease of both the D1 and D2 bands, and (3) the disappearance of the D3 band. This evolution is consistent with the evolution of both R1 and R2 ratios which decrease from 0.83 and 0.54 at ambient pressure, down to 0.45 and 0.37, respectively, at 3.5 GPa (1273 K, 95 h) as shown in Fig. 4a and 4b. This decrease is confirmed by the R1 and R2 values obtained from the experiment at 8 GPa (1273 K, 16 h) which are 0.36 and 0.35 respectively. At ambient pressure and 0.1 GPa (1273 K, 95 h), a broad band occurs at around 1600 cm-1 and it is not possible to resolve the two G and D2 bands (Fig. 4c). With increasing pressure, this broad band splits into two bands, among them the G band shifts down to the graphite value of 1580 cm-1. At constant temperature (1273 K) and pressure (0.5 GPa), the R2 ratio smoothly decreases as a linear function of the run duration (Fig. 5). A selection of first-order and second-order spectra obtained under various conditions with the AC using Raman
10 nm
c
10 nm
Fig. 9. HRTEM images showing the progressive transformation of the anthracene-based coke during graphitization. a – 002 lattice fringes image (1273 K, ambient P, 95 h): short aromatic layers, small number of stacked layers. b – 002 lattice fringes image (1273 K, 1 GPa, 95 h): increase of the number of stacked layers and diameter of coherentdomains. c – 002 lattice fringes image (1273 K, 3.5 GPa, 95 h): large coherent domains but the aromatic layers remain distorted.
microspectroscopy is shown in Fig. 6a. They correspond to the MTF of the considered sample. The displayed spectrum of the run product at ambient pressure (1273 K, 95 h) shows (1) a broad “G” band at around 1600 cm-1 which includes both G band s.s. and D2 band, as well as (2) a large D1 band and a very wide D3 band. With increasing pressure and/or run duration (1273 K), the “G” band splits into the G band s.s. and the D2 band. The G band shifts from 1590-1595 down to 1580 cm-1 and becomes narrower while the intensity of the two D1 and D2 bands decreases. Along this evolution, the D3 band disappears at the early stages of the graph-
Experimental study of graphitization under pressure
945
a 004 10 002
a
b 112
10 nm
110 b
004 101 100
c
002
d
Fig. 10. Evolution of the SAED pattern of the anthracene-based coke with increasing degree of organization. a – 1273 K, ambient P, 95 h. b – 1273 K, 0.5 GPa, 95 h. c – 1273 K, 1 GPa, 95 h. d – 1273 K, 0.5 GPa, 580 h.
itization. In the second-order region, the ambient pressure product (1273 K, 95 h) exhibits a spectrum with two broad bands at ca. 2700 cm-1 and 2900 cm-1. With increasing pressure and/or run duration, the S1 band intensity increases with respect to that of S2. The presence of the triperiodic order can be detected by the splitting of the S1 band in the samples obtained at pressure higher than 2 GPa (1273 K, 95 h) as well as in the longest duration experiment (1273 K, 0.5 GPa, 580 h). At higher temperature (1473 K, 1 GPa, 95 h), almost perfect graphite with a very faint D1 band is detected by Raman microspectroscopy. On Fig. 7, the evolution of the R2 ratio versus pressure at 1273 K (95 h) is shown for both LTF and MTF. The R2 ratio of the former is nearly constant around 0.6-0.7 and starts to decrease down to 0.43 at 3.5 GPa, whereas the R2 ratio of the latter decreases progressively from 0.63 down to 0.31 at 3.5 GPa. Fig. 8 shows the evolution of the R2 ratio for the LTF and the MTF as a function of run duration at 1273 K and 0.5 GPa. For the LTF, the R2 ratio is nearly constant around 0.6-0.7, whereas for the MTF this ratio slowly decreases from 0.53 down to 0.35 for the longest experiment (580 h). With respect to TEM characterization, Fig. 9 shows a selection of 002LF images showing the evolution of the AC with increasing pressure at 1273 K and a run duration of 95 h. At atmospheric pressure (Fig. 9a), the CM is structurally homogeneous: the length of the aromatic layers does not exceed 10 nm, the number of stacked layers is lower than 10 and the coherent domains are short. With increasing pressure, structural heterogeneity progresses and is accompanied by an increase of the length of aromatic layers, of the number of stacked layers and therefore of the diameter of the coherent domains. Fig. 9b shows an intermediate stage
10 nm
c
10 nm
Fig. 11. HRTEM images of progressive transformation of the saccharose-basedcoke during graphitization.a – 002 lattice fringes image (1273 K, ambient P, 95 h): microporous CM poorly transformed. b – 002 lattice fringes image (1273 K, 0.1 GPa, 95 h): microporous to mesoporous CM with thin walls. c – 002 lattice fringes image (1273 K, 1 GPa, 95 h): mesoporous CM with thick walls.
obtained at 1 GPa where both length and number of stacked layers have increased by comparison with the atmospheric pressure experiment. Before the triperiodic structure is reached, the coke contains coherent domains of several tens of nm length but the aromatic layers are still slightly wrinkled, as illustrated on Fig. 9c (3.5 GPa run). The corresponding evolution of the SAED patterns is shown in Fig. 10. At 1 bar, the hk reflections are large due to the small diameter of the coherent domains (Fig. 10a). Moreover, the presence of arcs on the 00l reflections is a consequence of the preferential planar orientation of the layers, i.e. of the lamellar microtexture. With increasing pressure, the lamellar microtexture remains, but the hk bands become thinner when the di-
946
O. Beyssac, F. Brunet, J.-P. Petitet, B. Goff´e, J.-N. Rouzaud
10 nm
a
b
c
100 nm 100 nm
ameter of the coherent domains increases (Fig. 10b). Both the appearance of the hk bands punctuation and the modulations of the 11. bands (110 and 112 reflections) indicate the presence of graphite micro-crystallites in the run products at pressure higher than 1 GPa (Fig. 10c). A similar evolution is observed in the series of runs performed at constant temperature (1273 K) and pressure (0.5 GPa) with variable run durations. In the longest experiment, the product is still largely heterogeneous but, locally, graphite crystallites are found. In the various experiments performed at 1273 K, graphite crystallites are found at pressure higher than 1 GPa for the 95 h run duration or at pressure as low as 0.5 GPa in the longest experiment (580 h). The presence of single crystals with diameter larger than 1 µm (diameter of the aperture used for SAED) was detected in the runs performed at pressures higher than 2 GPa as well as in the longest one (1273 K, 0.5 GPa, 580 h – Fig. 10d). Additionally, it should be noticed that the AC is largely transformed into graphite at 8 GPa (1273 K, 16 h) and 1473 K (1 GPa, 95 h).
Fig. 12. Transition from the mesoporous to the macroporous microtextures in the saccharose-based coke. a – 002 lattice fringes image (1273 K, 2 GPa, 95 h): brutal transition. b – Bright-field low magnification image showing a diffuse transition within the porous material (1273 K, 0.5 GPa, 95 h). c – 002 dark-field image correspondingto Fig. 12b.
Saccharose-based coke XRD data (002 reflection) for the SC are displayed in Fig. 2b. The 002 reflection is a composite of overlapping peaks and becomes narrower towards high-pressure and/or longer run duration as already outlined for the AC. However, in the case of the SC, this reflection remains relatively large and the d002 is systematically larger than 3.55 Å. Only in the case of the 8 GPa experiment (1273 K, 16 h), the product exhibits a typical XRD pattern of well ordered material (d002 = 3.45 Å), which is not graphite as demonstrated by the absence of modulation of the 11. band. With respect to Raman area-mode spectroscopy, the evolution observed with the SC is similar to that described for the AC, although less significant (Fig. 3b). At constant temperature (1273 K) and duration of experiment (95 h), the R1 ratio increases from 1.07 at ambient pressure up to 2.71 at 3.5 GPa (Fig. 4a) whereas the R2 ratio is nearly constant around 0.6-0.7 (Fig. 4b). The intensity increase of the D1 band is compensated by a decrease of the band-width (Fig.
Experimental study of graphitization under pressure
b
a
Fig. 13. HRTEM images of progressive transformation of the saccharose-based coke during graphitization. a – 002 lattice fringes image (1273 K, 0.1 GPa, 95 h): macroporous phase with thin walls. b – 002 lattice fringes image (1273 K, 1 GPa, 95 h): macroporous phase with thick walls.
10 nm
002
947
10 nm
004 002
10
110
11 Fig. 14. Evolution of the SAED pattern of the saccharose-based coke with increasing degree of organization.a – 1273 K, ambient P, 95 h. b – 1273 K, 0.5 GPa, 95 h. c – 1273 K, 1 GPa, 95 h.
101 100
a
3b). At higher pressure (i.e. 8 GPa, 1273 K, 16 h), both R1 and R2 ratios decrease down to 1.03 and 0.56, respectively. The G band remains centered around 1590 cm-1 at 1273 K (95 h) whatever the pressure, except in the material obtained at atmospheric pressure in which the G band is located at around 1600 cm-1 because it includes both G and D2 bands (Fig. 4c). As for the AC, at 1273 K and 0.5 GPa, the R2 ratio decreases linearly with run duration (Fig. 5). The visual inspection of selected MTF spectra (Fig. 6b) obtained by Raman microspectroscopy reveals a similar evolution to that described above for the AC. With increasing pressure (1273 K, 95 h), the LTF has a constant R2 ratio (~0.7-0.8) whereas the R2 ratio of the MTF reaches a nearly constant value around 0.2-0.4 from 0.5 GPa to 3.5 GPa (Fig. 7). When the run duration increases (1273 K, 0.5 GPa), the LTF is also characterized by a constant R2 ratio (~ 0.7-0.8) whereas the R2 ratio of the MTF progressively decreases down to 0.21 for the longest experiment (1273 K, 0.5 GPa, 580 h) as shown in Fig. 8. TEM results are shown in Fig. 11 for various synthesis pressures (1273 K, 95 h). The product synthesized at atmospheric pressure is relatively homogeneous, with micropo-
b
112
c
rous microtexture with short aromatic layers of a few nm extent and with less than five stacked layers (Fig. 11a). Under pressure, the diameter of the pores increases. The micropores are first transformed into mesopores with diameters up to 10 nm. On the pore walls, the length and the number of stacked layers increase up to ~10 nm and 10 layers, respectively (Fig. 11b and 11c). The transformation of the mesopores into macropores is really significant at 0.5 GPa and above. This transformation can either appear as localized (Fig. 12a) or more diffuse within the material (Fig. 12b and 12c). The diameters of the macropores are generally of several tens of nm (Fig. 13a and 13b). On the pore walls, the aromatic layers are consequently several hundreds nm long but they remain generally wrinkled. The number of stacked layers varies from 5 to 10 at 0.1 GPa (Fig. 13a) and reaches up to several tens of layers at higher pressure (Fig. 13b). The final stage consists in the rupture of the pore walls with production of graphitic lamellae. This rupture occurs along weak zones like pore edges (Fig. 13b) and induces the final stiffening of the aromatic layers. The structural analyses obtained by SAED are presented on Fig. 14. The SAED pattern of the turbostratic microporous
948
O. Beyssac, F. Brunet, J.-P. Petitet, B. Goff´e, J.-N. Rouzaud
Hydrothermal experiments
10 nm
Fig. 15. HRTEM image (002 lattice fringes) showing the microtextural organization of the coal (1273 K, 0.5 GPa, 95 h).
material synthesized at ambient pressure exhibits diffuse hk rings which correspond to randomly oriented short coherent domains (Fig. 14a). As a consequence of the SC microtextural evolution described above, the hk bands become thinner during the mesoporous stage due to the diameter increase of the coherent domains (Fig. 14b). The modulation of the 11. band shows that the macroporous stage is partially graphitized. The punctuation of the hk bands is related to the growth of the coherent domains (Fig. 14c). In the highest pressure products, triperiodic graphite occurs locally. In the series of runs performed at 1273 K and 0.5 GPa, the rate of macropore production increases with increasing run duration. The longest run (580 h) yielded a product which remains, however, largely heterogeneous. The disruption of the pore wall is not observed in these samples. Coal This precursor is strongly heterogeneous and three types of microtextures can be distinguished during graphitization: lamellar, microporous and an intermediate microtexture between these two (Fig. 15). Below 1273 K, the starting material is progressively transformed into a coke (carbonization stage). At 1273 K, the transformation of both lamellar and porous fractions as a response to pressure and/or run duration increase, appears similar to the transformation described above for the AC and SC, and is therefore not illustrated here. The Raman spectra obtained by microspectroscopy and area-mode spectroscopy on the coal display features similar to those described for the AC and SC. In the case of Raman microspectroscopy, the quantitative evolution of the R2 ratio versus pressure (1273 K, 95 h) and run duration (1273 K, 0.5 GPa) is very similar to that observed for the AC as illustrated in Fig. 7 and Fig. 8, respectively. The parameters retrieved from the area-mode spectra indicate that (1) at low pressure the R1 ratio increases from 0.99 (ambient pressure) up to 2.62 (1 GPa) whereas the R2 ratio is constant between 0.6 and 0.7 and (2) at higher pressure, both R1 and R2 ratio decrease down to 0.51 and 0.40, respectively (Fig. 4).
These experiments were performed with the two synthetic precursors (AC and SC). For the AC, the Raman area-mode spectra are similar to those obtained for products recovered from anhydrous experiments performed under the same conditions. For instance at 1373 K and 0.42 GPa (95 h), the R2 ratio amounts to 0.47 for the hydrothermal experiment whereas it is around 0.49 for the synthesis under anhydrous conditions. In both cases, the LTF exhibits a R2 ratio close to 0.6 whereas the R2 ratio of the MTF amounts to around 0.2, as determined by Raman microspectroscopy. The areamode spectra of the SC transformed hydrothermally, systematically indicate higher degree of organization than spectra of SC obtained under dry conditions. For example, at 1373 K and 0.42 GPa (95 h), the R2 ratio reaches 0.47 when the run is performed under wet conditions whereas R2 equals 0.62 when the synthesis is carried out under dry conditions. The R2 ratios obtained by Raman microspectroscopy for the hydrothermal and anhydrous LTF are similar, around 0.7, and are slightly different for the MTF, around 0.2 and 0.4, respectively. The TEM investigation of the two products seems to show that the LTF is relatively less abundant in the product recovered from the hydrothermal experiment. For both precursors, these observations are confirmed by the experiments performed at 1273 K and 2 GPa (95 h).
Discussion One of the challenges with disordered CM is to define and measure the relevant parameters that reliably describe their structural organization. In this respect, Raman spectroscopy appears as a powerful method to quantify local (microspectroscopy) or bulk (area-mode) structural order, the former being also imaged by TEM. Moreover, repeated Raman microspectroscopy measurements offer a way to quantify structural heterogeneity, e.g. through the spread of the D1/(G+D1+D2) bands area ratio (R2 ratio). Such information is difficult to attain, if not impossible, using X-ray powder diffraction because of the large analyzed sample volume. A prominent result of this experimental study is the strong structural heterogeneity acquired at the micrometer scale by the perfectly structurally homogenous SC and AC starting materials during experiments under pressure. In addition, a strong textural heterogeneity is developed in the SC although it was (as the AC) initially microtexturally homogeneous. This strong structural heterogeneity is a major hindrance to bulk structural characterization by means of Raman microspectroscopy or HRTEM and it has motivated the use of Raman area-mode spectroscopy in this study. In order to characterize the structural order of CM, we strongly recommend, especially in case of synthetic CM samples, to record several Raman spectra within the same sample. The spread of the R2 ratio is then an indication of structural heterogeneity and provides an additional parameter to describe the graphitization process. AC exhibits a lamellar microtexture and is graphitizing whereas microporous precursors which are poorly micro-
Experimental study of graphitization under pressure
textured, are only graphitizing under pressure. This suggests that pressure helps at texturing CM in order to allow the structural transformation and thus enhances the graphitization process. The AC graphitization at atmospheric pressure proceeds in two steps. First, the number of short stacked layers along the c axis increases to form distorted columns. Then, the coalescence of these stacked layers produces large wrinkled layers (Rouzaud & Oberlin, 1989). Our TEM investigation shows that the transformation of the AC starting material under pressure is slightly different, because the first stage consists into an increase of the length of the aromatic layers with a subsequent increase of the coherent domains. We did not observe the systematic formation of distorted columns in poorly organized CM. The degree of transformation of the bulk AC as quantified by Raman area-mode spectroscopy is found to increase with pressure. At a smaller scale (Raman microspectroscopy data), the transformation degree of the LTF increases with pressure in the same manner and converges towards the bulk value. The evolution of the MTF shows that fairly well-organized domains with R2 ratios below 0.4 are achieved as soon as pressures above 0.5 GPa are applied. However, above 0.5 GPa, increasing pressure does not significantly decrease R2 which seems to approach asymptotically the 0.3 value. Therefore, in the case of the AC, at a given temperature and run duration (1273 K, 95 h), the increase of the run pressure does not lead to significant changes in the graphitization process, but rather enhances the nucleation of coherent domains (R2 = 0.4 to 0.3) within the whole material. As already mentioned, compare to AC, the graphitization of the microporous SC starting material implies a gross microtextural re-organization. Our HRTEM investigations on the SC samples indicate that graphitization is (1) restricted to small patches diluted in an apparently poorly transformed microporous matrix and (2) is characterized by an evolution towards a macroporous microtexture by pore-wall thickening and dewrinkling as already observed by De Fonton et al. (1980). An ultimate graphitization stage in these patches, is the rupture of the pore walls which produces graphite lamellae. It should be noted that this local textural modification is continuous and graphitization of the SC should not be considered as a succession of microporous-to-macroporous and macroporous-to-graphite phase transitions as proposed by De Fonton et al. (1980). The R2 values between 0.65 and 0.7, obtained for all samples using Raman area-mode spectroscopy seem to indicate that the SC transformation is more or less insensitive to synthesis pressure, although the increase of R1 ratio and sharpening of D1 band suggest a concentration of the type of structural defects. The transformed fraction identified by HRTEM in experiments performed at pressures of 0.5 GPa and above, and which contains graphite lamellae in some instances, is characterized by low R2 values (R2 < 0.4) using Raman microspectroscopy. Most part of the SC run products, however, displays a high R2 (around 0.7) close to the bulk value. Therefore, as already suggested by the HRTEM data, although significant, graphitization of the SC under pressures up to 3.5 GPa remains marginal at 1273 K (95 h) and appears as a local phenomenon. On the only basis of the R2 ratio, synthesis pressure is
949
found to have a positive effect on the structural organization of the MTF but has little effect on the bulk organization of the SC material. However, a higher synthesis pressure (1273 K, 8 GPa, 16 h) has led to transformed SC with bulk R2 as low as 0.56. This experiment emphasizes that synthesis pressure must also play a role in the case of the SC, but very high-pressures are required in order to lead to significant structural and textural changes at 1273 K in the range of run duration investigated here. Due to the strong anisotropy of the graphite structure, one may think that oriented pressures should be more efficient than hydrostatic ones at producing graphite (e.g. Bustin et al., 1995). Therefore, when graphite is produced in highpressure experiments the hydrostatic character of the pressure is generally questioned (Kamyia et al., 1973; Inagaki et al., 1977). In our experiments, the use of argon as pressure transmitting medium or NaCl-based pressure-cells at a temperature of 1273 K (i.e. close to the NaCl melting temperature) ensures quasi-hydrostatic pressure conditions onto the sample. Local stresses at the CM grain boundary can always be invoked to account for the initiation of graphitization. This is definitely not the case for the AC where graphitization is a bulk phenomenon and where the enhancement of the coherent domains nucleation can be interpreted as a direct effect of synthesis hydrostatic pressure. This is confirmed by the very similar behaviour of AC during both anhydrous and hydrothermal experiments. The role of pressure is more questionable for the SC material where graphitization is strongly localized. Characterization of the SC run products under hydrothermal conditions shows that (1) graphitization has occurred as in the water-free experiment carried out under the same conditions and (2) the bulk transformation of the SC starting material is even more pronounced when water is added. The second point may be explained by a water-enhanced preferential gasification of the smallest domains which are characterized by a higher density of accessible aromatic-layers edges at the “coherent domains” boundaries (Rouzaud et al., 1991). Anyway, graphitization due to non-hydrostatic pressure and to local stress at the grain boundary can be ruled out on the basis of these water-bearing experiments. Once graphitization is initiated in the SC, the pressure may act through the mechanical contrast between coherent domains and surrounding matrix and, could therefore drive locally pore thickening and dewrinkling in order to form patches of transformed material. According to that scheme, in the case of the AC, high-pressures will favor the nucleation rate whereas in the case of SC, synthesis pressure rather favors the graphitization propagation. From the textural point of view, AC (lamellar) and SC (microporous) can be seen as two CM end-members. In comparison, natural CM like the coal starting material is texturally intermediate since it is partly lamellar and partly microporous (Beyssac et al., 2002b). The microtextural evolution of the coal is thus more difficult to describe. The HRTEM investigations show that it behaves as an intermediate between the two synthetic cokes, the lamellar and porous fractions following the same transformations as those described for the AC and SC respectively. The evolution of the LTF degree of organization in the coal is similar to that
950
O. Beyssac, F. Brunet, J.-P. Petitet, B. Goff´e, J.-N. Rouzaud
3000 K, Patm.
precursor
R2 graphite
T, P
Metastable state
laboratory
nature
a
1273 K
precursor
Patm.
R2 graphite
f(T)
No natural equivalent
P1
b
3000 K, Patm.
laboratory
time
?
P2 > P1
nature
? time
Fig. 16. Schematic representation of the respective influences of pressure and temperature with time on CM degree of organization (R2 ratio) from the comparison between laboratory and natural graphitization data. a – Case of a non-graphitizing carbon (saccharose-based coke or coal). Experiments:At ambient-P, the degree of organizationis poorly modified whatever the temperature. Under pressure and temperature, non-graphitizing carbon becomes graphitizing at least locally. Pressure, temperature and time promote graphitization. Nature: depending on temperature, CM is transformed into graphite or an intermediate metastable state. The CM degree of organization is thus controlled by temperature. b – Case of a graphitizing carbon (anthracene-based coke). Experiments: At ambient-P, graphitizationkinetics is a function of temperature. Under pressure and temperature, graphitization is promoted by pressure for a given temperature.Nature: No equivalentof graphitizing carbon is known in nature.
of the SC at low pressure with equivalent values of the R2 ratio. At higher pressure, as in the case of the AC, the R2 ratio decreases due to a transformation of this fraction of CM. The R2 ratio of the MTF reaches at low pressure a value which remains more or less constant with increasing pressure and thus shows a general trend similar to that of the corresponding fractions of the AC and SC. The evolution of the bulk degree of organization of the coal shows that it is similar to that of the SC at low pressure whereas it tends towards that of the AC at higher pressure. During the formation of the macropores at low pressure, the general organization of the coal is similar to that of the SC as seen by Raman spectroscopy. At higher pressure, the lamellar fraction within the coal is sufficiently organized to contribute significantly to the Raman spectra, obtained by Raman microspectroscopy as area-mode spectroscopy. Therefore, we suggest that the presence of a lamellar fraction in the CM can promote the graphitization of the porous fraction by creating a preferential orientation within the material. This experimental study demonstrates the positive effect of pressure on graphitization. Actually, numerous studies show that natural graphitization is controlled by temperature but not pressure. As a matter of fact, CM organization
can be used as a reliable indicator of the true peak-metamorphism temperature (irrespective of the metamorphic pressure). Difference in the graphitization mechanisms cannot be invoked to account for this apparent discrepancy between experimental and natural data. The general graphitization mechanisms described in this study resembles those reported in natural samples (e.g. Buseck & Huang, 1985; Beyssac et al., 2002b). The synthetic products described here are significantly more heterogeneous than the natural ones. Obviously, any natural CM formed at 1273 K (our run temperature) is expected to reach the triperiodic graphite state. This strong heterogeneity may merely reflect that experimental run durations were too short for the CM to transform sufficiently in order to reach the stable (or metastable) degree of organization found in natural CM formed at the same temperature. This is corroborated by the series of experiments that we performed at 0.5 GPa and 1273 K which show a linear correlation between the bulk degree of organization and the duration of experiment. Lastly, on the basis of our experimental results and with the input from natural CM, we can propose a simple scheme that would account for the respective effect of pressure and temperature on the graphitization process (Fig. 16). Graphitization is an irreversible process and the CM transformation will therefore depend upon its initial microtexture. In order to take this textural parameter into account, CM are divided into graphitizing and non-graphitizing in Fig. 16. In the case of non-graphitizing precursors like natural CM, we have shown that the effect of pressure is to allow the required microtextural and subsequent structural transformation in order for the precursor to evolve towards the graphite structure. Then, as shown by natural data, the temperature defines the highest structural state that the CM will reach, which is not necessarily the graphite state (Fig. 16a). We have used the R2 ratio as a measure of this structural state. One should bear in mind that CM geothermometry is based on the one-to-one relation between structural state (R2 ratio) and temperature. For graphitizing precursors which are, actually, only known as synthetic material, the apparent role of hydrostatic pressure is to speed up the graphitization process (Fig. 16b). Pressure seems therefore to have a kinetic effect on graphitization through its ability to drive microtextural transformation, by inducing a densification of the CM. This effect of pressure may have interesting applications (1) to industrial processes with the possibility of producing graphite at lower temperature than usually done, and (2) to the study of “low-temperature” natural graphitization on the basis of laboratory experiments. Acknowledgements: This work was supported by the CNRS – programme Mat´eriaux (projet 114) and by the INSU – programme G´eomat´eriaux. We would like to thank Philippe Gillet for access to the Raman microspectroscopy facilities (Instrument National INSU – ENS Lyon), Max Schmidt for access to the multi-anvil apparatus and for his assistance (Instrument National INSU – OPGC ClermontFerrand), and Jobin Yvon SA (Myriam Moreau and Emmanuel Froigneux) for free access to the Raman area-mode spectroscopy technique. We warmly thank T. Cacciaguera,
Experimental study of graphitization under pressure
J. Cassareuil, N. Catel, G. Marolleau, C. Clinard and G. Montagnac for their help. Useful comments by Alain Baronnet, Jean Dubessy and an anonymous reviewer are greatly acknowledged.
References B´eny-Bassez, C. & Rouzaud, J. N. (1985): Characterization of carbonaceous materials by correlated electron and optical microscopy and Raman microspectroscopy. In Scanning electron microscopy, 119-132, SEM Inc, AMF O’Hare, Chicago. Beyssac, O., Goff´e, B., Chopin, C., Rouzaud, J.N. (2002a): Raman spectrum of carbonaceousmaterial in metasediments: a new geothermometer. J. Metamorphic Geol., 20, 859-871. Beyssac, O., Rouzaud, J.N., Goff´e, B., Brunet, F., Chopin, C. (2002b): Graphitization in high-pressure,low-temperaturemetamorphic gradient: a HRTEM and Raman microspectroscopy study. Contrib. Mineral. Petrol., 143, 19-31. Beyssac, O., Goff´e, B., Petitet, J.P., Froigneux,E., Moreau, M., Rouzaud, J.N. (2003): On the characterization of disordered and heterogeneous carbonaceous materials using Raman spectroscopy. Spectrochimica Acta A, 59, 2267-2276. Brunet, F. & Vielzeuf, D. (1996): The farringtonite/Mg3(PO4)2-II transformation; a new curve for pressure calibration in pistoncylinder apparatus. Eur. J. Mineral., 8, 349-354. Brunet, F., Bagdassarov, N., Miletich, R. (2003): Na3Al2(PO4)3, a fast sodium-conductor at high-pressure.In-situ impedence spectroscopy characterisation and phase diagram up to 8 GPa. Solid State Ionics, 159, 35-47. Buseck, P. R. & Huang, B.-J. (1985): Conversion of carbonaceous material to graphite during metamorphism. Geochim. Cosmochim. Acta, 49, 2003-2016. Bustin, M., Rouzaud, J. N., Ross, J. V. (1995): Natural Graphization of Anthracite: Experimental Considerations. Carbon, 33, 679691. De Fonton, S., Oberlin, A., Inagaki, M. (1980): Characterization by electron microscopy of carbon phases (intermediate turbostratic phase and graphite) in hard carbons when heat-treated under pressure. J. Material Sci., 15, 909-917. Inagaki, M., Oberlin, A., de Fonton, S. (1977): Texture change in hard carbon on heat treatment under pressure. High Temperature – High Pressure, 9, 453-460. Kamiya, K., Inagaki, M., Noda, T. (1973): Oriented heterogeneous
951
graphitization of carbons under high pressure. High Temperatures – High Pressures, 5, 331-338. Lespade, P., Marchand, A., Couzi, M., Cruege, F. (1984): Caract´erisation de mat´eriaux carbon´es par microspectroscopie Raman. Carbon, 22, 375-385. Nemanich, R.J. & Solin, S.A. (1979): First- and second-order Raman scattering from finite-size crystals of graphite.Physical Rev. B, 20, 392-401. Noda, T. & Kato, H. (1965): Heat treatment of carbon under high pressure. Carbon, 3, 289-297. Oberlin, A. (1989): High-Resolution TEM studies of carbonization and Graphitization. In Chemistry and Physics of carbon, Vol. 22, Thrower, P.A., ed., pp. 143. Pasteris, J. D. (1989): In situ analysis in geological thin-sections by Laser Raman micropobe microspectroscopy: A cautionary note. Applied Spectroscopy, 43, 567-570. Rietmeijer, F.J.M. & Mackinnon, I.D.R. (1985): Poorly graphitized carbon as a new cosmothermometer for primitive extraterrestrial materials. Nature, 316, 733-736. Ross, J. V. & Bustin, R. M. (1990): The role of strain energy in creep graphitization of anthracite. Nature, 343, 58-60. Rouzaud, J. N. & Oberlin, A. (1989): Structure, microtexture, and optical properties of anthracene and saccharose-based carbons. Carbon, 27, 517-529. Rouzaud, J. N., Duval, B., Leroy, J. (1991): Coke microtexture: a key for coke reactivity. In Fundamental Issues in Control of Carbon Gasification Reactivity, Lahaye, J. & Ehrburger, P., eds., Kluwer Academic Publisher, 257-268. Salver-Disma, F., Tarascon, J. M., Clinard, C., Rouzaud, J. N. (1999): Transmission electron microscopy studies on carbon materials prepared by mechanical milling. Carbon, 37, 1941-1959. Schmidt, M.W., Dugagni, M., Artioli, G. (2001): Synthesis and characterizationof white micas in the join muscovite-aluminoceladonite. Am. Mineral., 86, 555-565. Tuinstra, F. & Koenig, J. L. (1970): Raman spectrum of graphite. J. Chem. Phys., 53, 1126-1130. Wopenka, B. & Pasteris, J. D. (1993): Structural characterization of kerogens to granulite-facies graphite: Applicability of Raman microprobe spectroscopy.Am. Mineral., 78, 533-557.
Received 11 October 2002 Modified version received 5 May 2003 Accepted 13 June 2003