David O. Caplan, Gregory S. Kanter, Prem Kumar, Optics Letters, 21, 1342 (1996). 16. M. Sheik-Bahae, A. A. Said, D. J. Hagan, M. J. Soileau, E. W. Van Stryland, ...
Experimental Zscan Measurements Using GaussianBessel Beams Marcela M. Méndez Otero, Maximino L. Arroyo Carrasco, Marcelo D. Iturbe Castillo, Gregorio C. Martínez Jiménez, and Fernando Rodríguez García Citation: AIP Conf. Proc. 992, 559 (2008); doi: 10.1063/1.2926927 View online: http://dx.doi.org/10.1063/1.2926927 View Table of Contents: http://proceedings.aip.org/dbt/dbt.jsp?KEY=APCPCS&Volume=992&Issue=1 Published by the American Institute of Physics.
Related Articles Active terahertz quantum-cascade composite right/left-handed metamaterial Appl. Phys. Lett. 102, 021103 (2013) An experimental acoustic cloak for generating virtual images J. Appl. Phys. 113, 024911 (2013) An apparatus for studying scintillator properties at high isostatic pressures Rev. Sci. Instrum. 84, 015109 (2013) Ultrafast manipulation of near field coupling between bright and dark modes in terahertz metamaterial Appl. Phys. Lett. 102, 011122 (2013) High performance La/B4C multilayer mirrors with barrier layers for the next generation lithography Appl. Phys. Lett. 102, 011602 (2013)
Additional information on AIP Conf. Proc. Journal Homepage: http://proceedings.aip.org/ Journal Information: http://proceedings.aip.org/about/about_the_proceedings Top downloads: http://proceedings.aip.org/dbt/most_downloaded.jsp?KEY=APCPCS Information for Authors: http://proceedings.aip.org/authors/information_for_authors
Downloaded 16 Jan 2013 to 200.23.5.162. Redistribution subject to AIP license or copyright; see http://proceedings.aip.org/about/rights_permissions
Experimental Z-scan Measurements Using Gaussian-Bessel Beams Marcela M. Méndez Otero*, Maximino L. Arroyo Carrasco*, Marcelo D. Iturbe Castillo۞, Gregorio C. Martínez Jiménez* and Fernando Rodríguez García*. ۞
*Facultad de Ciencias Físico Matemáticas, BUAP, C.P. 72000 Puebla, Pue., México. Instituto !acional de Astrofísica, Óptica y Electrónica, Apartado postal 51 y 216, Puebla 72000, Pue., México
Abstract. Z-scan technique is a simple and widely used experimental method to measure the nonlinear refractive index of optical materials. Typically a longitudinal scan of the sample to test around the waist of a Gaussian beam is performed and the transmitted optical power is measured, in far field condition through a small aperture by a photodiode, as function of the position. Several modifications to the Z-scan technique have been proposed to increase its sensitivity [1-3]. One of these papers suggests theoretically the gradual transformation of the Gaussian beam to Bessel-Gauss beam [3] to increase the sensitivity by a factor of 40. In this work we present experimental results of Z-scan measurements using a focused Gaussian beam from a cw He-Ne in combination with an axicon to obtain a Bessel-Gauss beam to implement the z-scan technique. The results obtained show an increasing in the amplitude of the curve when is compared with the conventional Z-scan results for this type of samples.
I�TRODUCTIO� The search of new kind of nonlinear materials is nowadays a continuous challenge in photonics science and technology, in doing so the improvement of characterization methods of optical properties is vital. To characterize the light and matter interaction of nonlinear optical materials there exists a broad kind of experimental techniques like; nonlinear interferometry [4], three and four wave mixing [5,6], elliptic rotation [7], measurements of wave front distortions [8], Z-scan technique [9], etc. Z- scan technique is a successful method to measure the nonlinear refractive index change of a variety of nonlinear materials. Since it was proposed [10] and implemented in optics [11], it has suffered many modifications in order to increase its sensitivity and permit the characterization of a broad kind of materials. Z-scan technique is based on the fact that spatial light intensity distributions in a Gaussian beam produce a refractive index change in a nonlinear material, through which it is transmitted, inducing a lens like behavior of the material. The induced lens causes a focusing effect of the transmitted beam in a positive nonlinear material, or a defocusing effect in a negative nonlinear material. The transmitted light is measured in far field approximation through on axes small constant aperture, while the nonlinear material is scanned in the beam’s propagation direction Z, around the beam’s waist Z=0 position. The curve of transmitted intensity versus Z position, known as Z-scan trace, permits to evaluate the sign and magnitude of the index change. If the Z-scan trace has first a peak and then a valley the index change is negative, if it has a valley and then a peak the index change is positive. Several modifications have been proposed to improve the Z-scan technique like ecliptic Z-scan [12], top-hat beam Z-scan [13], two-color Z-scan [14], time-resolved Z-scan [15], thick Z-scan [16], etc. S. Hughes and J.M. Burzler [3] proposed to modify the Z-scan technique making use of Gaussian-Bessel beams; they performed a theoretical analysis of it and predicted an increase of the Z-scan sensitivity by a factor of 40 respects to the standard technique. In this work we prove experimentally this theoretical proposal in liquid media, organic dyes dissolve in isopropyl alcohol, we present experimental results of Z-scan with Gaussian beam and Bessel-Gauss beam for metilen blue, crystal ON violet and malachite green using an He:Ne laser as CREDIT LINE (BELOW) TO BE INSERTED THE FIRST PAGE OF EACH PAPER light source. In order to generate theEXCEPT Bessel-Gauss beam we used a lens and an axicon. THE PAPER ON PP. 507 - 512 CP992, RIAO/OPTILAS 2007, edited by N. U. Wetter and J. Frejlich © 2008 American Institute of Physics 978-0-7354-0511-0/08/$23.00
559 CREDIT LINE (BELOW) TO BE INSERTED ONLY ON THE FIRST PAGE OF THE PAPER ON PP. 507 - 512 Downloaded 16 Jan 2013 to 200.23.5.162. Redistribution subject to AIP license or copyright; see http://proceedings.aip.org/about/rights_permissions
THEORY The refractive index n of any transparent media, changes in function of the incident intensity of the electromagnetic field, which is given by (1) n = n0 ± ∆n . Where n0 is the linear and ∆n is the non linear part of the refractive index depending of the incident field on the media. For a Kerr media type, the refraction index, satisfy next equation: 2 n = n0 ± n2 E / 2 . (2) Here, n2 is the non linear refractive index and E the electric field incident on the media, generally it is a Gaussian beam given by: w r2 ikr 2 (3) E (r , z , t ) = E0 (t ) 0 exp(− 2 − ) exp(−iφ ( z , t )) . w(z ) w ( z ) 2 R( z ) Where w0 is the minimum Gaussian beam radius and r is the transverse coordinate along of the propagation direction of the beam, w2(Z) is the beam radius, R(z) is the curvature radius of the wavefront in Z, k is the wave vector and exp(-iφ) represents the beam phase variation. The transmitted intensity through the medium in every position of the sample is registered with a power meter in the far field, and with these results the Z-scan curve is obtained. The sign and magnitude of the nonlinearity are obtained through the Z-scan curve. A pre-focal transmittance maximum (peak) followed by a post focal minimum (valley) in the Z-scan curve is characteristic of a negative nonlinearity, in the opposite case (valley and peak) we have a positive nonlinear refraction. Using the difference between the peak and valley amplitudes [∆Τp,v] the magnitude of the type non linear Kerr (n2) can be obtained by:
n2 =
[ ∆T p , v ] . 1 − exp(−α d ) 0.406 [kI 0 ]
(4)
α
k=2π/λ is the wave number, d is the thick media, α is the optical coefficient absorption of the medium and I0 is the maximal intensity of the incident light. On the other hand, for a liquid the refractive index is generated by the incident intensity on it, where this change is generated by a thermal effect, this means that a thermal lens is generated inside the medium. This thermal lens is characterized by a focal length given by: π K w2 FTh = . Pabs (∂n ∂T ) (5) Here K, is the thermal conductivity of the liquid, w is the beam radius in the sample, (∂n/∂T) is the derivative of the liquid refractive index on temperature, Pabs is the total light power absorbed by the sample, where
Pabs = Pin (1 − e −α d ).
Here Pin is the incident laser power. The Gaussian beam radius transmitted by this thermal lens is described by:
(6)
2
π w0 Fth2 1 = . 2 2 2 w ( Z ) λZ Z 0 + ( Fth − Z )
(7)
In the Gaussian approximation the shape output of the beam, 1/w2(Z) is proportional to the light power detected by the photodiode at the output plane of the Z-scan system. On the other hand, a Bessel-Gauss beam has an electric field given by:
E(r, z) = A
w0 exp{i[(k − β 2 / 2k)z − Φ(z)]} J 0 [ βr /(1 + iz / L)] w(z)
exp{[−1/ w 2 (z) + ik / 2R(z)](r 2 + β 2 z 2 / k 2 )} .
560
Downloaded 16 Jan 2013 to 200.23.5.162. Redistribution subject to AIP license or copyright; see http://proceedings.aip.org/about/rights_permissions
(8)
Here, A is field amplitude, r denotes the distance from the Z axis, β is the length of the component, orthogonal to the Z axis, of any wave vector belonging to one of the plane waves producing the beam, L is the so-called Rayleigh distance (L=kw02/2) and w, Φ, R are Gauss beam parameters. The profile of central spot of this beam is lightly differently from that of a Gaussian beam. Here also n2 is obtained through the variation of the transmittance [∆Τp,v] of the Z-scan curves. So, the Z-scan curves generated with a Gauss and Bessel-Gauss beam are studied in this work
EXPERIME�TAL SETUP The diagram of Z-scan setup with a Gaussian laser beam used in this work is shown in figure 1. The light source was a He-Ne laser with λ = 633 nm and 10 mW of output power. A convex lens with 3.5 cm of focal length was used to generate a waist beam of 28 µm. The output signal was detected by a power meter located at 1.2 m from the lens, in front of the detector aperture was a circular iris of 2 mm of diameter. The Z-scan displacements were made with an automatic mechanical mount, in one position the measurement was repeated 10 times and the value on the graphs is an average of these. Since the nonlinear media was liquid it was collocated in a quartz cell of 1 mm thick. Organic dyes dissolve in isopropyl alcohol; ethylene blue with a linear absorption coefficient of α = 0.95 cm-1, crystal violet with α = 1.00 cm-1 y malachite green with α= 1.07 cm-1, were the nonlinear media.
Figure 1. Z-scan setup with a Gaussian beam. Source He:Ne laser of 10 mW of output power, λ = 633 nm. Lens of 3.5 cm focal length. Aperture of 2 mm diameter. Lens-power meter distance of 1.2 m. Liquid nonlinear media in a quartz cell of 1 mm thick.
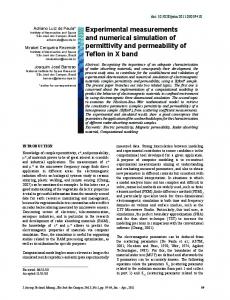
In order to modify the setup with a Bessel-Gauss beam it was collocated an axicon, 1 cm after a lens of focal length of 5 cm, as is shown in figure 2. The axicon has 1 inch of diameter, refractive index of 1.5 and an angle of 0.5°. The image of the central spot light, in its waist, generated with this setup is shown in figure 3. Diameter of the central spot Bessel-Gauss beam 35 µm. The nonlinear media used in both cases were the same.
Figure 2. Z-scan setup with a Bessel-Gauss beam. Axicon of 0.5°, d = 1 cm. Lens with 5 cm of focal length. Other parameters as in figure 1.
561
Downloaded 16 Jan 2013 to 200.23.5.162. Redistribution subject to AIP license or copyright; see http://proceedings.aip.org/about/rights_permissions
Figure 3. Image of the central spot Bessel-Gauss beam generated with the setup shown in figure 2., diameter of 35 µm.
EXPERIME�TAL RESULTS Figures 4, 5 and 6 show the experimental results obtained for methylene blue, Crystal Violet and Malachite Green, respectively, with Gaussian Z-scan setup of figure 1. 1.6
Normalized transmittance
1.4
1.2
1.0
0.8
0.6
0.4 -15
-10
-5
0
5
10
15
Z mm
Figure 4. Z-scan trace for methylene Blue with Gaussian beam setup of figure 1.
Normalized transmittance
2.0
1.6
1.2
0.8
0.4
0.0 -15
-10
-5
0
5
10
15
Z mm
Figure 5. Z-scan trace for Crystal Violet with Gaussian beam setup of figure 1.
562
Downloaded 16 Jan 2013 to 200.23.5.162. Redistribution subject to AIP license or copyright; see http://proceedings.aip.org/about/rights_permissions
Normalized transmittance
2.0
1.6
1.2
0.8
0.4
0.0 -15
-10
-5
0
5
10
15
Z mm
Figure 6. Z-scan trace for Malachite Green with Gaussian beam setup of figure 1.
In figures 7, 8 and 9 we show the experimental results obtained for methylene blue, Crystal Violet and Malachite Green, respectively, with Bessel-Gauss Z-scan setup of figure 2. 1.6
Normalized transmittance
1.4
1.2
1.0
0.8
0.6
0.4 -15
-10
-5
0
5
10
15
20
Z mm
Figure 7. Z-scan trace for methylene blue with Bessel-Gauss beam setup of figure 2.
3.0
Normalized transmittance
2.5
2.0
1.5
1.0
0.5
0.0 -15
-10
-5
0
5
10
15
Z mm
Figure 8. Z-scan trace for Crystal Violet with Bessel-Gauss beam setup of figure 2.
563
Downloaded 16 Jan 2013 to 200.23.5.162. Redistribution subject to AIP license or copyright; see http://proceedings.aip.org/about/rights_permissions
Normalized transmittance
2.0
1.6
1.2
0.8
0.4 -20
-15
-10
-5
0
5
10
15
Z mm
Figure 9. Z-scan trace for Malachite Green with Bessel-Gauss beam setup of figure 2.
CO�CLUSIO�S The Z-scan curves obtained show a slight difference between the two techniques, Gaussian and Bessel-Gaussian beam. Comparing the figures 5 and 8 we observed an increasing in [∆Τp,v] when we used a Bessel-Gauss beam in the Z-
scan technique, nevertheless the rest of figures show a slight increasing in [∆Τp,v] when a Gaussian beam is used. Also, the distance between the peak and valley for figures 5, 8 and 6, 9 remain constant; nevertheless this distance for the figure 7 is greater than the distance for the figure 4. In summary, alone for a colorant (crystal violet) we observed an increasing in [∆Τp,v] using the Z-scan technique with a Bessel-Gauss beam, as it is mentioned in [3].
ACK�OWLEDGME�TS The authors acknowledge support for VIEP, BUAP by projects: 22/EXC/06-G and 29/EXC/07.
REFERE�CES 1. J.A. Hermann and P.B. Chapple, J. Mod. Opt. 38, 1035-1041 (1991). 2. T. Xia, D. J. Hagan, M. Sheik-Bahae, and E.W. Van Stryland, Opt. Lett. 19, 317-319 (1994). 3. S. Hughes and J. M. Burzler, Physical Review A, 56, R1103-R1106 (1997). 4. M.J. Moran, C.Y. She y R.L. Carman, IEEE J. Quantumm Electron., QE-11, 259 (1975). 5. R. Adair, L.L. Chase y S. A. Payne, J. Opt. Soc. Am., B4, 875 (1987). 6. S.R. Friberg y P.W. Smith, IEEE Quantumm Electron., QE-23, 2089 (1987). 7. A. Owyoung, IEEE J. Quantumm Electron., QE-9, 1064 (1973). 8. W.E. Williams, M.J. Soileau y E.W. Van Stryland, Opt. Comm., 50, 256 (1984). 9. M. Sheik-Bahae, A. A. Said, y E. W. Van Stryland, High-sensitivity, single beam n2 measurements, Opt. Lett. 14, 17 (1989) 955-957. 10. J. Hill, G. Parry, and a. Miller, Opt. commun. 43, 151 (1982). 11. M. sheik-Bahae, A.A. Said, T.H. Wei, et al., IEEE, J. quantum Electron. 26 (4) (1990) 760. 12. T. Xia, D. J. Hagan, M. Sheik-Bahae, E. W. Van Stryland, Optics Letters, 19, 317 (1994). 13. W. Zhao and P. Palfffy-Muhoray, Appl. Physics Lett. 63, 1613 (1993). 14. Sheik-Bahae, J. Wang, R. DeSalvo, D. J. Hagan, E. W. Van Stryland, Optics Letters, 17, 258 (1992). 15. David O. Caplan, Gregory S. Kanter, Prem Kumar, Optics Letters, 21, 1342 (1996). 16. M. Sheik-Bahae, A. A. Said, D. J. Hagan, M. J. Soileau, E. W. Van Stryland, Optical Engineering, 30, 1228 (1991).
564
Downloaded 16 Jan 2013 to 200.23.5.162. Redistribution subject to AIP license or copyright; see http://proceedings.aip.org/about/rights_permissions