Experiments on a High Performance Hydraulic Manipulator Joint: Modelling for Control Glen Bilodeau and Evangelos Papadopoulos Department of Mechanical Engineering & Centre for Intelligent Machines McGill University Montreal, Canada
[email protected],
[email protected]
Abstract: Modelling and experimental identification of a hydraulic servoactuator system is presented. The development of the model i s important for further understanding the system and for developing a robust force controller. System parameters are identified using the elbow joint of the SARCOS slave experimental hydraulic manipulator. Experimental work is central to achieving the modelling objectives. Physical parameters are identified using specially designed experiments and apparatus which isolate various subsystems of the joint. Several modelling assumptions are justified by experimental observations. The model is validated by comparing simulation and experimental results. Correlation between model and actual system response proved to be very good. Hence, the developed model predicts well system dynamics behavior and will prove useful in the development of a robust force controller.
1. Introduction Teleoperated robotic systems can improve both the safety and efficiency of manipulation tasks in hazardous environments. Some applications include live-line maintenance, firefighting, hazardous waste management and underwater operations. These tasks are characterized by the need for applying large forces on an environment that may be stationary or moving. Actuator, link, and sensor dynamics of the manipulator may also be important and influence the overall system performance. Of particular interest are manipulators with hydraulic actuators due to their high output force to mass ratio, to their fire inertance and to the availability of hydraulic power in mobile systems. To achieve accurate force control, one needs to have precise control of joint torque. Hydraulic actuators introduce additional complexities to force control of manipulators. Unlike electrically actuated manipulators, actuator torque output is not proportional to motor current input. In hydraulic actuators, current input modulates valve orifice area. In addition, actuator effects may include hysteresis, stiction and other valve-related nonlinearities which further complicate their dynamics. In order to develop a robust and effective controller and to ensure controller performance, an accurate model of the actuator is required. Prior work in modelling and control of hydraulic actuators deals mostly with the common spool valve for which orifice areas are generally linear with respect to
the valve position. On the other hand, the servovalve used in this work is of the jetpipe/suspension type which is more complex. In these valves, there is no contact between moving surfaces. Also, they have a small moving mass and therefore can be very fast resulting in high bandwidth. For the jet-pipe servovalve, a model was proposed and studied in [1], and [2]. In the present work, the suspension type design is studied. A number of previous studies have dealt with position and force control of hydraulic actuators. A linearized model was used for position control of a spool valve and rotary actuator system, [3]. A model was employed in a feedforward simulation filter, an alternative to the inverse dynamics method, for control of a hydraulically actuated flexible manipulator, [4]. Additional research emphasized temperature variations, friction and limit cycling, [5]. In force control applications, limited work has been done. Use of a model of a hydraulic system to evaluate the hybrid position/force control scheme, inherently not model-based, was demonstrated by [6], [7], and [8]. Explicit force control of hydraulic actuators was treated by [1], and [9]. A position-based impedance control law was applied to a hydraulic manipulator, [10]. Although the focus is in control, modelling is essential to understand the system to be controlled. In this research work, the objective is to develop an accurate model of a hydraulic actuator joint, to experimentally identify associated parameters, and to validate the derived model experimentally. The final result should be useful in designing and implementing an effective force controller. Section 2 describes the experimental manipulator. Section 3 discusses the physical effects within the system and their modelling. Section 4 describes the experimental parameter identification procedures and additional apparatus, and Section 5 compares experimental results with simulation results validating the model. Finally, conclusions and future work are given in Section 6. Table 1 details the notation used throughout this paper. Table 1. Nomenclature. Variable i, ihys
Definition current before and after hysteresis.
Variable V p1 , Vc1
mv, bv, kv
V p2 , Vc2
xv Fff
servovalve suspension arm mass, damping, and stiffness. valve tip displacement. flow force at valve tip.
B
servovalve motor torque constant.
Rv
ρ, µ, β
density, viscosity and bulk modulus of oil. cross-sectional area, length and diameter of supply line. cross-sectional area, length and diameter of return line. pump pressure and tank pressure.
J v , Jl
Definition volume in line of port 1 and in chamber 1. volume in line of port 2 and in chamber 1. discharge coefficient. rotary actuator volumetric displacement. leakage coefficient of rotary actuator. vane and load rotary inertia.
bvn, bl, bs
vane, load and shaft damping.
ks
shaft angular stiffness.
ωvn, θvn
flow through supply line, supply pressure before servovalve. pressure at valve tip.
ωl, θl
vane angular velocity and angular position. load angular velocity and angular position. external torque and torque due to friction. weight of load
As, ls, ds Ar, lr, dr P s , Pr Qsv, Psv Psv2 Qrl, Prl P p1 , Pp2
Cd Dv
τext,τcoul
flow through return line, return Wl pressure after servovalve. chamber pressure, port 1 and port 2. CA
accumulator capacitance
2. Description of the Experimental Setup The high performance SARCOS hydraulic manipulator is used for the experimental determination and validation of the model parameters. The SARCOS manipulator has ten degrees of freedom, seven in the arm and three in the hands. Overall, the hardware support consists of a 486 PC, a digital signal processor (DSP), an I/O card and Advanced Joint Controller (AJC) cards. For modelling, the elbow joint of the manipulator is used. Sensors available at this joint include an optical encoder angular position sensor, a rotary variable differential transformer (RVDT) for analog position measurement, and a strain gauge full-bridge joint torque sensor. The input current is also measurable.
3. System Characteristics and Modelling To obtain an accurate model of the hydraulic joint, a description of the physical effects within each subsystem is required. These effects are mainly due to servovalve dynamics, fluid dynamics, and vane and load dynamics. A schematic of the joint is shown in Figure 1. A bond graph of the system was obtained in our previous work, [11]. Each subsystem and the modelling assumptions are discussed next.
Figure 1. Schematic of hydraulic joint.
3.1. Servovalve Dynamics The servovalve used in this work is a single-stage, suspension-type valve. As can be seen in Figure 1, fluid impinges the valve tip while current in the coil modifies the magnetic field generated by the magnet which modulates valve tip motion directing the flow from the supply line to one of the control port. Hysteresis and valve tip dynamics and orifice geometry must be addressed to model the servovalve accurately. 3.1.1. Hysteresis An important phenomenon in the servovalve is hysteresis. Several researchers have observed and characterized hysteresis in the jet-pipe servovalve [1], [2], and [12]. Physically, the hysteresis occurs between the input current and valve tip position. For simplification, in this research, the physical hysteresis and the valve tip dynamics are taken as decoupled. Essentially, the hysteresis is modelled as being between the input current and some virtual output current, ihys, which in turn modulates the valve tip position. Overall, the effect is a hysteresis relation between the input current and the output valve tip position. To analytically represent this phenomenon, a model based on the JilesAtherton theory for magnetization of ferromagnetic material is used [13]. The model is a nonlinear first order differential equation which accounts for major and minor loops. The only requirement for this model is the knowledge of the reversal point,
i.e., the point at which the slope of the input current changes sign. Thus, the virtual output current is related to the input current as Λµ o i˙ is L(i, ihys ) − i (1) i˙hys = kδ − µ oα is L(i, ihys ) − i
(
)
(
where L, the Langevin function, and δ are given by
(
)
L(i, ihys ) = coth µ o (i + αihys ) −
)
1 µ o (i + αihys )
()
(2)
δ = sign i˙
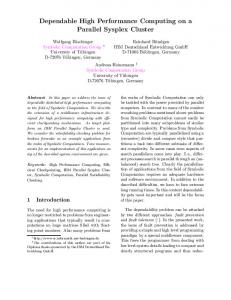
The scaling factor, Λ, which is less than unity for minor loop generation, depends on the switching point and the major loop which saturates at is. Parameters, µ o, α and k affect the inclination and width of the hysteresis. A hysteresis curve generated by this model is shown in Figure 2 for a decreasing amplitude sinusoid input. MAJOR and MINOR LOOPS 1 0.8 0.6 0.4
OUTPUT
0.2 0 −0.2 −0.4 −0.6 −0.8 −1 −0.6
−0.4
−0.2
0
0.2
0.4
0.6
0.8
INPUT
Figure 2. Model generated hysteresis.
3.1.2. Valve Tip Dynamics The moving part of the servovalve may be taken as a cantilever beam with an end mass, see Figure 1. Thus the dynamics of the valve tip may be approximated by a second-order lumped parameter system with mass, mv, damping, bv, and stiffness, k v . In reality, these parameters would be nonlinear since the cantilever has a distributed mass and is submerged in oil. Forces acting on this cantilever include the input force due to current and flow forces acting at the valve tip. As fluid passes through an orifice, flow forces develop due to fluid acceleration. Reaction forces result which tend to close an opening valve, [14]. These forces are difficult to model, and for the suspension type valve, no model based on the physics is available. Thus, the dynamics of the valve tip may be expressed as x˙ v = vv
(
)
(3) 1 Bihys + Ff − bv vv − kv x v mv where Ff are fluid-induced forces. Note that the input to the system is essentially a force, Bihys, where ihys lumps the hysteresis part of the model. In all, the hysteresis and valve tip dynamics combine to describe the behavior of the servovalve. Further to the dynamics of the servovalve, geometric modelling of the valve tip orifices is essential for the fluid dynamics subsystem, which is discussed next. v˙v =
3.2. Fluid Dynamics Fluid flow through lines, orifices and the rotary actuator are modelled including turbulent flow, leakages, and line losses. In addition, fluid inertance as well as fluid capacitance due to fluid compressibility are taken into account, [14]. Flow through orifices is taken as turbulent, thus, the square root law relating the pressure drop across the orifice and the flow through the orifice is used, [15] Q = Cd Aorifice ( x v )
2 ( Phi − Plo ) ρ
(4)
= gorifice ( x v , Phi , Plo ) This relation contributes to the nonlinearity of the joint model. In addition, the orifice area Aorifice is also nonlinear. In the case of the suspension valve design used in the experiments, the orifice areas are eye or slit shaped. Furthermore, as opposed to the usual matched and symmetrical orifice configuration of spool valves, the present servovalve design was found to be symmetric but unmatched, which adds further to the complexity of the model. The model accounts for servovalve leakage as a result of the clearance between valve tip and receiver. Two stages of pressure drops are present. First, as the supply flow impinges on the valve tip, the pressure drops from Psv to Psv2, see Figure 3.
Figure 3. Valve tip and receiver with pressure notation.
Second, Psv2 drops to one of the port pressures as the flow is diverted to the actuator. Meanwhile, with each drop, leakage to low pressure is also evident. The two dependent variables, Psv2 and Prl are cumbersome to solve for assuming the square root law. Thus, linear resistances were assumed. They may be found through compatibility equations giving the following Psv 2 = w1 ( Psv , Pp1 , Pp 2 , x v , Qrl ) (5) Prl = w2 ( Psv , Pp1 , Pp 2 , x v , Qrl ) (6) In the actuator, leakage between chambers as a result of the gap between the vane and the vane housing was also accounted for. This leakage was considered as a linear resistance denoted as R v. In the end, the dynamic equations for flow from the servovalve to the actuator take on the form A 128µls Qsv − Psv Q˙ sv = s Ps − 4 ρls πds 1 P˙sv = (Qsv − glk ( xv , Psv , Prl ) − gv ( xv , Psv , Psv 2 )) CA
(7) (8)
β g1 ( x v , Psv 2 , Pp1 ) − g4 ( x v , Pp1 , Prl )− Dvω vn − Rv ( Pp1 − Pp 2 ) (9) (Vc1 + Vp1 ) β P˙p 2 = g2 ( x v , Psv 2 , Pp 2 ) − g3 ( x v , Pp 2 , Prl )+ Dvω vn + Rv ( Pp1 − Pp 2 ) (10) (Vc 2 + Vp 2 )
(
P˙p1 =
)
(
128µlr A Q˙ rl = r Prl − Qrl − Pr 4 ρlr πdr
)
(11)
3.3. Vane and Load Dynamics The vane is modelled as a second-order mechanical rotational system. For an ideal hydraulic rotary actuator the input torque is related to the load pressure as τ = Dv Pload (12) This relation allows identification of the volumetric displacement, D v. This parameter also relates the flow through the actuator with its angular velocity Qload = Dvω vn (13) Continuing, the load is connected to the vane via a shaft which is modelled as a spring and damper. Also modelled is viscous friction and Coulomb friction due to the contact of the seals with the housing. Thus the mechanical equations for the vane and load are 1 Dv ( Pp1 − Pp 2 ) − τ coul (ω vn ) − bvnω vn − ks (θ vn − θ l ) − bs (ω vn − ω l )) (14) ω˙ vn = Jv 1 ω˙ l = (ks (θ vn − θ l ) + bs (ω vn − ω l ) − τ coul (ω l )− blω l − Wl sin(θ l ) + τ ext ) (15) Jl
(
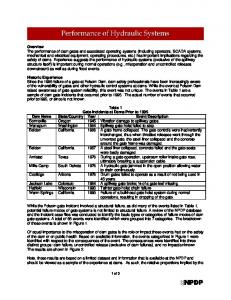
4. Parameter Identification Model parameters were obtained from various sources and methods. Oil properties like bulk modulus, β, viscosity, µ, and density, ρ, were taken from manufacturer tables and plots. However, other parameters needed to be obtained through specially devised experiments. These parameters include actuator volumetric displacement, servovalve dynamics parameters, actuator leakage, and shaft stiffness. In the following, additional apparatus built and the experimental procedures devised for the purpose of identifying these parameters are discussed. 4.1. Experimental Apparatus Two pieces of apparatus were designed and built to obtain additional measurements and to isolate subsystems, see Figure 4. First, the joint brace allows identification of
(a) (b) Figure 4. Additional apparatus: (a) Joint brace; (b) Manifold.
shaft stiffness, servovalve dynamics and actuator leakage. Second, the manifold equipped with pressure transducers allows pressure measurements of the supply line, control ports and the return line. Appropriate ports may be blocked in order to deviate the return flow to a graduated cylinder for volume measurements. In addition, the manifold may be installed at other joints with similar servovalve/robot interface. The usefulness of the equipment is three-fold: (1) identification, (2) validation of the model, and (3) validation of a controller. 4.2. Experimental Identification Several experiments were performed to identify key parameters of each subsystem. First, a discussion of the identification of servovalve dynamics is given followed by shaft stiffness identification and finally identification of actuator volumetric displacement and leakage. 4.2.1. Servovalve Parameters The principal concerns for modelling the servovalve are the geometry of the valve tip and receiver orifices, and the dynamic characteristics of the valve tip. The geometric information includes the size and layout of the orifices at the valve tip and the receiver. These were obtained by direct measurement of the valve tip and receiver. An approximate valve tip range of motion was also obtained from these measurements. The dynamic characteristics of the valve tip were obtained by isolating the servovalve from the actuator by immobilizing the load with the brace. The valve tip dynamics were assumed to be second order. Neglecting flow forces for the identification process, the valve tip equation of motion may be expressed as B 2 ˙˙ (16) ihys x v + 2ζ Pω nP x˙ v + ω nP xv = mv Since the valve tip position is not measurable, it is expressed in terms of the load pressure which is accessible. This is written as x v = f ( Pload ) = K v Pload (17) Note that this is essentially the static load characteristic of the servovalve. To simplify the model further, it was assumed that this characteristic is linear, see second part of Equation (17). A curve obtained by a simulation and its linear approximation is illustrated in Figure 5. Substituting Equation (17) into Equation (16), the second order dynamics may be expressed in terms of the load pressure B 2 (18) ihys = K dcω nP ihys mv K v As a consequence of the highly nonlinear nature of this system, the damping ratio, natural frequency and the DC gain, K dc, will depend on the input current. Figure 6a shows several experimentally obtained Bode plots of the transfer function for currents of increasing amplitude. As it can be seen, the DC gain between load pressure and input current decreases with increasing amplitude current. It may also be observed that the dynamic characteristics are similar. The curves are close to those of a second order critically damped system. Figure 6b shows one of the experimentally obtained Bode plots fitted with one which corresponds to a second order system with appropriate natural frequency and critical damping. For simplicity, it is assumed that the damping ratio and the natural frequency are constant. Any nonlinearities in the ˙˙ + 2ζ ω P˙ + ω 2 P = P load P nP load nP load
servovalve, such as discharge coefficients, are lumped into the DC gain, K dc. A reasonable relationship between the DC gain and the valve tip position was obtained for best correspondence with experimental data. Load pressure vs Valve position 2500 2000 1500
Load Pressure (psi)
1000 500 0 −500 −1000 −1500 −2000 −2500 −0.015
−0.01
−0.005
0 0.005 Valve Position (in)
0.01
0.015
Figure 5. Static load characteristic of servovalve and its linear approximation. Bode Plot − Experimental and Fitted 80
75
75
dP/di
dP/di
Bode Plots − Increasing Current Amplitudes 80
70
65
60 0 10
70
65
1
2
10
10 rad/s
(a)
3
10
60 0 10
1
2
10
10
3
10
rad/s
(b)
Figure 6. Bode Plots: (a) Increasing amplitude input current; (b) Experimental plot (*) with fitted plot.
4.2.2. Shaft Stiffness The shaft stiffness was determined by measuring angular position and torque while the load was braced. Plotting torque versus angular position, an approximate straight line results whose slope is approximately the angular joint stiffness. This plot is shown in Figure 7a. The joint shaft stiffness was found to be 8.9×10⁴ lb·in/rad. Now, to verify this value, assuming a solid shaft, the stiffness was computed as ks = GJ ls = 11.06 × 10 4 lb ⋅ in/rad (19) Since the shaft is, in fact, nonsolid, this discrepancy is expected. In all, the experimentally determined stiffness closely matches that obtained theoretically. 4.2.3. Actuator Volumetric Displacement and Internal Leakage An important property of the actuator is its volumetric displacement, D v. This parameter relates torque and load pressure as well as load flow and angular velocity as depicted in Equations (12) and (13). To identify Dv, measurements of torque and load pressure are required. Actuator nonlinearities are assumed to insignificantly affect the identification of Dv, so that the torque/pressure relationship may be used. Thus, with the manifold installed and the elbow free to rotate, a sinusoidal current was sent in open-loop resulting in an oscillation of the arm. The torque versus load pressure is plotted in Figure 7b. Here, the slope of the inclined line segments is the sought after volumetric displacement of the rotary actuator. Now, in order to identify the actuator
leakage, the brace was installed, and one of the control ports was diverted to a graduated cylinder for rate measurements for a series of constant input currents. In effect, the flow to the graduated cylinder is that through the vane clearance. The actuator leakage was identified according to Qleak = Rv ( Pp1 − Pp 2 ) (20) Under the experimental conditions, Pp2 is close to atmospheric pressure. TORQUE vs ANGULAR POSITION
TORQUE vs PRESSURE ACROSS VANE
200
250 200
150
150 100 100 50 lb−in
lb−in
50
0
0 −50
−50
−100 −100 −150 −150
−200 −1.6355
−200
−1.635
−1.6345
−1.634
−1.6335 rad
(a)
−1.633
−1.6325
−1.632
−250 −800
−600
−400
−200
0 psi
200
400
600
800
(b)
Figure 7. Determination of shaft and actuator parameters: (a) Shaft stiffness; (b) Volumetric displacement.
4.2.4. Load and Friction Parameters The load parameters such as mass and damping were obtained by a least squares estimation. The load mass, was verified under static conditions also. Viscous friction and Coulomb friction were both accounted for. In the case of viscous friction, it was lumped into the damping term of the load. They were also identified by a leastsquares fit. In order to obtain more certainty in the Coulomb friction model, the torque versus load pressure curve was used, shown in Figure 7b. As the pressure measurements are made before the vane actuator and the torque measurements include friction, the difference between the two is due to the stick-slip phenomenon. In short, the horizontal portions of the curve are due to Coulomb friction. On the whole, through these experiments, several parameters were identified with good accuracy since each parameter was obtained by isolating the subsystem of interest. Those parameters that were not estimated with good certainty, including the clearance between valve tip and receiver, were tuned until satisfactory correlation between simulation and experiments were obtained. In the next section, the model is evaluated by comparing its response to those of the actual system.
5. Validation Having developed and identified the model and its parameters, a comparison of simulation and experimental results is performed to test how well the model predicts system behavior. The s-function approach in Matlab with Gear integration method was used. Experiments were performed in open loop mode at an operating supply pressure of 3000 psi. Experiments were done to validate servovalve dynamics, and the overall joint model in statics and dynamics cases. Before the execution of each experiment, an exponentially decaying sinusoidal current was commanded in order to begin each experiment with a load pressure close to zero, resulting in a valve tip position practically at the null. The decaying sinusoid also removed any memory due to hysteresis. Refer to Figure 2 for an example.
3000
3000
2500
2500
2000
2000
Pressure (psi)
Pressure (psi)
5.1. Braced Joint Experiments As it was done for identifying the servovalve dynamic characteristics, the joint was blocked in order to validate the model of the servovalve dynamics. In effect, the valve tip dynamics are isolated from the load dynamics. In simulation, the vane and load positions and their derivatives were constrained to be zero. Initial conditions for simulation were set to match those of the experiments. For sinusoidal currents of amplitudes 0.2 A and 0.3 A and frequency of 1.0 rad/sec, the supply pressure and the two chamber pressures are shown in Figure 8 for simulation and experiment. The two responses match well. An interesting feature is that one of the chamber pressures is not symmetric. It is suspected to be related to the unmatched characteristic of the servovalve. However, it was observed only for currents of 0.3 A and higher. In the model, Kv was made to be asymmetric.
1500
1500
1000
1000
500
500
0 0
2
4
6
8
10 time (s)
12
14
16
18
0 0
20
2
4
6
8
(a) Figure 8.
10 time (s)
12
14
16
18
20
(b)
Supply and chamber pressures, braced joint tests: (a) Current amplitude 0.2 A; (b) Current amplitude 0.3 A.
5.2. Unbraced Joint - Statics Case Static tests allowed the verification of the model in the case for which the load remains stationary, where all the state rates are practically zero. The joint was unbraced and a constant input current was commanded. Measurements were taken after steady state was achieved. Thus, for two different constant input currents of 0.05 A and 0.1 A the chamber pressures and supply pressure before the servovalve are shown in Figure 9a and 9b. As it may be seen, the model captures well the static behavior of the system. Figure 9c illustrates that the load position is also well modelled in the statics case. Next, the dynamic behavior of the model is discussed. 3000
Input current = 0.05 amp
3000
2500
2000
1500 Pp1 1000
5
10
500
15 time (s)
(a)
20
25
30
0.3 0.2 0.1 0 0
1000
Pp2
500
0.4
5
10
5
10
1500
Load position (rad)
Pressure (psi)
Pressure (psi)
2000
0 0
Load position (rad)
0.5
Psv
2500
0 0
5
10
15 time (s)
(b)
20
25
30
15 20 time (s) Input current = 0.1 amp
25
30
25
30
1 0.8 0.6 0.4 0.2 0 0
15 time (s)
20
(c)
Figure 9. Static Response: (a) Pressures for i = 0.05 A; (b) Pressures for i = 0.1 A, (c) Load position - (top) 0.05 A; (bottom) 0.1 A.
5.3. Unbraced Joint - Dynamics Case In this set of experiments, the joint is free to rotate according to an input current of i = 0.1 sin(0.25t ) A
(21)
The pressure response was plotted and compared to the simulated response, as shown in Figure 10a. As depicted, the simulation curves match well the experimental curves for supply and chamber pressures. Of importance in control is the load pressure, Pload, which is plotted in Figure 10b. Again, simulation and experimental plots correspond well. The response of the load position is illustrated in Figure 10c and is quite close to the experimental load position. As the arm approaches the highest parts of its trajectory, it can be seen that the stick-slip friction model is satisfactory. On the whole, the model for the load dynamics is also good. Some differences between simulation and experiments are present due to unmodelled effects and to the lumped parameter approach in modelling. These factors include temperature effects on the oil parameters as well as the reduction of oil bulk modulus due to air entrainment. The above results indicate that these effects are not significant for the purpose of control and therefore no further modelling of these effects is required. 3000
1000
0.6
800 0.4
Psv
2500
600 0.2
Pp2(sim) Pp1(sim)
1500
Load position (rad)
Pressure (psi)
Pp2(exp)
Load Pressure (psi)
400 2000
200 0 −200
0
−0.2
1000 −400
−0.4
−600 500
Pp1 (exp)
−0.6 −800
0 0
5
10
15
20 25 time (s)
30
35
(a)
40
45
−1000 0
5
10
15
20 25 time (s)
(b)
30
35
40
45
−0.8 0
5
10
15
20
25 time (s)
30
35
40
45
50
(c)
Figure 10. Dynamic response for simulation and experiment: (a) Supply and chamber pressures; (b) Load pressure; (c) Load position.
6. Conclusions The contributions of this research work is both analytical and experimental. An accurate model of a hydraulic joint of a manipulator has been developed. The associated parameters were identified through a series of specially designed experiments and equipment. In turn, this lead to a model that accounts for the major effects of an electrohydraulic actuator such as hysteresis, flow through orifices, and line losses. In addition, the model is able to characterize the servovalve dynamics well. The developed model represents well the behavior of the real system and can be extended to other joints of the SARCOS slave manipulator as well as the master in such a way as to obtain a complete model of the hydraulics of the SARCOS manipulator. It is expected that this model will be useful in designing a robust force controller in order to reduce control effort, to mask unwanted nonlinear behavior and to improve control performance.
Acknowledgements The support of this work by the Fonds pour la Formation de Chercheurs et l’Aide à la Recherche (FCAR), Québec, and by the Natural Sciences and Engineering Council of Canada (NSERC) is gratefully acknowledged.
References [1] Boulet B, Daneshmend L, Hayward V, Nemri C 1992 System Identification and Modelling of a High Performance Hydraulic Actuator. In: Chatila R, Hirzinger G(eds) 1992 Exp Robotics II - The Second Int Symp. Springer-Verlag, New York. [2] McLain T W, Iversen E K, Davis C C, Jacobsen S C 1989 Development, Simulation, and Validation of a Highly Nonlinear Hydraulic Servosystem Model. Proc of the 1989 Am Control Conf. Pittsburgh PA, pp 385-391. [3] Heintze J, Schothorst G v, v d Weiden A J J, Teerhuis P C 1993 Modeling and Control of an Industrial Hydraulic Rotary Vane Actuator. Proc of the 32nd Conf o n Decis and Control. San Antonio TX, pp 1913-1918. [4] Kwon D S, Babcock S M, Burks B L, Kress R L 1995 Tracking Control of the Hydraulically Actuated Flexible Manipulator. Proc of the 1995 Int Conf on Robotics and Autom, ICRA’95. Nagoya Japan, pp 2200-2205. [5] Love L, Kress R, Jansen J 1997 Modeling and Control of a Hydraulically Actuated Flexible-Prismatic Link Robot. Proc of the 1997 IEEE Conf on Robotics and Autom, ICRA’97. Albuquerque NM, pp 669-675. [6] Bluethmann B, Ananthakrishnan S, Scheerer J, Faddis T N, Greenway R B 1995 Experiments in Dexterous Hybrid Force and Position Control of a Master/Slave Electrohydraulic Manipulator. Proc of the 1995 Int Conf on Intell Robots and Syst, IROS’95. Pittsburgh PA, pp 27-32. [7] Dunnigan M W, Lane D M, Clegg A C, Edwards I 1996 Hybrid position/force control of a hydraulic underwater manipulator. IEE Proc Control Theory & Appl. 143:145-151. [8] Unruh S, Farris T, Greenway B, Hibbard W 1994 A Hybrid Position/Force and Positional Accuracy Controller for a Hydraulic Manipulator. SPIE Telemanipulator and Telepresence Technol. 2351:207-213. [9] Laval L, M’Sirdi N K, Cadiou J-C 1996 H∞-Force Control of a Hydraulic ServoActuator with Environmental Uncertainties. Proc of the 1996 IEEE Int Conf o n Robotics and Autom, ICRA’96. Minneapolis, MN, pp 1566-1571. [10] Heinrichs B, Sepehri N, Thornton-Trump, A B 1996 Position-Based Impedance Control of an Industrial Hydraulic Manipulator. Proc of the 1996 IEEE Int Conf o n Robotics and Autom, ICRA’96. Minneapolis, MN, pp 284-290. [11] Bilodeau G, Papadopoulos E 1997 Development of a Hydraulic Manipulator Servoactuator Model: Simulation and Experimental Validation Proc of the 1997 IEEE Int Conf on Robotics and Autom, ICRA’97. Albuquerque, NM, pp 1547-1552. [12] Henri P D, Hollerbach J M 1994 An Analytical and Experimental Investigation of a Jet-Pipe Controlled Electropneumatic Actuator. Proc of the 1994 IEEE Int Conf o n Robotics and Autom, ICRA’94. San Diego, CA, pp 300-306. [13] Carpenter K H 1991 A Differential Equation Approach to Minor Loops in the JilesAtherton Hysteresis Model. IEEE Trans on Magnetics. 27:4404-4406. [14] Blackburn J F, Reethof G, Shearer J L (eds) 1960 Fluid Power Control. MIT Press, Cambridge. [15] Merritt H E 1967 Hydraulic Control Systems. John Wiley and Sons Inc., New York.