Pathophysiology/Complications O R I G I N A L
A R T I C L E
Explanations for the Lower Rates of Diabetic Neuropathy in Indian Asians Versus Europeans CAROLINE A. ABBOTT, PHD1 NISHI CHATURVEDI, MD2 RAYAZ A. MALIK, PHD1 ELEANNA SALGAMI, MD1
ALLEN P. YATES, PHD3 PHILIP W. PEMBERTON, PHD3 ANDREW J.M. BOULTON, MD1
OBJECTIVE — Risks of diabetes and cardiovascular disease are elevated worldwide in Indian Asians. However, risks of other diabetes-related complications, i.e., foot ulceration and amputation, also with a vascular basis, are substantially lower in Asians than in white Europeans in the U.K., possibly due to less neuropathy. We therefore compared signs, symptoms, and objective quantitative measures of diabetic neuropathy and their risk factors in Indian Asians and Europeans. RESEARCH DESIGN AND METHODS — This was a cross-sectional study of a population-based sample of age- and sex-matched adults with type 2 diabetes of European (95 male and 85 female) and Asian (96 male and 84 female) descent in the U.K. Patients were assessed for neuropathic symptoms, signs, nerve conduction, autonomic function, and quantitative sensory testing. Peripheral vascular function and other potential risk factors for neuropathy were measured. RESULTS — Mean nerve conduction velocity Z scores were better in Asians (mean ⫾ SD 0.07 ⫾ 0.62) than in Europeans (⫺0.11 ⫾ 0.60; P ⫽ 0.007) and were explained by the shorter height, fewer pack-years smoked, and higher transcutaneous oxygen levels (TCpO2) in Indian Asians (P value for ethnic comparison attenuated to 0.2). Small fiber neuropathy was less prevalent in Indian Asians compared with Europeans (odds ratio 0.58 [95% CI 0.37– 0.93]; P ⫽ 0.02) and was primarily accounted for by better TCpO2 (0.70 [0.40 –1.21]; P ⫽ 0.2). CONCLUSIONS — Asians with diabetes have substantially less large and small fiber neuropathy than Europeans, despite comparable traditional risk factors. Independent from smoking, the lower risk of neuropathy in Asians is due to better skin microvascularization and may help explain the substantially reduced Asian foot ulcer risk. Diabetes Care 33:1325–1330, 2010
P
eople of Indian Asian descent worldwide have one of the highest risks of type 2 diabetes; in the U.K., this is four times more prevalent than in the general population (1). Most studies indicate that risks of cardiovascular disease (CVD) in Indian Asians with diabetes are greater than that in Europeans, reflecting their overall greater predisposition to CVD (2,3). Although many diabetes com-
plications have a vascular basis, we and others have shown, paradoxically, that risks of both foot ulceration and amputation are substantially lower (threefold and fourfold, respectively) in Indian Asians compared with Europeans (4,5) and that lower rates of peripheral neuropathy in Indian Asians may, to a large extent, account for this protection. To date, however, neuropathy assessments have been
● ● ● ● ● ● ● ● ● ● ● ● ● ● ● ● ● ● ● ● ● ● ● ● ● ● ● ● ● ● ● ● ● ● ● ● ● ● ● ● ● ● ● ● ● ● ● ● ●
From the 1Cardiovascular Research Group, School of Biomedicine, University of Manchester, Manchester, U.K.; the 2International Centre for Circulatory Health, National Heart and Lung Institute, Imperial College at St. Mary’s, London. U.K.; and the 3Department of Clinical Biochemistry, Manchester Royal Infirmary, Manchester, U.K. Corresponding author: Caroline A. Abbott,
[email protected]. Received 9 November 2010 and accepted 26 February 2010. Published ahead of print at http://care. diabetesjournals.org on 9 March 2010. DOI: 10.2337/dc09-2067. © 2010 by the American Diabetes Association. Readers may use this article as long as the work is properly cited, the use is educational and not for profit, and the work is not altered. See http://creativecommons. org/licenses/by-nc-nd/3.0/ for details. The costs of publication of this article were defrayed in part by the payment of page charges. This article must therefore be hereby marked “advertisement” in accordance with 18 U.S.C. Section 1734 solely to indicate this fact.
care.diabetesjournals.org
crude, subjective, and not comprehensive, and explanations for ethnic differences have not been sought. This study was designed to compare and account for differences in neuropathy between Indian Asians and Europeans with type 2 diabetes. We hypothesized that Indian Asians would have preserved large and small nerve function, using objective criteria, compared with Europeans, and that this would only be partly explained by differences in conventional risk factors. RESEARCH DESIGN AND METHODS — T h i s w a s a c r o s s sectional study of a randomly selected population-based sample of people with type 2 diabetes of European and Indian Asian descent drawn from primary care registers in Manchester, U.K. Type 2 diabetes was defined as a diagnosis made between age 30 and 39 years without insulin until at least 2 years after diagnosis or a diagnosis at age 40 years and above regardless of initial treatment. Because the mean age of diabetes diagnosis is generally younger in Indian Asians than in Europeans, broadening inclusion criteria for these individuals reduced the risk of a biased sample (5). A 5-year age stratum, ethnicity- and sexmatched sample of Indian Asians and Europeans with known type 2 diabetes was drawn from eight primary care registers in Central Manchester, all of which participate in ethnicity monitoring. Exclusion criteria were lower limb amputation, psychiatric disorder, known HIV positivity or hepatitis carrier, terminal illness, or inability to understand the study or provide informed consent. We required 360 people with diabetes (180 from each ethnic group). To achieve this, a total sample of 682 eligible patients was selected for invitation (52% Indian Asian and 51% male; mean ⫾ SD age 59 ⫾ 11 years). Of this sample, 360 subjects (53% response rate) gave written consent to participate (50% Indian Asian and 47% male; age 58 ⫾ 10 years). Differences between responders and nonresponders for age, sex, and ethnicity were not significant. This study was approved by North Manchester
DIABETES CARE, VOLUME 33, NUMBER 6, JUNE 2010
1325
Ethnic differences in diabetic neuropathy Research Ethics Committee and by the University of Manchester Committee on the Ethics of Research on Human Beings. Assessments Consenting participants fasted at the Manchester Royal Infirmary. A questionnaire was completed to obtain demographic data, medical history including drugs, and lifestyle factors. Ethnicity was checked, and country of birth was recorded (all Indian Asian participants were first-generation migrants). Trained personnel performed all measurements with standardized procedures and equipment according to existing protocols. We measured height, weight, and waist and hip circumference by a single measurement. Fasting blood samples were taken and sent to central laboratories for measurement of A1C, fasting plasma glucose, total cholesterol, HDL cholesterol, triglycerides, and serum ␥-glutamyltransferase (marker of alcohol consumption). Fasting serum insulin was measured using a sensitive in-house radioimmunoassay as described previously (6). Clinical complications of diabetes Retinopathy and nephropathy were defined as a history of physician-diagnosed disease. Serum and early morning urinary creatinine were measured on a Roche MODULAR P Unit using the Jaffe method. Urinary albumin was measured on a Beckman Array analyzer using their nephelometric assay. The urinary albumin-to-creatinine ratio was calculated. CVD was defined as either a physician-diagnosed myocardial infarction, angina, coronary artery bypass graft or stroke, or a positive response to the Rose Angina Questionnaire (7). Peripheral arterial disease was defined as previous history of physician-diagnosed claudication confirmed by lower limb arteriogram or a positive response to the Edinburgh Claudication Questionnaire (8). Assessment and definition of neuropathy Clinical symptoms and signs of neuropathy. Symptoms of muscle weakness, sensation, and autonomic neuropathy were determined from the Neuropathy Symptoms and Change (NSC) validated questionnaire (9). Signs were assessed using the modified Neuropathy Disability Score (NDS), comprising pinprick, vibration, temperature sensation, and ankle reflexes. An NDS of ⱖ6 indicated clinical neuropathy (10). 1326
Large fiber neuropathy. Electrophysiological assessments of peroneal, tibial, and ulnar nerves (motor nerve conduction velocity [NCV] and maximum Mwave amplitude) and sural and radial nerves (NCV and amplitude) were performed using a Dantec Counterpoint electromyograph system with surface electrodes (skin temperature ⱖ32°C). These assessments provide multiple, similar, markers of peripheral nerve function; therefore, we constructed Z scores. For each individual, every NCV value was expressed as a Z score, i.e., (value in the individual minus mean value in the overall study population) divided by the SD. An average NCV Z score was calculated as [(Z score sural NCV) ⫹ (Z score peroneal below fibular head NCV) ⫹ (Z score peroneal knee NCV) ⫹ (Z score tibial NCV) ⫹ (Z score radial NCV) ⫹ (Z score ulnar NCV)]/6. Thus, the more positive the result, the better the nerve function. The response amplitude Z score was calculated similarly. Vibration perception threshold (VPT) was assessed at the right and left great toes in duplicate using a calibrated Neurothesiometer (Horwell; Scientific Laboratory Supplies, Nottingham, U.K.) (11). Readings were averaged for analyses. Small fiber neuropathy. Cooling detection thresholds (CDTs), heat pain minimal threshold (HP-VAS0.5), and heat pain intermediate threshold (HP-VAS5.0) were evaluated on the dorsum of the left foot using a CASE IV system (WR Medical Electronics, Stillwater, MN) (12). For thermal thresholds ⱖ95th percentile of the CASE IV normality range was considered abnormal. Autonomic function was assessed by 1) change in resting heart rate in response to two separate cycles of deep breathing (HRDB) using a CASE IV system (ⱕ5th percentile of the CASE IV normality range was considered abnormal) (12) and 2) change in systolic blood pressure from the lying position to the standing position, using a Critikon Dinamap 8100T plus adult Dura-Cuf. Algorithm for small fiber neuropathy Small fiber neuropathy was classified using an algorithm incorporating the CASE IV normality range for HRDB, CDT, HPVAS0.5, and HP-VAS5.0 (12). The severity of small fiber dysfunction was stratified as normal (all tests normal), mild (one abnormal test), moderate (two abnormal tests), and severe (ⱖ3 abnormal tests). Small fiber neuropathy was de-
DIABETES CARE, VOLUME 33, NUMBER 6, JUNE 2010
fined as the presence of mild, moderate, or severe dysfunction. Vascular function tests The ankle-brachial pressure index (ABPI) was determined using a Multi Dopplex II ultrasound machine (Huntleigh Diagnostics) and sphygmomanometer (Speidel & Keller). Duplicate blood pressure readings were averaged for each limb, and ABPI was averaged for the right and left sides combined. Abnormal ABPI was defined as ⬍0.85 (13). Transcutaneous partial pressure of oxygen (TCpO2) was determined on the left foot dorsal surface using a transcutaneous monitor and oxygen sensor (Novametrix Medical Systems, Wallingford, CT) (14). The patient was semirecumbent, and foot skin temperature was maintained at ⱖ32°C. The calibrated TCpO 2 sensor heated and maintained skin temperature at 44°C. This produced a local maximal vasodilation to increase the permeability of the skin to oxygen. Measurements were taken after 20 min of stabilization. Statistical analysis NCV was selected as the primary outcome of interest, as it is an early marker of disease and measured objectively. We estimated that 360 patients (180 in each ethnic group) would be sufficient, with 85% power to detect a difference in NCV of at least one-third of a SD, at the 5% significance level, making allowances for missing data. Measures of neuropathy were compared between the ethnic groups as continuous variables, using simple means. Normally distributed data were tested using a Student t test; non-normally distributed data were log transformed before analysis or the Mann-Whitney test was used. Multivariate linear regression models using ANOVA were constructed to explore the role of potential confounders including glycemic control, height, smoking, and hypertension and determine which factors could account for any ethnic differences in measures of neuropathy. Categorical variables were compared as simple proportions in the first instance, using the 2 test for significance. Logistic regression models were constructed to calculate odds ratios (ORs) and adjust for important confounders. Interactions with ethnicity were also tested. RESULTS — We studied 360 type 2 diabetic patients (Table 1). Indian Asians (n ⫽ 180) comprised 116 subjects origicare.diabetesjournals.org
Abbott and Associates Table 1—Demographic and clinical characteristics of ethnic groups
n Sex (male/female) Age (years) Duration diabetes (years) Height (m) Weight (kg) BMI (kg/m2) Waist (cm) Men Women Hips (cm) Men Women Waist-to-hip ratio Men Women Fasting plasma glucose (mmol/l) A1C (%) Total cholesterol (mmol/l) HDL cholesterol (mmol/l) Fasting triglycerides (mmol/l) Insulin (mU/l) ␥-Glutamyltransferase (U/l) Creatinine (mol/l) Urinary albumin-to-creatinine ratio Retinopathy (%) Nephropathy (%) Hypertension (%) Myocardial infarction (%) Angina (%) Coronary artery bypass graft (%) Resting heart rate (bpm) Ankle systolic blood pressure (mmHg) Brachial systolic blood pressure (mmHg) ABPI ⬍0.85 (%) Lower limb vascular intervention (%) Claudication (%) TCpO2 (mmHg) Pack-years smoked (%) None ⱕ20 ⬎20 Drink alcohol ⱖ once a week (%) Insulin (%) Oral antidiabetic drugs (%) Antihypertensive drugs (%) Lipid-lowering drugs (%) Other coronary heart disease drugs (%)
Indian Asians
White Europeans
P value*
180 95/85 57.4 ⫾ 9.9 9.4 ⫾ 7.5 1.61 ⫾ 9.3 77.2 ⫾ 14.8 29.7 ⫾ 5.5
180 96/84 59.1 ⫾ 9.7 7.0 ⫾ 5.7 1.65 ⫾ 9.8 93.3 ⫾ 19.3 34.1 ⫾ 6.5
0.9 0.09 0.001 ⬍0.0001 ⬍0.0001 ⬍0.0001
96.7 ⫾ 13.1 97.1 ⫾ 12.8
106.6 ⫾ 12.7 102.7 ⫾ 15.1
⬍0.0001 0.01
99.6 ⫾ 8.1 103.1 ⫾ 11.3
105.4 ⫾ 8.7 111.0 ⫾ 15.6
⬍0.0001 ⬍0.0001
0.97 ⫾ 0.09 0.94 ⫾ 0.08 7.7 ⫾ 2.2 8.1 ⫾ 1.6 4.3 ⫾ 1.0 1.3 ⫾ 0.3 1.4 (1.1, 1.9) 17.1 (9.6, 27.0.1) 35.7 ⫾ 34.4 87.2 ⫾ 31.2 1.5 (0.7, 2.5) 14 6 54 17 23 14 76 ⫾ 14 136 ⫾ 22 123 ⫾ 17 4.0 3 7 61 ⫾ 12
1.01 ⫾ 0.07 0.92 ⫾ 0.08 8.0 ⫾ 2.3 7.9 ⫾ 1.7 4.7 ⫾ 1.1 1.3 ⫾ 0.4 1.7 (1.2, 2.4) 18.2 (11.5, 28.6) 58.7 ⫾ 56.0 85.9 ⫾ 27.0 1.4 (0.6, 3.0) 12 4 74 13 17 9 75 ⫾ 13 142 ⫾ 31 127 ⫾ 17 9.1 9 15 56 ⫾ 13
⬍0.0001 0.2 0.2 0.3 0.004 0.7 0.005 0.44 ⬍0.0001 0.7 0.6 0.6 0.3 0.0002 0.3 0.2 0.1 0.8 0.06 0.02 0.05 0.03 0.01 ⬍0.0001 ⬍0.0001
74 14 11 5 19 87 61 57 15
36 22 42 42 23 76 77 71 18
⬍0.0001 0.4 0.007 0.001 0.006 0.4
Data are % prevalence, means ⫾ SD, or geometric means (25th, 75th percentiles). *P value for ethnic difference.
nating from Pakistan (64.4%), 26 subjects from India (14.4%), 31 subjects from Bangladesh (17.2%), and 7 subjects classified as Indian Asian– other (3.9%). The white European group (n ⫽ 180) comprised 157 subjects who were white Britcare.diabetesjournals.org
ish (87.2%) and 17 who were white Irish (9.4%) with the remainder (n ⫽ 6) being white– other (3.3%). Duration of diabetes was shorter in Europeans than in Indian Asians (P ⬍ 0.01). Europeans were taller with a higher
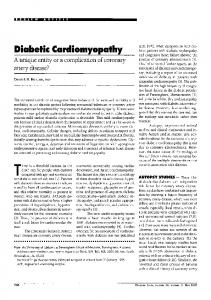
BMI, greater smoking prevalence, and higher alcohol intake (P ⬍ 0.001). Significantly more Indian Asians were treated with oral hypoglycemic agents, whereas they were much less likely to be taking lipid-lowering or antihypertensive therapies (P ⬍ 0.01). Clinical signs and symptoms of neuropathy Neuropathy signs (NDS ⱖ6) were more prevalent in Europeans (36 of 180, 20%) than Indian Asians (27 of 178, 15%), although this was not statistically significant (P ⫽ 0.2) (Fig. 1A). Overall symptom reporting did not differ by ethnicity (total mean NSC score for Europeans 2.2 ⫾ 2.2 and for Indian Asians 2.2 ⫾ 2.1, P ⫽ 0.9); however, Europeans reported greater loss of peripheral sensation (0.29 ⫾ 0.77 vs. 0.13 ⫾ 0.45, P ⫽ 0.018). Large nerve fiber function Indian Asians had higher mean values for all motor and sensory NCVs and amplitudes than Europeans (NCV and response amplitude Z scores 0.07 ⫾ 0.62 and 0.08 ⫾ 0.69 [mean ⫾ SD] in Indian Asians and ⫺0.11 ⫾ 0.60 [P ⫽ 0.007] and ⫺0.13 ⫾ 0.62 [P ⫽ 0.003] in Europeans (Fig. 1B). VPT did not differ by ethnicity. Small nerve fiber function Cool detection threshold (Indian Asians 10.1 ⫾ 4.0 and Europeans 10.7 ⫾ 4.8; P ⫽ 0.2) or heat pain threshold (Indian Asians 19.9 ⫾ 1.5 and Europeans 20.0 ⫾ 1.7, P ⫽ 0.4) did not differ by ethnicity. HRDB was greater in Indian Asians (10.8 ⫾ 7.4 bpm) versus Europeans (8.5 ⫾ 5.3 bpm; P ⫽ 0.002) (Fig. 1C), whereas the postural fall in systolic blood pressure did not differ. The overall prevalence of small fiber neuropathy was significantly lower in Indian Asians (32%) than in Europeans (43%; P ⫽ 0.03) (Fig. 1A). Ethnic differences in vascular function Peripheral vascular function was more favorable in Indian Asians than Europeans, i.e., Indian Asians were less likely to report claudication or have an abnormal ABPI, and had higher TCpO2 levels (Table 1). Adjustment for ethnic differences in smoking status, height, lipid levels, A1C, or ABPI had no impact on the ethnic difference in TCpO 2 levels (data not shown).
DIABETES CARE, VOLUME 33, NUMBER 6, JUNE 2010
1327
Ethnic differences in diabetic neuropathy neuropathy in never smokers, and the ethnic difference persisted (n ⫽ 178): 31% in Indian Asians and 52% in Europeans (P ⫽ 0.009). Only BMI appreciably accounted for the ethnic difference in autonomic small fiber function, i.e., HRDB (10.4 vs. 9.1 bpm, P ⫽ 0.08, in Indian Asians vs. Europeans) (Table 3); height alone had negligible impact.
Figure 1—Indexes of neuropathy by ethnicity: Indian Asians and Europeans. A: Neuropathy prevalence (percent). B: Nerve conduction studies (Z scores) (mean ⫾ SE). C: Autonomic nerve function (mean ⫾ SD). *Significantly different between the two groups, P ⬍ 0.05. **Significantly different between the two groups, P ⬍ 0.01. SBP, systolic blood pressure.
Explanations for ethnic differences in large nerve fiber function Smoking had little impact in accounting for the ethnic difference in peripheral nerve large fiber function (NCV Z scores) (Table 2). Height appeared to have the greatest single impact, with a multivariate model, including height, packyears smoked, and TCpO2 substantially attenuating the ethnic difference in nerve function, losing statistical significance (P ⫽ 0.2). An analysis restricted to never smokers showed that Indian Asians maintained greater NCV Z scores than their European counterparts (0.13 [95% CI 0.025– 0.24] versus ⫺0.06 [⫺0.23 to 0.10], P ⫽ 0.05). 1328
Explanations for ethnic differences in small fiber neuropathy The risk (OR) of small fiber neuropathy was 0.61 (P ⫽ 0.03) in Indian Asians versus Europeans (Table 3). Adjustment for the lower smoking rates and shorter height in Indian Asians did not appreciably alter this ethnic difference in risk, but some attenuation was observed with adjustment for ABPI and for TCpO2. A multivariate model with all of these factors attenuated the OR to 0.70 (P ⫽ 0.2). The impacts of ABPI (P ⫽ 0.02) and TCpO2 (P ⫽ 0.02) in this multivariate model were statistically significant and independent of each other. As a sensitivity analysis, we also compared small fiber
DIABETES CARE, VOLUME 33, NUMBER 6, JUNE 2010
CONCLUSIONS — We show, using objective measurements, that both somatic and autonomic nerve function is better preserved in Indian Asians than in Europeans with diabetes. Healthier peripheral vascular function was the key modifiable determinant of this protection from neuropathy in Indian Asians with independent contributions from low smoking rates and shorter height. Although others have reported favorable levels of neuropathy in Indian Asians, these reports relied largely on subjective, crude measures of advanced neuropathy, and explanations for ethnic differences were not explored (4,5,15). Indian Asians with newly diagnosed diabetes in the UK Prospective Diabetes Study had lower rates of neuropathy than Europeans (4 compared with 13%) diagnosed using the vibration sensation threshold (15). However, individuals with preexisting CVD were excluded, and, as this is more common in Indian Asians, may have biased the comparison. In our previous large, population-based studies, we also showed that the prevalence of neuropathy was significantly lower in Indian Asians than in Europeans with diabetes (4,5), but again objective measures were not used. Varying rates of peripheral neuropathy from the Indian subcontinent have been reported (3– 25%) (16,17), but because assessment methods vary, it is difficult to compare these rates directly with European samples. Height is often cited as a key risk factor for neuropathy; it is therefore not surprising that the shorter height of Indian Asians contributes to their lower risk (18). The additional significant contributions from lower smoking rates plus favorable peripheral blood flow indicators (TCpO2 and ABPI) support the vascular theory for neuropathy etiology (19). Others report that both macrovascular (systolic blood pressure, conduit arterial stiffening, and thickness) (20) and microvascular (reduced capillary blood flow due to endothelium-dependent and independent mechanisms) (21) abnormalities are key determinants of nerve fiber funccare.diabetesjournals.org
Abbott and Associates Table 2—Large nerve fiber function (mean NCV Z score for sural, peroneal, tibial, radial, and ulnar nerves combined) with 95% CIs, by ethnicity Adjustment factors Unadjusted Age ⫹ diabetes duration Age ⫹ duration ⫹ height Age ⫹ duration ⫹ pack-years smoked Age ⫹ duration ⫹ TCpO2 Age ⫹ duration ⫹ height ⫹ pack-years smoked ⫹ TCpO2
Indian Asian
European
P value*
0.07 (⫺0.02 to 0.16) 0.09 (0.002 to 0.18) 0.04 (⫺0.04 to 0.12)
⫺0.11 (⫺0.20 to ⫺0.02) ⫺0.13 (⫺0.22 to ⫺0.04) ⫺0.08 (⫺0.16 to 0.01)
0.007 0.001 0.06
0.07 (⫺0.03 to 0.16) 0.11 (0.02 to 0.20)
⫺0.11 (⫺0.20 to ⫺0.01) ⫺0.09 (⫺0.18 to 0.001)
0.01 0.003
0.05 (⫺0.04 to 0.14)
⫺0.03 (⫺0.12 to 0.06)
0.2
*P value for ethnic difference.
tion in type 2 diabetes. These abnormalities are strongly correlated in individuals and populations. However, we show that despite the anticipated greater macrovascular burden, Indian Asians have substantially better TCpO 2 (not wholly explained by lower smoking rates), and that this contributes to the favorable neuropathy status. TCpO2, or tissue oxygenation, in the lower limb is an indicator of “upstream blood flow” and can be affected by large vessel occlusion and arteriole and/or capillary function (22). In addition, we show that peripheral arterial disease, as measured by ABPI, is lower in Indian Asians and makes a significant and independent contribution to account for ethnic differences in peripheral neuropa-
thy, comparable to TCpO2. Our TCpO2 data, therefore, more likely reflect microvessel (capillary and arteriole) function rather than large vessel flow. These findings suggest that microvascular flow may explain ethnic differences in the etiology of neuropathy. The reason that Asians have better microvascular function, despite poorer macrovascular function is, as yet, unclear. Elsewhere, glycemia, triglycerides, and insulin resistance have been linked with clinical polyneuropathy in type 2 diabetes (23,24). However, we found that these factors had little effect on accounting for ethnic differences and were overwhelmed by the impact of tissue oxygenation, probably indicating that this
Table 3—Regression modeling: small fiber neuropathy by ethnicity Risk of small fiber neuropathy in Indian Asians vs. Europeans with adjustment for covariates Adjustment factors Unadjusted Age ⫹ diabetes duration Age ⫹ duration ⫹ pack-years smoked Age ⫹ duration ⫹ pack-years smoked ⫹ height Age ⫹ duration ⫹ pack-years smoked ⫹ ABPI ⬍0.85 Age ⫹ duration ⫹ pack-years smoked ⫹ TCpO2 Multivariate model: age ⫹ duration ⫹ pack-years smoked ⫹ height ⫹ ABPI ⬍0.85 ⫹ TCpO2
Odds ratio (95% CI)
P value*
0.61 (0.39–0.95) 0.58 (0.37–0.93) 0.58 (0.35–1.00) 0.61 (0.36–1.02) 0.64 (0.38–1.08) 0.63 (0.37–1.08)
0.03 0.02 0.04 0.06 0.09 0.09
0.70 (0.40–1.21)
0.2
Autonomic nerve function (heart rate decline in response to deep breathing, bpm) by ethnicity Odds ratio (95% CI) Adjustment factors Unadjusted Age ⫹ diabetes duration Age ⫹ duration ⫹ height Age ⫹ duration ⫹ weight Age ⫹ duration ⫹ BMI *P value for ethnic difference.
care.diabetesjournals.org
Indian Asian
European
P value*
10.8 (9.8–11.8) 10.8 (9.8–11.7) 10.9 (9.9–11.8) 10.4 (9.4,11.4) 10.4 (9.4–11.3)
8.5 (7.5–9.5) 8.7 (7.8–9.6) 8.6 (7.7–9.6) 9.0 (8.0–10.0) 9.1 (8.1–10.0)
0.002 0.003 0.002 0.07 0.08
is a better downstream measure of the composite of vascular insults. The marked ethnic differences in objective nerve electrophysiological measures were largely not reflected in reported neuropathic symptoms or elicited signs. This may reflect the greater sensitivity of electrophysiology, detecting very early signs of disease, and the subjectivity of signs and symptoms. The latter is particularly important in ethnic comparison studies, in which interpretation and reporting may differ. Our findings underline the importance of objective assessments. Our study is large and representative of the general population with diabetes, as sampling was from primary rather than hospital care, the former having universal coverage. In addition, because health care is free at the point of delivery, differences in access to health care should not have influenced our findings. One limitation of this study is that it is cross-sectional, whereas a longitudinal assessment of neuropathy development would substantiate our findings. A possible explanation for the lower prevalence of neuropathy observed in Indian Asians is that the elevated risk of premature cardiovascular death had selected out Indian Asians with current or high risk of subsequent neuropathy. However, selective mortality cannot be the full explanation because we estimate that premature CVD mortality would have to be 3- to 4-fold greater, rather than the observed 1.5- to 2-fold increase in younger Indian Asians than Europeans, to account for the lower neuropathy prevalence detected in our study. We therefore conclude that both peripheral and autonomic neuropathy are less prevalent in Indian Asians than in Europeans with type 2 diabetes. Furthermore, lower height, less smoking, and a more favorable microcirculation, rather than conventional risk factors such as glycemic control and hyperlipidemia, seem to account independently for the Indian Asian preservation of peripheral nerve function. These data may explain why Indian Asians are protected against diabetic foot ulceration, as sensitivity to trauma via peripheral large fiber function and autonomic neurogenic control of cutaneous blood flow are primary factors in the risk of plantar tissue breakdown and delayed wound healing (4,25).
Acknowledgments — This study was supported by Diabetes U.K.
DIABETES CARE, VOLUME 33, NUMBER 6, JUNE 2010
1329
Ethnic differences in diabetic neuropathy No potential conflicts of interest relevant to this article were reported. References 1. McKeigue PM, Shah B, Marmot MG. Relation of central obesity and insulin resistance with high diabetes prevalence and cardiovascular risk in South Asians. Lancet 1991;337:382–386 2. Forouhi NG, Sattar N, Tillin T, McKeigue PM, Chaturvedi N. Do known risk factors explain the higher coronary heart disease mortality in South Asian compared with European men? Prospective follow-up of the Southall and Brent studies, UK. Diabetologia 2006;49:2580 –2588 3. UKPDS Group. UK Prospective Diabetes Study 32: Ethnicity and cardiovascular disease. The incidence of myocardial infarction in white, South Asian, and AfroCaribbean patients with type 2 diabetes. Diabetes Care 1998;21:1271–1277 4. Abbott CA, Garrow AP, Carrington AL, Morris J, Van Ross ER, Boulton AJ. Foot ulcer risk is lower in South-Asian and African-Caribbean compared with European diabetic patients in the U.K.: the North-West Diabetes Foot Care Study. Diabetes Care 2005;28:1869 –1875 5. Chaturvedi N, Abbott CA, Whalley A, Widdows P, Leggetter SY, Boulton AJ. Risk of diabetes-related amputation in South Asians vs. Europeans in the UK. Diabet Med 2002;19:99 –104 6. Yates AP, Laing I. Age-related increase in haemoglobin A1c and fasting plasma glucose is accompanied by a decrease in  cell function without change in insulin sensitivity: evidence from a cross-sectional study of hospital personnel. Diabet Med 2002;19:254 –258 7. Rose GA. The diagnosis of ischaemic heart pain and intermittent claudication in field surveys. Bull World Health Organ 1962; 27:645– 658 8. Leng GC, Fowkes FG. The Edinburgh Claudication Questionnaire: an improved version of the WHO/Rose Questionnaire for use in epidemiological surveys. J Clin Epidemiol 1992;45:1101–1109 9. Apfel SC, Asbury AK, Bril V, Burns TM,
1330
10.
11.
12.
13.
14.
15.
16.
Campbell JN, Chalk CH, Dyck PJ, Dyck PJ, Feldman EL, Fields HL, Grant IA, Griffin JW, Klein CJ, Lindblom U, Litchy WJ, Low PA, Melanson M, Mendell JR, Merren MD, O’Brien PC, Rendell M, Rizza RA, Service FJ, Thomas PK, Walk D, Wang AK, Wessel K, Windebank AJ, Ziegler D, Zochodne DW. Positive neuropathic sensory symptoms as end points in diabetic neuropathy trials. J Neurol Sci 2001;189: 3–5 Abbott CA, Carrington AL, Ashe H, Bath S, Every LC, Griffiths J, Hann AW, Hussein A, Jackson N, Johnson KE, Ryder CH, Torkington R, Van Ross ER, Whalley AM, Widdows P, Williamson S, Boulton AJ. The North-West Diabetes Foot Care Study: incidence of, and risk factors for, new diabetic foot ulceration in a community-based patient cohort. Diabet Med 2002;19:377–384 Young MJ, Every N, Boulton AJ. A comparison of the neurothesiometer and biothesiometer for measuring vibration perception in diabetic patients. Diabetes Res Clin Pract 1993;20:129 –131 Quattrini C, Tavakoli M, Jeziorska M, Kallinikos P, Tesfaye S, Finnigan J, Marshall A, Boulton AJ, Efron N, Malik RA. Surrogate markers of small fiber damage in human diabetic neuropathy. Diabetes 2007;56:2148 –2154 Weatherley BD, Nelson JJ, Heiss G, Chambless LE, Sharrett AR, Nieto FJ, Folsom AR, Rosamond WD. The association of the ankle-brachial index with incident coronary heart disease: the Atherosclerosis Risk In Communities (ARIC) study, 1987–2001. BMC Cardiovasc Disord 2007;7:3 Kalani M, Brismar K, Fagrell B, Ostergren J, Jo¨rneskog G. Transcutaneous oxygen tension and toe blood pressure as predictors for outcome of diabetic foot ulcers. Diabetes Care 1999;22:147–151 UKPDS Group. UK Prospective Diabetes Study XII: Differences between Asian, Afro-Caribbean and white Caucasian type 2 diabetic patients at diagnosis of diabetes. Diabet Med 1994;11:670 – 677 Ramachandran A, Snehalatha C, Sasikala R, Satyavani K, Vijay V. Vascular compli-
DIABETES CARE, VOLUME 33, NUMBER 6, JUNE 2010
17.
18.
19.
20.
21.
22.
23.
24.
25.
cations in young Asian Indian patients with type 1 diabetes mellitus. Diabetes Res Clin Pract 2000;48:51–56 Weerasuriya N, Siribaddana S, Dissanayake A, Subasinghe Z, Wariyapola D, Fernando DJ. Long-term complications in newly diagnosed Sri Lankan patients with type 2 diabetes mellitus. Q J Med 1998; 91:439 – 443 Tesfaye S, Stevens LK, Stephenson JM, Fuller JH, Plater M, Ionescu-Tirgoviste C, Nuber A, Pozza G, Ward JD. Prevalence of diabetic peripheral neuropathy and its relation to glycaemic control and potential risk factors: the EURODIAB IDDM Complications Study. Diabetologia 1996;39: 1377–1384 Tesfaye S, Malik R, Ward JD. Vascular factors in diabetic neuropathy. Diabetologia 1994;37:847– 854 Yokoyama H, Yokota Y, Tada J, Kanno S. Diabetic neuropathy is closely associated with arterial stiffening and thickness in type 2 diabetes. Diabet Med 2007;24: 1329 –1335 Morris SJ, Shore AC, Tooke JE. Responses of the skin microcirculation to acetylcholine and sodium nitroprusside in patients with NIDDM. Diabetologia 1995;38: 1337–1344 Krishnan STM, Rayman G. Microcirculation and Diabetic Foot. In The Foot in Diabetes. 4th ed. Boulton AJM, Cavanagh PR, Rayman G, Eds. Chichester, John Wiley & Sons, 2006, p. 41–50 van de Poll-Franse LV, Valk GD, Renders CM, Heine RJ, van Eijk JT. Longitudinal assessment of the development of diabetic polyneuropathy and associated risk factors. Diabet Med 2002;19:771–776 Wiggin TD, Sullivan KA, Pop-Busui R, Amato A, Sima AA, Feldman EL. Elevated triglycerides correlate with progression of diabetic neuropathy. Diabetes 2009;58: 1634 –1640 Fromy B, Abraham P, Bouvet C, Bouhanick B, Fressinaud P, Saumet JL. Early decrease of skin blood flow in response to locally applied pressure in diabetic subjects. Diabetes 2002;51:1214 –1217
care.diabetesjournals.org