Available at: http://wwwapps.tc.gc.ca/prog/2/UTEC-CETU/Menu.aspx?lang=eng
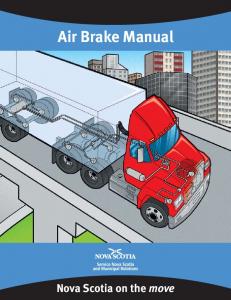
... Honda. Civic. Fuel economy1. (L/100 km) city/combined/highway. 13/11.8/9.8 ...
Choose how you move Exploring Sustainable Transportation in Nova Scotia A Companion Document to the Sustainable Transportation Strategy
Choose how you move Exploring Sustainable Transportation in Nova Scotia A Companion Document to the Sustainable Transportation Strategy April 2013
© Crown Copyright, Province of Nova Scotia, 2013 All photos in this document are property of the Crown unless otherwise indicated.
The Sustainable Transportation Strategy and its companion document Exploring Sustainable Transportation in Nova Scotia are both available online at www.novascotia.ca/sustainabletransportation
Contents Spending................................................................................................................................................1 Greenhouse Gas Emissions..............................................................................................................2 Energy......................................................................................................................................................5 Travel, Modes, and Kilometres........................................................................................................8 Health................................................................................................................................................... 12 References........................................................................................................................................... 15
Spending Spending
Figure 1. Figure Average 1. Average HHousehold ousehold Consumption in Nova Scotia, 2009 Scotia, 2009 Consumption in Nova
2%
Shelter
4% TransportaMon 26%
15%
Household operaMon; Household furnishings and equipment; Clothing Food
16% 20% 17%
(Statistics Canada, 2009A)
Tobacco products and alcoholic beverages; Games of chance (net) Other
(Statistics Canada, 2009A)
Nova Scotia households pend a lot on transportation, econd only to shelter. Asecond bout 20% only of what e consume goes Nova Scotia shouseholds spend a lot son transportation, towshelter. towards About paying for t ransportation w hich i s, o n a verage, a bout $ 8,900 p er y ear. F or t hose w ith a c ar, number 20% of what we consume goes towards paying for transportationthis which is,is likely higher.
on average, about $8,900 per year. For those with a car, this number is likely higher.
Exploring Sustainable Transportation in Nova Scotia A Companion Document to the Sustainable Transportation Strategy
Health care; EducaMon; Personal care; RecreaMon
1
Greenhouse Gas Emissions Greenhouse Gas Emissions
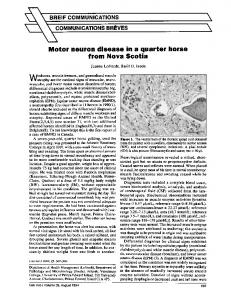
Figure 2. Figure Greenhouse 2. Greenhouse Gas Gas Inventory for Nova Scotia, 2010 Scotia, 2010 Inventory for Nova
TransportaMon, 26%
Exploring Sustainable Transportation in Nova Scotia A Companion Document to the Sustainable Transportation Strategy
Electricity1, 46%
2
Agriculture & Waste, 5% Other Industry, 5% Heat-‐ ResidenMal, 9% Heat-‐ Commercial, 4% (Environment Canada, 2012)
Oil & Gas Sector, 5%
1. Includes electric heat
(Environment Canada, 2012)
Transportation is one of the largest contributors of greenhouse gas (GHG) emissions in Nova Scotia, second only to electricity production. Transportation accounts for approximately 26% or 5310 kt CO2 eq1 . Nova Scotia already has Transportation one of thethat largest contributors of greenhouse gasinitiatives (GHG)will play an stringent regulations for the eis lectricity sector are spurring emissions reductions. Transportation important role in helping eet our Scotia, obligation to reduce only overall emissions to production. 10% below 1990 Transportation levels by 2020. emissions inmNova second toGHG electricity
accounts for approximately 26% or 5310 kt CO2 eq1. Nova Scotia already has stringent regulations for the electricity sector that are spurring emissions reductions. Transportation initiatives will play an important role in helping meet our obligation to reduce overall GHG emissions to 10% below 1990 levels by 2020.
1
Kilotonnes of carbon dioxide equivalent
1
Kilotonnes of carbon dioxide equivalent
Figure 3. Nova Scotia Transportation Sector Figure 3. Nova Scotia TGas ransportation Sector G2010 reenhouse Gas Emissions, 2010 Greenhouse Emissions,
80% 70%
22% Heavy Duty Vehicle
50% 40%
Passenger Vehicle and Light Truck
30%
49% 20% 10% 0%
4% Road TransportaMon
Civil AviaMon (DomesMc AviaMon)
2% Railways
9%
14%
NavigaMon Other (DomesMc Marine) TransportaMon (ORV's and pipelines)
(Environment Canada, 2012) (Environment Canada, 2012)
The transportation sector can be broken down into five segments: road transportation, civil aviation (domestic aviation), railways, navigation (domestic marine), and other (including off-‐road vehicles and pipelines). The road transportation The transportation sector can be broken down into five segments: road segment is by far the largest source of GHG emissions, accounting for approximately 70% of the transportation sector’s transportation, civiland aviation (domestic emissions. Passenger vehicles light trucks account for aaviation), lmost half of railways, the sector’s tnavigation otal emissions. (domestic
marine), and other (including off-road vehicles and pipelines). The road transportation segment is by far the largest source of GHG emissions, accounting for approximately 70% of the transportation sector’s emissions. Passenger vehicles and light trucks account for almost half of the sector’s total emissions.
Exploring Sustainable Transportation in Nova Scotia A Companion Document to the Sustainable Transportation Strategy
60%
3
Greenhouse Gas Emissions (cont’d.)
Figure 4.
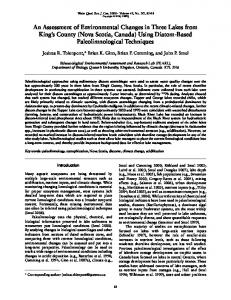
Figure 4. Emissions per Kilometre Kilometre by Transportation Mode1 Emissions per by Transportation Mode1
Exploring Sustainable Transportation in Nova Scotia A Companion Document to the Sustainable Transportation Strategy
4
(Pembina Institute, 2012)
(Pembina Institute, 2012)
Different modes of transportation contribute different amounts of GHG emissions. Across North America, consumer preferences show a trend towards larger vehicles, such as sport utility vehicles (SUVs), pick-‐up trucks, and minivans. Larger Different ofemissions transportation diff erent amounts of GHG vehicles produce modes more GHG than smaller contribute vehicles. Busses produce fewer GHG emissions per pemissions. assenger than most types of passenger vehicles. Walking and cycling ppreferences roduce no GHG eshow missions t all. towards larger vehicles, Across North America, consumer aatrend
such as sport utility vehicles (SUVs), pick-up trucks, and minivans. Larger vehicles produce more GHG emissions than smaller vehicles. Busses produce fewer GHG emissions per passenger than most types of passenger vehicles. Walking and cycling produce no GHG emissions at all.
1
Emissions are for a typical vehicle in each category. Bus is assumed to have 10 passengers, light rail transit to have 23.6 passengers. Emission factors based on those from Transport Canada, Urban Transportation Emissions Calculator. Available at: http://wwwapps.tc.gc.ca/prog/2/UTEC-‐CETU/Menu.aspx?lang=eng
Note: Plug-in Hybrid vehicle emissions may vary depending on electricity fuel source.
Emissions are for a typical vehicle in each category. Bus is assumed to have 10 passengers, light rail transit to have 23.6 passengers. Emission factors based on those from Transport Canada, Urban Transportation Emissions Calculator. Available at: http://wwwapps.tc.gc.ca/prog/2/UTEC-CETU/Menu.aspx?lang=eng
1
Note: Plug-in Hybrid vehicle emissions may vary depending on electricity fuel source.
Energy Energy
Figure 5. Nova Scotia Energy Demand by End-Use Sector, 2009 Figure 5. Nova Scotia Energy Demand by End-‐Use Sector, 2009
40%
38%
35% 30%
20%
18% 14%
15% 10% 5%
5%
2%
0%
TransportaMon Agriculture
(Statistics Canada, 2011)
ResidenMal
Public Commercial administraMon and other insMtuMonal
Industrial (Statistics Canada, 2011)
Transportation is the largest energy consuming sector in Nova Scotia, accounting for 38% (62.4 Petajoules) of Nova Scotia’s Transportation is the largest energy consuming sector in Nova Scotia, accounting total energy use. That’s more than the commercial and industrial sectors combined.
for 38% (62.4 Petajoules) of Nova Scotia’s total energy use. That’s more than the commercial and industrial sectors combined.
Exploring Sustainable Transportation in Nova Scotia A Companion Document to the Sustainable Transportation Strategy
23%
25%
5
Energy (cont’d.)
Figure 6. Figure 6. Transportation Transportation Energy Use by FUse uel Source, 2010 Source, 2010 Energy by Fuel
0.1 8.7 4.1
Exploring Sustainable Transportation in Nova Scotia A Companion Document to the Sustainable Transportation Strategy
Motor Gasoline
6
Diesel Fuel Oil Heavy Fuel Oil AviaMon Turbo Fuel
29.8
57.2
Propane
(Natural Resources Canada, 2012A)
(Natural Resources Canada, 2012A)
only is the stransportation sector the largest consuming sector in Not only is Not the transportation ector the largest energy consuming sector ienergy n Nova Scotia, but it is also completely Nova Scotia, but it is also completely dependent on refined petroleum products. dependent on refined petroleum products. In 2010, 87% of the fuel used in transportation was either motor gasoline or diesel fuel. In 2010, 87% of the fuel used in transportation was either motor gasoline or
diesel fuel.
Figure 7. Gasoline Prices inCanada Canada and2004-‐2012 Halifax, 2004-2012 Figure 7. Gasoline Prices in and Halifax,
160
140
100 Canada
80
Halifax
60
40
2004
2005
2006
2007
2008
2009
2010
2011
2012
2004-‐01-‐06 2005-‐01-‐06 2006-‐01-‐06 2007-‐01-‐06 2008-‐01-‐06 2009-‐01-‐06 2010-‐01-‐06 2011-‐01-‐06 2012-‐01-‐06
(Natural Resources Canada, 2012B)
(Natural Resources Canada, 2012B)
The last eight years alone have seen significant fluctuation in the price of gasoline.
The last eour ight years alone have seen ssystem’s ignificant fluctuation in the pof rice of gasoline. With oon ur transportation system’s high With transportation high level dependence fuels, price volatility level of dependence on fuels, price volatility can severely impact Nova Scotians.
can severely impact Nova Scotians.
Exploring Sustainable Transportation in Nova Scotia A Companion Document to the Sustainable Transportation Strategy
Cents/litre
120
7
Travel, Modes, and Kilometres Travel, Modes, and Kilometres
Figure 8. Median Commuting Distance, 2006
Figure 8. Median Commuting Distance, 2006 10 9
8
Kilometres (km)
Exploring Sustainable Transportation in Nova Scotia A Companion Document to the Sustainable Transportation Strategy
8 7
8.7
8.4 7.8
7.6
7.6
6.8 6.1
6.1
6.5
6.2
6 5 4
4.5 3.9
3
2.9 2.1
2 1 0
(Statistics Canada, 2006A)
(Statistics Canada, 2006A)
Nova Scotians ommute some of the longest distances to w ork compared to other to provinces. Only Ontario cto ommuters NovacScotians commute some of the longest distances work compared other travel further to get to work.
provinces. Only Ontario commuters travel further to get to work.
2012 Hyundai Elantra
2013 2012 Ford F150 Toyota Prius 4WD
2010 Honda Civic
13/11.8/9.8 Fuel economy1 (L/100 km) city/combined/highway
8.4/7.4/6.2
16.8/15.7/13
4.6/4.7/4.9
9/8.1/6.9
Avg. annual km driven in NS
17400
17400
17400
17400
17400
GHG emissions (t CO2 eq/year)
4.8
3.0
6.4
1.9
3.3
Annual fuel cost2
$2567
$1610
$3415
$1022
$1762
2008 Ford Escape
The types of cars we drive can significantly impact how much we pay for fuel and the amount of GHG emissions (as well as other air pollutants) we produce.
1 2
Fuel economy figures are based on the US. EPA’s Fuel Economy Guide, available at http://www.fueleconomy.gov/ Annual fuel cost based on $1.25 cents/litre, the average price of gasoline in Halifax in 2011.
Exploring Sustainable Transportation in Nova Scotia A Companion Document to the Sustainable Transportation Strategy
Figure 9. Fuel costs and emissions for various vehicles in Nova Scotia
9
Travel, Modes, and Kilometres (cont’d.)
Figure 10. Figure 10. Percentage commuters by mby ode, mode, 2006 2006 Percentage ofof commuters
1% 1%
100%
10%
Exploring Sustainable Transportation in Nova Scotia A Companion Document to the Sustainable Transportation Strategy
90%
8% 6%
80%
12%
70%
11%
1%
2%
11%
1%
6% 11% 8%
1% Other method Bicycle Walked
60%
Public transit
50%
Vehicle (passenger)
40%
65%
30%
73%
72%
Nova ScoMa
Canada
Vehicle (driver)
20% 10% 0%
Halifax Regional Municipality
(Statistics Canada, 2006B)
(Statistics Canada, 2006B)
In Nova Scotia, the vast majority (73%) of commuters drive to work by themselves in a car while 11% get a ride in a vehicle In Nova Scotia, the vast majority (73%) of commuters drive to work by themselves as a passenger. 15% take transit, walk or ride a bicycle to work. Commuters in Nova Scotia drive alone more than the in aacar while getto a7ride apvehicle asless a passenger. 15% take(6% transit, walk national verage (73% 11% compared 2%), uin sed ublic transit than the national average compared to 11%), and orwride work. inaverage Nova (Scotia driveto alone either alked aor bicycle bicycled sto lightly more Commuters than the national 9% compared 7%). more than the
national average (73% compared to 72%), used public transit less than the national average (6% compared to 11%), and either walked or bicycled slightly more than the national average (9% compared to 7%).
10
Figure 11. Figure 11.Average Average ddistance istance driven, 2009 2009 driven, 20
Kilometers (000)
16
15.1 15.1
14 12
16.2
16.1 14.8
15
15.3
16.1
15.4 12.9 13.2 11
10 8
6.8
6 4 2 0
(Transport Canada, 2010)
(Transport Canada, 2010)
In 2009, passenger vehicles and light trucks in Nova Scotia drove on average In 2009, passenger and light tin rucks in Nova Scotia drove on average 17,400 km, the most in Canada. 17,400vehicles km, the most Canada.
Exploring Sustainable Transportation in Nova Scotia A Companion Document to the Sustainable Transportation Strategy
17.4
18
11
Health Health
Figure 12. Proportion of Students meeting minimum Figure 12. Proportion of Students meeting minimum physical activity guidelines, 2009-‐10 physical activity guidelines, 2009-10
Exploring Sustainable Transportation in Nova Scotia A Companion Document to the Sustainable Transportation Strategy
12
(Government of Nova Scotia, 2012A) (Government of Nova Scotia, 2012A)
In Nova Scotia, physical levels been on a downward trend. Lessofthan 307 students Less than 30 per cent grade In Nova Scotia, physical activity levelsactivity have been on ahave downward trend. and 5 per cent grade 11 students (and less 1 per cent grade11 11students girls) now(and meetless the than minimum per of cent of grade 7 students andthan 5 per cent ofof grade 1 perguidelines. The declinecent in activity from11grades to 7 meet appears be growing, especially for (Government of from Nova Scotia, of grade girls) 3now thetominimum guidelines. Thegirls. decline in activity 2012B) grades 3 to 7 appears to be growing, especially for girls. (Government of Nova Scotia, 2012B)
Figure 13. Proportion of Students with Body Mass Index classified or obese Figure 1as 3. Poverweight roportion of Students with Body Mass Index classified as overweight or obese
(Government of Nova Scotia , 2012A) (Government of Nova Scotia, 2012A)
rise in childhood andchronic preventable disease global issue. In one in three The rise inThe childhood obesity andobesity preventable diseasechronic is a global issue. is InaNova Scotia today, children and youth is overweight rates ofand unhealthy sedentary andrates inactivity are Nova Scotia today, oneorinobese, threeand children youth eating, is overweight orbehaviour, obese, and It is unclear whether much higher. Our rates of chronic disease are among the highest in the country. of unhealthy eating, sedentary behaviour, and inactivity are much higher. Our ratesrates of overweight and obesity may be leveling off in Nova Scotia, as seen in some other places. In any case, rates are of chronic disease are of among the highest the country. It is unclear whether rates unacceptably high. (Government Nova Scotia, 2012B).in of overweight and obesity may be leveling off in Nova Scotia, as seen in some other places. In any case, rates are unacceptably high. (Government of Nova Scotia, 2012B).
Exploring Sustainable Transportation in Nova Scotia A Companion Document to the Sustainable Transportation Strategy
13
Health (cont’d.)
Figure 14. Self-Reported Overweight and Obesity Rate of Adults Scotia, 2010 and Obesity Rate of Adults in Nova Scotia, 2010 Figure 14.in SNova elf-‐Reported Overweight
500,000 450,000
14
PopulaMon
Exploring Sustainable Transportation in Nova Scotia A Companion Document to the Sustainable Transportation Strategy
400,000 350,000
Nova ScoMa Males
300,000
Females
250,000 200,000 150,000
2005
2007
2008
2009
2010
(Statistics Canada, 2010)
(Statistics Canada, 2010)
Overweight and obesity rates have increased over the 2005-2010 time periods in Overweight and obesity rates have increased over the 2005-‐2010 time periods in adults as well. Our transportation adults as well. Our transportation behaviours contribute to sedentary lifestyles and behaviours contribute to sedentary lifestyles and encourage living further from work, making people more dependent on encourage living further from making tpeople more dependent on vehicle vehicle travel. Sustainable transportation offers work, the opportunity o address this trend by encouraging less dependence on travel. Sustainable transportation offers the opportunity to address this trend by private automobiles and more physical activity. encouraging less dependence on private automobiles and more physical activity.
References Environment Canada (2012) National inventory report: greenhouse gas sources and sinks in Canada 1990-2009. Retrieved from http://www.ec.gc.ca/Publications/default. asp?lang=En&xml=A07097EF-8EE1-4FF0-9AFB-6C392078D1A9 Government of Nova Scotia (2012A) Keeping Pace: Physical activity and healthy eating among children and youth, key findings from the 2009-10 study. Retrieved from http://www.gov.ns.ca/hpp/pasr/KeepingPaceReport.pdf
Natural Resources Canada (2012A) Comprehensive energy use database. Retrieved from http://oee.nrcan.gc.ca/corporate/statistics/neud/dpa/ tablestrends2/tran_ns_1_e_4.cfm?attr=0 Natural Resources Canada (2012B) Fuel Focus. Retrieved from http://www.nrcan.gc.ca/energy/1374 Institute (2012) Behind the Wheel: Opportunities for Canadians to drive less, reduce pollution and save money. Retrieved from http://www.pembina.org/pub/2379 Statistics Canada (2006A) 2006 Census of population- Median commuting distance of workers (in kilometres), Canada, provinces and territories, 1996, 2001 and 2006. Retrieved from http://www12.statcan.ca/census-recensement/2006/as-sa/97-561/ table/t2-eng.cfm Statistics Canada (2006B) 2006 Census of population- topic based tabulations, mode of transportation- Nova Scotia. Retrieved from http://www12.statcan.ca/census-recensement/2006/dp-pd/tbt/Rpeng.cfm?TABID=0&LANG=E&A=R&APATH=3&DETAIL=0&DIM=1&FL=A&FREE=0&G C=01&GID=855643&GK=1&GRP=1&O=D&PID=95839&PRID=0&PTYPE=88971,9715 4&S=0&SHOWALL=0&SUB=0&Temporal=2006&THEME=76&VID=13608&VNAMEE= &VNAMEF=&D1=0&D2=0&D3=0&D4=0&D5=0&D6=0
Exploring Sustainable Transportation in Nova Scotia A Companion Document to the Sustainable Transportation Strategy
Government of Nova Scotia (2012B) Thrive! A Plan for a Healthier Nova Scotia. Available at http://thrive.novascotia.ca
15
References (cont’d.)
Statistics Canada (2009A) Spending patterns in Canada. Retrieved from http://www5.statcan.gc.ca/access_acces/alternative_alternatif. action?l=eng&loc=http://www.statcan.gc.ca/pub/62-202-x/62-202-x2008000-eng. pdf&t=Spending%20Patterns%20in%20Canada Statistics Canada (2010) Body mass index, overweight or obese, self-reported, adult, by sex, provinces and territories. Statistics Canada, CANSIM, table 105-0501. Retrieved from http://www40.statcan.gc.ca/l01/cst01/health82a-eng.htm
Exploring Sustainable Transportation in Nova Scotia A Companion Document to the Sustainable Transportation Strategy
Statistics Canada (2011) Report on energy supply and demand in Canada. Retrieved from http://www.statcan.gc.ca/pub/57-003-x/57-003-x2009000-eng.pdf
16
Transport Canada (2010) Transportation in Canada: Addendum and figures. Retrieved from http://www.tc.gc.ca/media/documents/policy/addendum2010.pdf
Front cover middle photo credit: Halifax Cycling Coalition.