Research article
Expression of an activating mutation in the gene encoding the KATP channel subunit Kir6.2 in mouse pancreatic β cells recapitulates neonatal diabetes Christophe A. Girard,1 F. Thomas Wunderlich,2 Kenju Shimomura,1 Stephan Collins,3 Stephan Kaizik,1 Peter Proks,1 Fernando Abdulkader,3,4 Anne Clark,3 Vicky Ball,1 Lejla Zubcevic,1 Liz Bentley,5 Rebecca Clark,1 Chris Church,5 Alison Hugill,5 Juris Galvanovskis,3 Roger Cox,5 Patrik Rorsman,3 Jens C. Brüning,2 and Frances M. Ashcroft1 1Henry
Wellcome Centre for Gene Function, Department of Physiology, Anatomy and Genetics, University of Oxford, Oxford, United Kingdom. of Mouse Genetics and Metabolism, Institute for Genetics, University of Cologne and Center of Molecular Medicine Cologne (CMMC), Cologne, Germany. 3The Oxford Centre for Diabetes, Endocrinology and Metabolism, Churchill Hospital, Oxford, United Kingdom. 4Department of Physiology and Biophysics, Institute of Biomedical Sciences, University of São Paulo, São Paulo, Brazil. 5MRC Harwell, Medical Research Council, Harwell, Oxfordshire, United Kingdom.
2Department
Neonatal diabetes is a rare monogenic form of diabetes that usually presents within the first six months of life. It is commonly caused by gain-of-function mutations in the genes encoding the Kir6.2 and SUR1 subunits of the plasmalemmal ATP-sensitive K+ (KATP) channel. To better understand this disease, we generated a mouse expressing a Kir6.2 mutation (V59M) that causes neonatal diabetes in humans and we used Cre-lox technology to express the mutation specifically in pancreatic β cells. These β-V59M mice developed severe diabetes soon after birth, and by 5 weeks of age, blood glucose levels were markedly increased and insulin was undetectable. Islets isolated from β-V59M mice secreted substantially less insulin and showed a smaller increase in intracellular calcium in response to glucose. This was due to a reduced sensitivity of KATP channels in pancreatic β cells to inhibition by ATP or glucose. In contrast, the sulfonylurea tolbutamide, a specific blocker of KATP channels, closed KATP channels, elevated intracellular calcium levels, and stimulated insulin release in β-V59M β cells, indicating that events downstream of KATP channel closure remained intact. Expression of the V59M Kir6.2 mutation in pancreatic β cells alone is thus sufficient to recapitulate the neonatal diabetes observed in humans. β-V59M islets also displayed a reduced percentage of β cells, abnormal morphology, lower insulin content, and decreased expression of Kir6.2, SUR1, and insulin mRNA. All these changes are expected to contribute to the diabetes of β-V59M mice. Their cause requires further investigation. Introduction Neonatal diabetes (ND) is a rare disease that affects about 1 in 200,000 live births (1). It is defined as diabetes that manifests within the first 6 months of life, and it can be either permanent or transient. Most patients present with diabetes in isolation, but in some patients, diabetes is associated with developmental delay, muscle weakness, and epilepsy. This condition is known as DEND syndrome, an acronym for developmental delay, epilepsy, and neonatal diabetes (1). Approximately 25% of patients develop an intermediate syndrome (iDEND) consisting of ND, developmental delay, and muscle weakness. Around 50% of cases of ND result from gain-of-function mutations in the genes encoding the ATP-sensitive K+ (KATP) channel subunits Kir6.2 (KCNJ11) and sulfonylurea receptor 1 (SUR1) (ABCC8) (2). Glucose metabolism stimulates insulin secretion from pancreAuthorship note: F. Thomas Wunderlich and Kenju Shimomura contributed equally to this work. Conflict of interest: The authors have declared that no conflict of interest exists. Nonstandard abbreviations used: DEND, developmental delay, epilepsy, and neonatal diabetes; FLP, flippase recombinase; FRT, flippase recombinase target; iDEND, intermediate DEND; IRES, internal ribosome entry site; KATP, ATP-sensitive K+ (channel); ND, neonatal diabetes; RIP, rat insulin promoter II; ROSA, R26StopKir6.2V59Mlox/+; SUR, sulfonylurea receptor. Citation for this article: J. Clin. Invest. 119:80–90 (2009). doi:10.1172/JCI35772. 80
atic β cells by closing KATP channels, thereby inducing β cell depolarization, calcium influx, and insulin exocytosis (3). Conversely, opening of KATP channels prevents insulin secretion by causing β cell hyperpolarization. Therefore, gain-of-function KATP channel mutations are predicted to act by clamping the β cell at a hyperpolarized membrane potential and preventing depolarization, calcium influx, and insulin secretion in response to glucose. Sulfonylurea drugs (such as tolbutamide and glibenclamide) are selective KATP channel blockers, and the discovery that their diabetes is caused by an activating KATP channel mutation has enabled many patients to switch from insulin injections to sulfonylurea therapy (1, 3, 4). KATP channels also couple cell metabolism to membrane excitability in many other cell types (3). For example, they regulate electrical activity and transmitter release in many neurons, hormonal release from endocrine cells, and the resting tone of vascular smooth muscle (5). They are also involved in the response to cardiac and cerebral ischemia and to cardiac stress. This probably explains the neurological symptoms found in patients with DEND and iDEND syndrome. Whether extrapancreatic actions are required for the development of diabetes, however, is unknown. The archetypal KATP channel is an octameric complex of Kir6.2 and SUR subunits (SUR1 in β cell and many neurons, SUR2 in muscle; ref. 5). Four Kir6.2 subunits form the channel pore, and
The Journal of Clinical Investigation http://www.jci.org Volume 119 Number 1 January 2009
research article
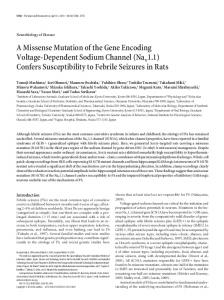
Figure 1 Generation and identification of transgenic mice. (A and B) Targeting strategy. Insertion of the targeting vector ROSA26-STOP-Kir6.2V59M (B) into the ROSA26 locus (A) by homologous recombination in mouse ES cells. (C) Targeted ROSA locus. (D) After Cre-mediated deletion of the STOP cassette, Kir6.2-V59M is expressed under the control of the endogenous ROSA26 promoter. 1–3, ROSA26 exons 1–3; SA, splice acceptor signal; PGK-Neo, neomycin resistance gene; STOP, transcriptional STOP signal; DT-A, diphtheria toxin A; pA, polyadenylation signal; E, EcoRI restriction site; P, PacI restriction site; FRT, flippase recombinase target site. (E) Southern blot analysis of targeted ES clones. Genomic DNA from G418-resistant or WT ES clones was digested with EcoRI and probed with a 5′ external ROSA probe (location indicated in A) to confirm targeting of the ROSA26 locus. In contrast with WT ES cells, the recombinant ES clone shows a 5.1-kb band expected from the targeted ROSA26 allele.
each is associated with a SUR subunit that contributes to the regulation of channel gating. Metabolic regulation is mediated by adenine nucleotides, with ATP closing the channel via Kir6.2 and Mg nucleotides opening it by interaction with SUR1 (6–8). Mutations in Kir6.2 that cause human diabetes reduce the ability of MgATP to close the channel in heterologous systems (1, 3, 9, 10). However, their functional effects in the native environment are less well understood. We therefore used Cre-lox technology to create a mouse strain that conditionally expresses a Kir6.2 mutant (V59M) gene specifically in pancreatic β cells. In human patients, this mutation is the most common cause of iDEND (1). Results Generation of β-V59M mice. We created a mouse strain (β-V59M) that selectively expresses a gain-of-function mutation in the pore-forming subunit of the KATP channel (Kir6.2-V59M) in pancreatic β cells. This was achieved by first generating a mouse strain, R26StopKir6.2V59Mlox/+ (ROSA), in which the Kir6.2-V59M gene, preceded by a loxP-flanked STOP sequence and followed by a flippase (FLP) recombinase target (FRT)–flanked internal ribosome entry site (IRES) GFP cassette, was targeted to the ROSA26 locus by homologous recombination in ES cells (11) (Figure 1, A–D). Single copy integration of the mutant Kir6.2 cDNA was demonstrated by Southern blot analysis of ES cells (Figure 1E). Both heterozygous and homozygous ROSA mice were viable and fertile, did not display any overt phenotype, and were born with normal Mendelian frequency.
In order to generate β-V59M mice, heterozygous ROSA mice were crossed with mice expressing Cre recombinase under the control of the rat insulin promoter II (RIP-Cre) (12). In RIP-Cre mice, Cre recombinase is expressed specifically in pancreatic β cells and a minor population of brain neurons (12, 13). In β-V59M mice, Cre-mediated excision of the loxP-flanked STOP cassette in pancreatic β cells should lead to the expression of both Kir6.2-V59M and GFP, driven by the endogenous ROSA26 promoter (Figure 1A). β-V59M mice were born with normal Mendelian frequency. To confirm that β-V59M mice express the Kir6.2-V59M allele in pancreatic islets, we performed RT-PCR, followed by restriction digest of the PCR products, using cDNA prepared from islets isolated from 5-week-old mice. As shown in Figure 2A, Kir6.2-V59M was expressed in β-V59M islets but was absent in control islets. Expression of the mutant allele was also confirmed by expression of GFP (Figure 2B). To determine whether Cre-mediated excision of the STOP cassette was confined to β cells, we assessed GFP expression in islet cells by immunofluorescence of pancreatic sections. Despite the presence of GFP mRNA, we were unable to detect GFP fluorescence in β-V59M islets, consistent with a low level of expression of this transgene when driven by the weak ROSA26 promoter. β cell–specific expression was confirmed by crossing RIP-Cre mice with Z/EG mice, a reporter mouse line expressing GFP upon Cremediated excision (data not shown) (14).
The Journal of Clinical Investigation http://www.jci.org Volume 119 Number 1 January 2009
81
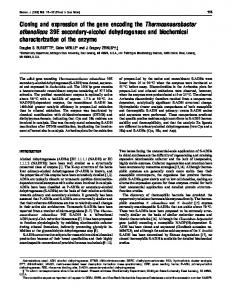
research article Figure 2 β-V59M mice express similar mRNA levels of WT and mutant Kir6.2. (A) Kir6.2 transcripts amplified by RT-PCR from islets isolated from 5-week-old β-V59M or WT mice were digested with BtsCI and loaded on a 2% agarose gel. Amplification of WT Kir6.2 cDNA generated a 282-bp product, which was cleaved by BtsCI into 177-bp and 105-bp products. Introduction of the V59M point mutation removed the unique BtsCI restriction site of the 282-bp amplicon, preventing its cleavage. Lanes 1 and 3, islets isolated from 2 different β-V59M mice. Lanes 2 and 4, islets isolated from 2 different WT mice. Lanes 5 and 6, positive controls using WT Kir6.2 and Kir6.2-V59M plasmids. In contrast with WT islets, β-V59M islets expressed the Kir6.2-V59M mutant gene, as demonstrated by the presence of a 282-bp BtsCI-resistant PCR product. (B) Lanes 1 and 2, RT-PCR of GFP using cDNA prepared from WT or β-V59M islets (isolated from β-V59M [1] and WT [1] mice shown in A, respectively). Lane 3, negative control. Lane 4, positive control using a plasmid-expressing GFP. GFP expression in β-V59M islets is demonstrated by amplification of a 328-bp product, which is absent in control islets. (C) Kir6.2 and SUR1 mRNA levels in islets isolated from 3-week-old WT or β-V59M mice, measured by quantitative PCR, and normalized to β2-microglobulin mRNA levels. Results are expressed as fold difference versus WT mice of the same litter. Results represent the mean ± SEM of 3 mice per genotype.
β-V59M mice possess 1 copy of the mutant Kir6.2 allele on top of 2 copies of the endogenous WT allele, making them hemizygous for the Kir6.2-V59M mutation. However, as Figure 2A also shows, Kir6.2V59M mRNA is expressed at levels comparable to those of WT Kir6.2 mRNA. Thus, our mice are a reasonable model for the heterozygous state of human patients with the V59M mutation (15). Quantitative PCR further revealed that total mRNA levels of Kir6.2 (mutant + WT) were decreased rather than increased in β-V59M islets (Figure 2C). The same downregulation was observed for SUR1. Glucose homeostasis. All 3 types of control mice (WT, RIP-Cre, and ROSA) were euglycemic and did not exhibit differences in body weight (Figure 3, A–D). In contrast, β-V59M mice developed elevated blood glucose concentrations within 3 days of birth (Figure 3C) and by 5 weeks of age had overt diabetes, with fasting blood glucose levels greater than 30 mM (Figure 3D). Plasma insulin levels were less than 19 pg/ml (i.e., were undetectable), compared with 91–148 pg/ml in control mice, and glucagon levels were slightly elevated (Supplemental Tables 1 and 2; supplemental material available online with this article; doi:10.1172/JCI35772DS1). Because β-V59M male mice weighed less than controls at 4–6 weeks of age, experiments were carried out on mice 5 weeks old or younger. The hypoinsulinemia of β-V59M mice resulted from impaired glucose-dependent insulin secretion. This is in part due to a reduced insulin content in β-V59M islets (and whole pancreas) (Figure 4, A and B), which results from lower transcription of the insulin gene (Figure 4C). However, even when expressed as a percentage of insulin content, basal insulin secretion and both firstand second-phase insulin secretion evoked by glucose were markedly impaired in β-V59M islets (Figure 4D). Insulin secretion (not shown) and insulin content of isolated islets did not differ among WT, RIP-Cre, and ROSA islets (Figure 4A). 82
In contrast to glucose, the specific KATP channel blocker tolbutamide stimulated insulin secretion similarly from both β-V59M and WT islets (Figure 4D). This argues that the reduction in glucose-stimulated insulin release results from a failure of KATP channel closure. At 5 days of age, there was no significant difference in insulin content between β-V59M and control pancreas (Supplemental Figure 2A). However, the elevated blood glucose levels (Supplemental Figure 2B) indicate that insulin secretion was already impaired. Electrical activity. The V59M mutation produces a significant reduction in the ATP sensitivity of recombinant Kir6.2-V59M/ SUR1 channels expressed heterologously in Xenopus oocytes or cell lines (9, 10). KATP channels in β-V59M β cells were also much less sensitive to MgATP than those in WT β cells: half maximal inhibition (IC50) was produced by approximately 270 μM (β-V59M) versus approximately 25 μM (WT) ATP (Figure 5, A and B; Supplemental Table 3). The IC50 for inhibition of V59M channels was intermediate between that of homomeric and heterozygous channels in oocytes (Supplemental Table 3), suggesting that KATP channels in β-V59M mice contain both WT and mutant subunits. The fraction of unblocked current at 10 mM ATP was increased in β-V59M β cells (~7% for β-V59M vs. ~0.5% for WT; Figure 5B), suggesting V59M channels will never be completely closed in the native cellular environment. This explains why larger KATP currents were recorded from cell-attached patches on β-V59M β cells than on WT β cells (Figure 5, C and D). Currents in excised patches were also approximately 2.5-fold larger (Figure 5, C and D), a difference that can be attributed to the fact that V59M KATP channels spend an increased fraction of time in the open state (i.e., have an increased open probability) even in the absence of ATP (9, 16). Consistent with the higher current density in cell-attached patches, whole-cell KATP currents in glucose-free solution were significantly larger in β-V59M β cells than in controls (Figure 6, A and B). They were also less effectively closed by glucose metabolism. For β-V59M β cells, the IC50 for glucose inhibition was greater than 20 mM, compared with 3 mM for WT β cells (Figure 6C). Tolbutamide (0.2 mM) produced complete inhibition of WT KATP currents but only 82% block of β-V59M currents (Figure 6D). The latter
The Journal of Clinical Investigation http://www.jci.org Volume 119 Number 1 January 2009
research article
Figure 3 β-V59M mice develop severe hyperglycemia soon after birth. (A and B) Mean body weight of β-V59M (gray; n = 4 minimum) and ROSA (Ctrl, black; n = 6 minimum) male (A) and female (B) mice. (C and D) Mean plasma glucose (G) concentrations for 3-day-old fed (C) and 5-week-old overnight-fasted (D) mice. The number of mice is given above each bar. Results represent mean ± SEM.
result is similar to that found for both heterozygous (88% ± 2%, n = 10; ref. 4) and homozygous V59M (80% ± 2%, n = 14; data not shown) channels expressed in Xenopus oocytes. Calcium. Basal calcium was not significantly different among β-V59M islets and all 3 types of control islets (compare Figure 7, A and B; Supplemental Figure 3). Glucose produced an initial rapid increase in [Ca2+]i in control islets, followed by continuous oscillations. The initial response was absent in β-V59M islets, but there was a slow secondary increase in [Ca2+]i (Figure 7B). However, WT and β-V59M islets both responded to tolbutamide. These data parallel those for insulin secretion (Figure 4D). Confocal imaging of [Ca2+]i in individual cells within the islet (Figure 7, C and D) revealed that approximately 40% of cells in β-V59M islets exhibited some [Ca2+]i response to 20 mM glucose compared with 70%–90% of cells in control islets (Supplemental Table 4). Unlike WT β cells, however, β-V59M β cells did not show regular Ca2+ oscillations. Furthermore, in WT islets, oscillations were synchronized across the whole islet (17), whereas in β-V59M islets, there was no correlation between [Ca2+]i oscillations in different cells (Figure 7D). β cells are weakly electrically coupled to each other, and the coupling current is only able to evoke electrical activity in neighboring cells when their KATP conductance is strongly reduced. Those β cells expressing the mutant channel should be less affected by glucose and thus would prevent the spread of excitation across the islet. Histology. The percentage of insulin-containing β cells per islet was reduced in β-V59M islets, and glucagon-containing α cells were relatively more numerous and no longer confined to the islet mantle
(Figure 8A). Further, although approximately 60% of β-V59M islets had the rounded shape characteristic of WT islets, others were irregularly shaped (Supplemental Figure 1A). Quantification revealed that islet density was not significantly different (Figure 8B) but that the percentage of islet area occupied by insulin-positive β cells was somewhat lower in β-V59M islets (~65%) than in control islets (~80%) (Figure 8C). This suggests that, in addition to the lower insulin content (Figure 4C) and the impaired glucose-stimulated insulin release (Figure 4D), at least part of the lower insulin secretion of β-V59M mice in vivo may be due to a reduced β cell number. Discussion Mouse model: advantages and limitations. Our mouse model contains a human ND mutation under the control of the endogenous ROSA26 promoter, whose expression is repressed by a loxP-flanked transcriptional STOP sequence prior to Cre-mediated excision. This enables the gene to be selectively expressed in any chosen tissue by crossing with a given Cre strain. In this paper, we used the RIP-Cre strain generated by Pedro Herrera (12) to target transgene expression to pancreatic β cells. In contrast to some other RIP-Cre strains (18, 19), these mice do not activate significant Cre expression in the brain (13), although there is likely to be limited expression in a minor population of neurons. They are also not mosaic (12, 20), so Cre recombinase should be expressed in all β cells. As both the rat insulin and ROSA26 promoters are activated during embryonic development (E11.5 and E8, respectively), β-V59M mice should express the mutant Kir6.2 prior to birth (20, 21).
The Journal of Clinical Investigation http://www.jci.org Volume 119 Number 1 January 2009
83
research article
Figure 4 Insulin content and insulin secretion from control and β-V59M islets. (A and B) Insulin content of islets (A, same islets as in D) and whole pancreas (B) isolated from 5-week-old control and mutant mice, as indicated. The number of mice is indicated above each bar. *P < 0.05 versus β-V59M. (C) Relative expression of the insulin gene in 5-week-old β-V59M islets, expressed as the fold difference from control islets. Data represent the mean ± SEM of a minimum of 3 mice per genotype. (D) Insulin secretion from perifused islets isolated from 5-week-old WT (squares, n = 5) or β-V59M (circles, n = 3) mice in response to 20 mM glucose or to 20 mM glucose plus 0.5 mM tolbutamide (Tolb). Secretion was normalized to insulin content to compensate for the difference in insulin content. Results represent mean ± SEM.
A limitation of our mouse model is that Kir6.2-V59M transgene expression is not driven by the endogenous Kir6.2 promoter. As a consequence, its transcriptional regulation may differ from that of the native gene; for example, its expression is unlikely to be regulated by glucose, as is the case for the WT gene (22, 23). The mutant cDNA is expressed from a single-copy integration into the endogenous ROSA26 allele, so that our mice possess 2 copies of the WT gene and a single copy of the mutant gene. These limitations are shared with all models of overexpression using the Cre-lox system. However, they are outweighed by the ability to confine expression of the mutant gene to selected tissues, thus enabling the relative contributions of different tissues to the disease phenotype to be evaluated. All human patients with the Kir6.2-V59M mutation are heterozygotes (15). We found comparable degrees of expression of WT and mutant Kir6.2 mRNAs in pancreatic islets from our β-V59M mice, which suggests that our mouse model provides a reasonable model for the human disease. This may be because we used the endogenous ROSA26 promoter, which drives relatively weak expression levels. Electrophysiological recordings also support the 84
idea that mutant Kir6.2 is not strongly overexpressed. If this were the case, the ATP sensitivity of the KATP channel should be similar to that found for homomeric V59M channels when heterologously expressed in Xenopus oocytes (10). However, it was intermediate between the homomeric V59M and the pseudo-heterozygous state produced by coinjection of equal amounts of WT and mutant Kir6.2 mRNAs (10). This suggests that channels contain both WT and mutant Kir6.2 subunits but that they either do not assemble randomly or that Kir6.2-V59M protein levels are somewhat greater than those of WT (despite similar mRNA levels). We do not know whether this is also the case in human patients. Morphology and role of ER stress. The abnormal architecture of β-V59M islets could be due to KATP channel overactivity in pancreatic β cells or may be secondary to the elevated plasma glucose. Our data do not allow us to conclude which of these is the most important. There is evidence both that hyperglycemia can lead to either reduced or elevated β cell mass (24, 25) and that KATP channels influence cell viability (26–28). The unusual morphology and reduced β cell number are unlikely, however, to result from a direct effect of overexpression of the mutant
The Journal of Clinical Investigation http://www.jci.org Volume 119 Number 1 January 2009
research article Figure 5 Mutant KATP channels are less sensitive to inhibition by ATP. (A) Representative KATP channel currents recorded at –60 mV from inside-out patches excised from WT or β-V59M β cells isolated from 5-week-old mice. The dotted line indicates the zero current level. (B) Mean ATP concentration-inhibition relationships for 7 WT (open circles) and 5 β-V59M (closed circles) β cells (2 mice from each group). Current (I) is expressed relative to that in ATPfree solution (Ic). The curves represent the best fit of Equation 1 to the mean data, with IC50 = 25 μM and h = 0.87 (WT); and IC50 = 270 μM and h = 0.8 (β-V59M). (C) KATP channel currents at –60 mV before (c.a) and after (excised) excision from a WT or β-V59M β cell. The dotted line indicates the zero current level. (D) Mean K ATP channel currents recorded at –60 mV before and after excision from 6 WT (white bars) or 9 β-V59M (black bars) β cells. Results represent mean ± SEM.
gene on, for example, ER stress. At 5 weeks of age, Kir6.2-V59M expression was low, since we did not observe homomeric Kir6.2V59M/SUR1 channels in β-V59M β cells (as judged by their ATP sensitivity), GFP protein expression was undetectable, and both Kir6.2 and SUR1 mRNAs were downregulated. Furthermore, Xbp1 splicing and Chop mRNA expression, both indicators of ER stress (29), were similar in control and β-V59M islets (Supplemental Figure 1B). The insulin content of β-V59M pancreas is not significantly reduced at 5 days of age but declines to approximately 20% of control by 5 weeks. Thus, the lower insulin content is not due to impaired development. The cause of the reduction in insulin content and mRNA is unclear. However, one possibility is that it may be a consequence of the very high plasma glucose of β-V59M mice, as long-term exposure to glucose concentrations greater than 30 mM reduces insulin gene expression (30) and the reduction in insulin content develops in parallel with the hyperglycemia. The lower levels of Kir6.2 and SUR1 expression are not unexpected, given the plasma hyperglycemia, as high glucose is known to lead to downregulation of both genes (22, 23). The extent of downregulation (60%–80%) is similar to that reported for Kir6.2 expression in pancreatic islets and INS1 β cells, which is reduced approximately 70% by culture in 25 mM glucose (23). Given that the mutant gene (whose expression is driven by the endogenous ROSA26 promoter) is unlikely to be downregulated by glucose, the reduced expression of Kir6.2, coupled with the fact the channels are not fully homozygous provides further evidence that the transgene is not expressed at very high levels. Thus, we
favor the idea that β cell loss is not a nonspecific result of overexpression of Kir6.2-V59M but a specific consequence of its expression, possibly secondary to hyperglycemia. Cause of diabetes. In addition to β cells, Kir6.2 is expressed in multiple cell types that contribute to glucose homeostasis, including those involved in the release of incretins and appetite regulation (3). Our results show that expression of Kir6.2-V59M subunits in pancreatic β cells is sufficient to cause impaired insulin secretion and diabetes in the mouse. This suggests that defective β cell stimulus-secretion coupling in human patients with this mutation is able to account for their diabetes. Both first- and second-phase glucose-stimulated insulin secretion were severely impaired in β-V59M mice, accounting for the fact that plasma insulin was undetectable and the mice were diabetic. In contrast, insulin secretion from β-V59M islets was stimulated by tolbutamide; this is expected because the drug bypasses the metabolic steps and blocks KATP channels directly (31), thereby triggering membrane depolarization and insulin secretion. Although V59M KATP channels are blocked less potently by sulfonylureas, this is still sufficient to elicit secretion in β-V59M mice and in human patients (32). In vivo, the lower insulin content and reduced β cell number of β-V59M islets are also expected to contribute to the hypoinsulinemia. A common finding is that following transfer of patients from insulin to sulfonylurea therapy, the sulfonylurea dose required declines with time; this is also found for patients with the V59M mutation (4, 33). Our experiments suggest a possible explanation for this finding. If, like the β-V59M mice, these patients have a
The Journal of Clinical Investigation http://www.jci.org Volume 119 Number 1 January 2009
85
research article Figure 6 Mutant KATP channels are less sensitive to inhibition by glucose. (A) Representative whole-cell KATP currents recorded in the perforated-patch configuration (to preserve cell metabolism) from WT and β-V59M β cells isolated from 5-week-old mice in response to ±10 mV voltage steps from a holding potential of –70 mV. (B) Mean whole-cell KATP channel currents recorded in glucose-free solution (perforated patch) from WT (white bars) and β-V59M (black bars) β cells. (C) Mean relationship between whole-cell KATP current and glucose concentration recorded in the perforatedpatch configuration from 5 WT (open circles) and 8 β-V59M (closed circles) β cells. Current (I) is expressed relative to that in glucose-free solution (Ic). (D) Percentage of the whole-cell KATP currents blocked by 0.2 mM tolbutamide. Results represent mean ± SEM.
reduced number of β cells, then stabilization of blood glucose levels following sulfonylurea therapy, or block of KATP currents per se, might lead to recovery of β cell mass and thus to a reduced sulfonylurea requirement. It might also help explain why transfer from insulin to sulfonylurea therapy is most easily effected in younger patients; in 2 families, V59M mothers were unable to switch to sulfonylurea treatment, despite their affected children doing so (4, 33). It will be important to determine whether the changes in islet structure we observe in β-V59M mice are a consequence of hyperglycemia, as this might imply that patients who have poor glucose control prior to drug treatment will be able to switch less easily. Methods Generation of β-V59M mice. ROSA mice were generated using standard gene-targeting techniques. The Kcnj11 gene (ENSMUSG00000070561) encoding Kir6.2 was amplified by PCR from mouse genomic DNA and cloned into the pGEM-T Easy Vector (Promega). The Kir6.2-V59M mutant was generated using the QuikChange Site-Directed Mutagenesis Kit (QIAGEN) and ligated into the AscI site of the STOP-EGFPROSA targeting vector (34). The STOP-EGFP-ROSA plasmid (Figure 1B) consists of a 5′ homology arm to the ROSA26 locus followed by an adenoviral splice acceptor signal (SA). Downstream of the SA site, a loxP-flanked neomycin resistance cassette containing a strong transcriptional STOP sequence not only confers resistance to G418 but also prevents expression of the transgene prior to Cre excision. Downstream of the neomycin resistance cassette lies the cDNA for Kir6.2-V59M and an FLP recombinase target 86
site–flanked IRES-GFP expression cassette, followed by a 3′ homology sequence to the ROSA26 locus. The targeting vector (Figure 1B) was linearized and electroporated into V6.5 (50% C57BL/6, 50% 129/sv) embryonic stem cells. Recombinant ES cells were identified by Southern blotting, using a 5′-ROSA probe (700 bp EcoRI/PacI fragment from the A-04 vector; ref. 35) external to the targeting vector (Figure 1E). Positive ES clones were injected into CB20 blastocysts to generate ROSA mice. Mice were backcrossed to C57BL/6 mice for more than 2 generations. In order to express the Kir6.2-V59M transgene specifically in pancreatic β cells, ROSA mice were mated with mice expressing Cre recombinase under the control of the rat insulin promoter (RIP-Cre mice; provided by Pedro Herrera, University of Geneva Medical School, Geneva, Switzerland). Littermates were used for all studies. Animal care. All experiments were conducted in accordance with the 1986 UK Animals (Scientific Procedures) Act and University of Oxford ethical guidelines, and all animal studies were approved by the Ethics Committee of the University of Oxford. Mice were housed in same-sex littermate groups of 2 to 8 in a temperature- and humidity-controlled room on a 12-hour light/12-hour dark cycle (lights on at 6 am). Regular chow food (Teklad Global 2019 Rodent containing 55% carbohydrate, 19% protein, and 9% fat; Harlan Teklad) was freely available except where it is indicated mice were fasted overnight. Mice had ad libitum access to water at all times. They were weighed every 4 days. Because V59M mice produced copious urine after a few weeks of life, breeding pairs and offspring were maintained on high-absorbency bedding. All mice were genotyped by PCR. Genotyping. Genotypes were identified by PCR using genomic DNA isolated from ear biopsies (DNeasy Blood and Tissue kit; QIAGEN). The pres-
The Journal of Clinical Investigation http://www.jci.org Volume 119 Number 1 January 2009
research article
Figure 7 β-V59M islets show a decreased [Ca2+]i response to glucose. (A and B) Representative changes in [Ca2+]i produced by glucose and tolbutamide in WT (A) or β-V59M (B) islets. Values above the traces give mean ± SEM calcium concentrations (in nM) in 2 mM glucose (at steady state), 20 mM glucose (peak or initial and steady state), and 0.2 mM tolbutamide (peak). Data are representative of 7–9 islets (n = 2 mice). (C and D) Confocal images of WT (C) and β-V59M (D) islets stained with fluo 4–AM. Circles indicate the regions from which data in the lower panels was taken. Scale bars = 50 μm. Lower panels show representative changes in [Ca2+]i produced by increasing glucose from 2 to 20 mM in 2 different regions of the islet (indicated in upper panels) for WT (C) and β-V59M (D) islets. Insets show amplified sections to demonstrate that [Ca2+]i oscillations are synchronized in WT but not β-V59M β cells.
ence of the Kir6.2-V59M mutant gene was confirmed using the following set of primers: P1, 5′-AAAGTCGCTCTGAGTTGTTATC-3′; P2, 5′-GATATGAAGTACTGGGCTCTT-3′; and P3, 5′-GCATCGCCTTCTATCGCCT-3′. These amplify a 590-bp amplicon from the WT ROSA26 allele but a 460-bp product from the targeted allele. The presence of the RIP-Cre gene was confirmed by the amplification of an approximately 230-bp product, using forward ACGAGTGATGAGGTTCGCA and reverse ATGTTTAGCTGGCCCAAATGT primers. For both genes, PCR conditions were 94°C for 3 minutes, followed by 45 cycles of 94°C for 30 seconds, 57°C for 45 seconds, 72°C for 1 minute 30 seconds. This was followed by a final extension of 72°C for 10 minutes. Pancreatic islet and β cell isolation. Mice were killed by cervical dislocation. Pancreata were removed and islets isolated by liberase digestion and handpicking. For electrophysiology, isolated islets were dispersed into single cells
by incubation in calcium-free Hank’s solution (137 mM NaCl, 5.6 mM KCl, 1.2 mM MgCl2, 1 mM NaH2PO4, 4.2 mM NaHCO3, 10 mM HEPES [pH 7.4 with NaOH], 1 mM EGTA, and 2.5 mM glucose) and trituration in pancreatic islet medium containing 11 mM glucose (hCell Technology) supplemented with 100 U/ml penicillin and 100 μg/ml streptomycin. Cells were maintained in this medium at 37°C in a humidified atmosphere of 5% CO2 in air and used 1–2 days after isolation. For islet perifusion studies, the perifusate was collected every 0.5 or 2 minutes. The dead-space time of the perifusion system was approximately 2 minutes and has not been corrected for in the figures. RNA extraction and cDNA synthesis. Total RNA was extracted from approximately 100 isolated islets using RNeasy Mini Kit (QIAGEN), including an on-column DNase digestion step to remove traces of genomic DNA. RNA concentration was determined using a NanoDrop Spectrophotometer (Thermo Scientific) and its quality checked with the Agilent Bioanalyzer.
The Journal of Clinical Investigation http://www.jci.org Volume 119 Number 1 January 2009
87
research article Figure 8 KATP mutant islets have fewer β cells. (A) Immunohistochemistry of representative pancreatic islets from 5-week-old β-V59M, WT, RIP-Cre, and ROSA mice, as indicated. Insulin-positive cells are stained green. Glucagon-positive cells are stained red. Original magnification, ×20. Scale bars: 20 μm. (B and C) Islet density expressed as number of islets per cm2 (B) and mean crosssectional β cell area, expressed as percentage of total islet crosssectional area (C). Data represent mean ± SEM of 3 mice per genotype (5 sections per mouse). *P < 0.05 versus β-V59M.
Equal quantities of total RNA were reverse transcribed using High Capacity cDNA Reverse Transcription kit (Applied Biosystems). The reaction cycle consisted of 10 minutes of incubation at 25°C followed by 30 minutes of incubation at 48°C. Samples were subsequently stored at –20°C. Semiquantitative PCR. Mouse Kir6.2 transcript was amplified by PCR using cDNA prepared from islets isolated from either V59M or WT 5-week-old mice. Primers used were as follows: forward, 5′-ATGCTGTCCCGAAAGGGCAT-3′; and reverse, 5′-TGGTCTGGTGGCTCATCGCC-3′. After 40 cycles (95°C for 30 seconds; 60°C for 30 seconds; 72°C for 1 minute), PCR products were digested with BtsCI restriction enzyme (New England BioLabs) for approximately 1 hour at 50°C and digested PCR fragments visualized on a 2% agarose gel. Sequences of primers used for GFP amplification were as follows: forward, 5′-GAGGTGAAGTTCGAGGGCGAC-3′; and reverse, 5′-CAGGACCATGTGATCGCGCTT-3′. Real-time quantitative PCR. Quantitative real-time PCR was performed in an ABI PRISM 7000 Sequence Detection System (Applied Biosystems) using either SYBR Green or TaqMan chemistries. For SYBR Green detection, primers were designed using Primer Express Software 2.0 (Applied Biosystems) based on Ensembl sequence data. Sequences of the primers used were as follows: for unspliced Xbp1, forward, 5′-CAGCACTCAGACTATGTGCA-3′, and reverse, 5′-GTCCATGGGAAGATGTTCTGG-3′; for spliced Xbp1 (36), forward, 5′-CTGAGTCCGAATCAGGTGCAG-3′, and reverse, 5′-GTCCATGGGAAGATGTTCTGG-3′; for Chop, forward, 5′-AGCCTGGTATGAGGATCTGCAG-3′, and reverse, 5′-GGTCAAGAGTAGTGAAGGTTTTTGATTC-3′; for Insulin 1, forward, 5′-AGACCATCAGCAAGCAGGTCA-3′, and reverse, 5′-AAGTGCACCAACAGGGCC-3′; and for Gapdh, forward, 5′-AGCGAGACCCCACTAACATC-3′, and reverse, 5′-GGTTCACACCCATCACAAAC-3′. All reactions were performed in triplicate in a final volume of 25 μl containing 12.5 μl Power SYBR Green Master Mix, 300 nM of each primer, and 50 ng of cDNA template. cDNA was amplified by 40 cycles of 95°C for 15 seconds and 60°C for 1 minute. Gene expression was determined by the standard curve method and normalized to GAPDH. 88
Mouse Kir6.2 and SUR1 mRNA levels were determined using predesigned TaqMan Gene Expression assays (assays Mm 00440050-s1 and Mm 00803450-m1, respectively) (Applied Biosystems) according to the manufacturer’s instructions and normalized to the housekeeping gene β-2-microglobulin (assay Mm 00437762-m1). Measurements of blood glucose, insulin, and glucagon levels. Five-week-old mice were fasted for 16 hours. They were then weighed, and a blood sample was collected by cardiac puncture under terminal anesthesia (Euthatal; Merial). Plasma glucose level was determined using a GM9 Glucose Analyser (Analox Instruments). Plasma insulin and glucagon levels were measured using a mouse endocrine LINCOplex kit (LINCO Research Inc.) and a BioPlex 200 System (Bio-Rad), according to the manufacturers’ instructions. For determination of total insulin content, the pancreas was removed and incubated overnight in acidified alcohol. Insulin was measured using a Mercodia Ultrasensitive Mouse ELISA Kit. Islet perifusion. Isolated islets were incubated overnight in pancreatic islet medium (hCell Technology). They were then placed on top of 8-μm pore diameter filter membranes mounted inside Swinnex filter holder chambers (Millipore) and perifused at 37°C at a rate of 1 ml/min–1 with Krebs-Ringer-HEPES buffer (KRH): 120 mM NaCl, 4.7 mM KCl, 2.5 mM CaCl2, 1 mM KH2PO4, 1.2 mM MgSO4, 10 mM HEPES, and 20 mM NaHCO3, pH 7.4 with NaOH, plus 0.2% BSA and glucose as indicated. After 40 minutes preincubation in 2 mM glucose KRH, islets were perifused for 10 minutes in 20 mM glucose KRH and subsequently for 20 minutes with 20 mM glucose KRH containing 0.5 mM tolbutamide. Insulin was measured using a Mercodia Ultrasensitive Mouse ELISA Kit. Electrophysiology. Macroscopic currents were recorded from inside-out or cell-attached membrane patches at –60 mV, filtered at 5 kHz, and digitized at 20 kHz. The pipette contained 140 mM KCl, 10 mM HEPES (pH 7.2 with KOH), 1.1 mM MgCl2, and 2.6 mM CaCl2. The intracellular (bath) solution contained 107 mM KCl, 1 mM CaCl 2, 2 mM MgCl 2, 11 mM EGTA, and 10 mM HEPES (pH 7.2 with KOH) plus MgATP as indicated. Whole-cell currents were recorded in the perforated patch
The Journal of Clinical Investigation http://www.jci.org Volume 119 Number 1 January 2009
research article configuration in response to –10 mV steps from –70 mV at 21–23°C. Currents were normalized to cell capacitance to correct for differences in cell size. The pipette solution contained 76 mM K2SO4, 10 mM NaCl, 10 mM KCl, 1 mM MgCl2, and 5 mM HEPES, pH 7.35 with KOH, plus 0.24 mg/ml amphotericin. The bath solution contained 137 mM NaCl, 5.6 mM KCl, 10 mM HEPES, pH 7.4 with NaOH, 2.6 mM CaCl2, and 1.1 mM MgCl2. Recordings were initiated 30 minutes after exposure to substrate-free solutions. ATP concentration-response curves were fit with the following equation: I/Ic = a + (1 – a)/(1+ ([ATP]/IC50)h) (Equation 1) where I and Ic are the current amplitude in the presence and absence of nucleotide, respectively, IC50 is the ATP concentration ([ATP]) at which inhibition is half maximal, h is the slope factor, and a is the fraction of unblocked current at saturating [ATP]. To control for current rundown, Ic was taken as the mean of the conductance in control solution before and after ATP application. Intracellular calcium measurements. For microfluorimetry, islets were loaded for 30 minutes at room temperature with 3 μM fura 2–AM (Invitrogen) and 0.01% pluronic acid in extracellular buffer containing 138 mM NaCl, 5.6 mM KCl, 2.6 mM CaCl2, 1 mM MgCl2, and 5 mM HEPES, pH 7.4 with NaOH. [Ca2+]i was measured ratiometrically as described previously (37) using a PTI microfluorimetry system and FeliX32, version 1.1 (Photon Technology International). For confocal calcium imaging, islets were loaded with 4 μM fluo 4–AM (Invitrogen) for 2 hours at room temperature in extracellular buffer. Changes in [Ca2+]i were recorded at 37°C by laser scanning confocal microscopy using an LSM 510 Meta system (Zeiss). Individual cells were selected as “regions of interest” with the LSM software, and their calcium responses to the various stimuli were identified as changes in fluo 4 emission intensity at 500–550 nm upon excitation with the 488-nm line of an argon laser. Immunohistochemistry and morphometric analysis. Pancreatic specimens from 5-week-old female mice were fixed overnight in 10% formaldehyde in PBS at 4°C and wax embedded. Dewaxed and rehydrated sections (5-μm thick) were stained with antibodies against insulin (guinea pig), glucagon (mouse; Dako), somatostatin (rabbit; Sera Laboratories International), and pancreatic polypeptide (rabbit; Lilly). For confocal microscopy, insulin-positive cells were detected using a secondary antibody conjugated with fluorescein (goat antiGP; Vector Laboratories), and glucagon-positive cells were identified with a TRITC-conjugated antibody (horse anti-mouse; Vector Laboratories). 1. Hattersley, A.T., and Ashcroft, F.M. 2005. Activating mutations in Kir6.2 and neonatal diabetes: new clinical syndromes, new scientific insights, and new therapy. Diabetes. 54:2503–2513. 2. Flanagan, S.E., Edghill, E.L., Gloyn, A.L., Ellard, S., and Hattersley, A.T. 2006. Mutations in KCNJ11, which encodes Kir6.2, are a common cause of diabetes diagnosed in the first 6 months of life, with the phenotype determined by genotype. Diabetologia. 49:1190–1197. 3. Ashcroft, F.M. 2007. The Walter B. Cannon Physiology in Perspective Lecture, 2007. ATP-sensitive K+ channels and disease: from molecule to malady. Am. J. Physiol. Endocrinol. Metab. 293:E880–E889. 4. Pearson, E.R., et al. 2006. Switching from insulin to oral sulfonylureas in patients with diabetes due to Kir6.2 mutations. N. Engl. J. Med. 355:467–477. 5. Miki, T., and Seino, S. 2005. Roles of KATP channels as metabolic sensors in acute metabolic changes. J. Mol. Cell. Cardiol. 38:917–925. 6. Nichols, C.G. 2006. KATP channels as molecular sensors of cellular metabolism. Nature. 440:470–476. 7. Nichols, C.G., et al. 1996. Adenosine diphosphate
For assessment of islet architecture (shape), β cells were stained brown using an anti-GP HRP-coupled antibody and 3,3′-diaminobenzidine (DAB) reagent and then counterstained with hematoxylin. For quantitative morphometric analysis, β cells were stained red with Fast Red Substrate (Sigma-Aldrich) and alkaline-phosphatase anti-GP secondary antibody (Sigma-Aldrich), and α, δ, and pancreatic polypeptide–positive cells were stained brown with HRPcoupled antibodies against mouse (glucagon; Vector Laboratories) and rabbit (somatostatin and pancreatic polypeptide; Dako) and DAB reagent (SigmaAldrich). Images of islets and the entire pancreas were taken with an Olympus digital camera and analyzed using AxioVision 4.6 software (Zeiss). For quantitation of β cell area, sections 100 μm distant from each other were analyzed for 3 animals of each genotype. A total of approximately 60 islets, distributed over 5 sections, were analyzed per mouse. β cell area was calculated by subtracting non-β cell area from total islet area. Data are expressed as islet density (islet number/pancreas area) and β cell/islet proportion (β cell area/islet area). Analysis was performed blinded to the mouse genotype. Statistics. Unless specified, data are mean ± SEM of the indicated number of experiments.
Acknowledgments We thank Kerrie Saddler, Maria Martinez, Lee Sandle, Caroline Barnwell, Jo Troughear, and Elaine Greenwood for taking care of the mice, and Ann Stanmore and Colin Beesley for advice on morphometric analysis. We thank the Wellcome Trust (F.M. Ashcroft and P. Rorsman), the Medical Research Council (R. Clark), the European Union (EuroDia LSHM-CT-2006-518153 and BioSim LSHB-CT-2004-05137 to F.M. Ashcroft and P. Rorsman), the Royal Society (F.M. Ashcroft), and the Deutsche Forschungsgemeinschaft (DGF-BR1492-7 to J.C. Brüning) for support. We thank EMBO for a short-term fellowship for C.A. Girard. F.M. Ashcroft is a Royal Society Research Professor. F. Abdulkader holds a fellowship from the Conselho Nacional de Desenvolvimento Cientifico e Tecnologico, Brazil. Received for publication March 27, 2008, and accepted in revised form October 29, 2008. Address correspondence to: Frances Ashcroft, Department of Physiology, Anatomy and Genetics, University of Oxford, Parks Road, Oxford OX1 3PT, United Kingdom. Phone: 44-1865-285810; Fax: 44-1865-285813; E-mail:
[email protected].
as an intracellular regulator of insulin secretion. Science. 272:1785–1787. 8. Tucker, S.J., Gribble, F.M., Zhao, C., Trapp, S., and Ashcroft, F.M. 1997. Truncation of Kir6.2 produces ATP-sensitive K+ channels in the absence of the sulphonylurea receptor. Nature. 387:179–183. 9. Koster, J.C., Remedi, M.S., Dao, C., and Nichols, C.G. 2005. ATP and sulfonylurea sensitivity of mutant ATP-sensitive K+ channels in neonatal diabetes: implications for pharmacogenomic therapy. Diabetes. 54:2645–2654. 10. Proks, P., Girard, C., and Ashcroft, F.M. 2005. Functional effects of KCNJ11 mutations causing neonatal diabetes: enhanced activation by MgATP. Hum. Mol. Genet. 14:2717–2726. 11. Zambrowicz, B.P., et al. 1997. Disruption of overlapping transcripts in the ROSA beta geo 26 gene trap strain leads to widespread expression of betagalactosidase in mouse embryos and hematopoietic cells. Proc. Natl. Acad. Sci. U. S. A. 94:3789–3794. 12. Herrera, P.L. 2000. Adult insulin- and glucagonproducing cells differentiate from two independent cell lineages. Development. 127:2317–2322.
13. Hashimoto, N., et al. 2006. Ablation of PDK1 in pancreatic beta cells induces diabetes as a result of loss of beta cell mass. Nat. Genet. 38:589–593. 14. Novak, A., Guo, C., Yang, W., Nagy, A., and Lobe, C.G. 2000. Z/EG, a double reporter mouse line that expresses enhanced green fluorescent protein upon Cre-mediated excision. Genesis. 28:147–155. 15. Gloyn, A.L., et al. 2004. Activating mutations in the gene encoding the ATP-sensitive potassium-channel subunit Kir6.2 and permanent neonatal diabetes. N. Engl. J. Med. 350:1838–1849. 16. Proks, P., et al. 2004. Molecular basis of Kir6.2 mutations associated with neonatal diabetes or neonatal diabetes plus neurological features. Proc. Natl. Acad. Sci. U. S. A. 101:17539–17544. 17. Santos, R.M., et al. 1991. Widespread synchronous [Ca2+]i oscillations due to bursting electrical activity in single pancreatic islets. Pflugers Arch. 418:417–422. 18. Gannon, M., Shiota, C., Postic, C., Wright, C.V., and Magnuson, M. 2000. Analysis of the Cre-mediated recombination driven by rat insulin promoter in embryonic and adult mouse pancreas. Genesis. 26:139–142.
The Journal of Clinical Investigation http://www.jci.org Volume 119 Number 1 January 2009
89
research article 19. Lin, X., et al. 2004. Dysregulation of insulin receptor substrate 2 in beta cells and brain causes obesity and diabetes. J. Clin. Invest. 114:908–916. 20. Xuan, S., et al. 2002. Defective insulin secretion in pancreatic beta cells lacking type 1 IGF receptor. J. Clin. Invest. 110:1011–1019. 21. Friedrich, G., and Soriano, P. 1991. Promoter traps in embryonic stem cells: a genetic screen to identify and mutate developmental genes in mice. Genes Dev. 5:1513–1523. 22. Acosta-Martinez, M., and Levine, J.E. 2007. Regulation of KATP channel subunit gene expression by hyperglycemia in the mediobasal hypothalamus of female rats. Am. J. Physiol. Endocrinol. Metab. 292:E1801–E1807. 23. Moritz, W., Leech, C.A., Ferrer, J., and Habener, J.F. 2001. Regulated expression of adenosine triphosphate-sensitive potassium channel subunits in pancreatic beta-cells. Endocrinology. 142:129–138. 24. Biarnes, M., et al. 2002. Beta-cell death and mass in syngeneically transplanted islets exposed to shortand long-term hyperglycemia. Diabetes. 51:66–72. 25. Bock, T., Pakkenberg, B., and Buschard, K. 2003. Increased islet volume but unchanged islet number
90
in ob/ob mice. Diabetes. 52:1716–1722. 26. Koster, J.C., et al. 2006. Expression of ATP-insensitive KATP channels in pancreatic beta-cells underlies a spectrum of diabetic phenotypes. Diabetes. 55:2957–2964. 27. Liss, B., et al. 2005. K-ATP channels promote the differential degeneration of dopaminergic midbrain neurons. Nat. Neurosci. 8:1742–1751. 28. Miki, T., Iwanaga, T., Nagashima, K., Ihara, Y., and Seino, S. 2001. Roles of ATP-sensitive K+ channels in cell survival and differentiation in the endocrine pancreas. Diabetes. 50(Suppl. 1):S48–S51. 29. Ron, D., and Walter, P. 2007. Signal integration in the endoplasmic reticulum unfolded protein response. Nat. Rev. Mol. Cell Biol. 8:519–529. 30. Marshak, S., et al. 1999. Impaired beta-cell functions induced by chronic exposure of cultured human pancreatic islets to high glucose. Diabetes. 48:1230–1236. 31. Gribble, F.M., and Reimann, F. 2003. Sulphonylurea action revisited: the post-cloning era. Diabetologia. 46:875–891. 32. Slingerland, A.S., et al. 2006. Improved motor development and good long-term glycaemic con-
trol with sulfonylurea treatment in a patient with the syndrome of intermediate developmental delay, early-onset generalised epilepsy and neonatal diabetes associated with the V59M mutation in the KCNJ11 gene. Diabetologia. 49:2559–2563. 33. Slingerland, A.S., and Hattersley, A.T. 2006. Activating mutations in the gene encoding Kir6.2 alter fetal and postnatal growth and also cause neonatal diabetes. J. Clin. Endocrinol. Metab. 91:2782–2788. 34. Sasaki, Y., et al. 2006. Canonical NF-kappaB activity, dispensable for B cell development, replaces BAFF-receptor signals and promotes B cell proliferation upon activation. Immunity. 24:729–739. 35. Mao, X., Fujiwara, Y., and Orkin, S.H. 1999. Improved reporter strain for monitoring Cre recombinase-mediated DNA excisions in mice. Proc. Natl. Acad. Sci. U. S. A. 96:5037–5042. 36. Lipson, K.L., Ghosh, R., and Urano, F. 2008. The role of IRE1alpha in the degradation of insulin mRNA in pancreatic beta-cells. PLoS ONE. 3:e1648. 37. Olofsson, C.S., et al. 2007. Long-term exposure to glucose and lipids inhibits glucose-induced insulin secretion downstream of granule fusion with plasma membrane. Diabetes. 56:1888–1897.
The Journal of Clinical Investigation http://www.jci.org Volume 119 Number 1 January 2009