Micromachines 2012, 3, 62-77; doi:10.3390/mi3010062 OPEN ACCESS
micromachines ISSN 2072-666X www.mdpi.com/journal/micromachines Article
Fabrication and Performance of a Photonic-Microfluidic Integrated Device Benjamin R. Watts 1, Thomas Kowpak 2, Zhiyi Zhang 3,*, Chang-Qing Xu 1,*, Shiping Zhu 2, Xudong Cao 4 and Min Lin 5 1
2
3
4
5
Department of Engineering Physics, McMaster University, 1280 Main Street West, Hamilton, ON L8S 4L7, Canada; E-Mail:
[email protected] Department of Chemical Engineering, McMaster University, 1280 Main Street West, Hamilton, ON L8S 4L7, Canada; E-Mails:
[email protected] (T.K.);
[email protected] (S.Z.) Institute of Microstructural Science, National Research Council of Canada, 1200 Montreal Road, Ottawa, ON K1A 0R6, Canada Department of Chemical and Biological Engineering, University of Ottawa, 550 Cumberland Street, Ottawa, ON K1N 6N5, Canada; E-Mail:
[email protected] Ottawa Laboratory Fallowfield, Canadian Food Inspection Agency, 3851 Fallowfield Road, Ottawa, ON K2H 8P9, Canada; E-Mail:
[email protected]
* Author to whom correspondence should be addressed; E-Mails:
[email protected] (Z.Z.);
[email protected] (C.-Q.X.); Tel.: +1-613-993-4198; +1-905-525-9140 ext. 24314. Received: 20 December 2011; in revised form: 20 January 2012 / Accepted: 7 February 2012 / Published: 15 February 2012
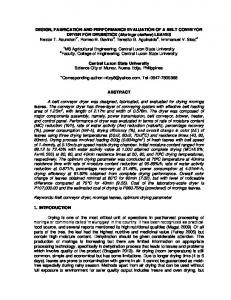
Abstract: Fabrication and performance of a functional photonic-microfluidic flow cytometer is demonstrated. The devices are fabricated on a Pyrex substrate by photolithographically patterning the microchannels and optics in a SU-8 layer that is sealed via a poly(dimethylsiloxane) (PDMS) layer through a unique chemical bonding method. The resulting devices eliminate the free-space excitation optics through integration of microlenses onto the chip to mimic conventional cytometry excitation. Devices with beam waists of 6 μm and 12 μm in fluorescent detection and counting tests using 2.5 and 6 μm beads-show CVs of 9%–13% and 23% for the two devices, respectively. These results are within the expectations for a conventional cytometer (5%–15%) and demonstrate the ability to integrate the photonic components for excitation onto the chip and the ability to maintain the level of reliable detection.
Micromachines 2012, 3
63
Keywords: SU-8; PDMS; microfluidics; optical waveguide; integration; devices
1. Introduction Microfluidics is a young and rapidly expanding field that is concerned with the processing, analysis, or handing of fluids in channels on the order of 10 s of microns in size. This leads to the manipulation of volumes in the nano to atto liter range [1] and allows the manipulation and detection of single molecules [2]. By exploiting non-conventional phenomena that occurs in such small volumes of liquids, new and intriguing applications have surfaced [3]. Early devices were simple trenches that were sealed to form a closed channel made from Si and glass structures and were directly compatible with state-of-the-art photolithographic techniques [4,5]. With the development of soft lithography techniques involving the quick and rapid fabrication of planar devices in a poly(dimethylsiloxane) (PDMS) layer with limited lithography use [6], the rapid and simple development of devices has allowed a boom in research and applications [7]. Lithographic and microfabrication techniques also offer the ability to fabricate multiple devices into a seamless single platform. These integration capabilities can allow the automation of chemical processing. When integration is coupled with new phenomena arising from reduced liquid volumes and improved sensitivities, a new plethora of analysis capabilities and techniques are available to the user while drastically reducing complexity, cost, and analysis time for the user. Indeed, integrated fluid handling components have been demonstrated such as valves and pumps [8–10], micromixers [10,11], reactors [12], sorters [13,14], and culture chambers [14], and allow for complex fluidic circuitry to eliminate external handling. A fully integrated device is termed a Lab-on-a-chip (LOC) or Micro-totalanaylsis-system (μTAS) [15,16], and these devices have the ability to revolutionize medical and laboratorial procedures. Currently, microchip devices can be found in practical applications from electrophoresis [4,5,17], single DNA detection [18,19], proteomics [20], immunoassays [21], and online lactate monitoring [22]. Whereas integrated devices for chemical manipulation allow high level functionality for handling, pretreatment, and process control, integration of optical components allows for sensitive interrogation techniques while increasing portability and durability, and decreasing costs. Integration of optical waveguides [23–27], filters [28–30], focusing elements [24–27,31–33], sources and detectors [28,34,35] have all been demonstrated in an integrated fashion on a microfluidic chip. Integration of optical components on chip allows devices to become self-reliant, portable, and less expensive allowing on-line monitoring possibilities and point-of-care (POC) medical care applications. Microchip-based flow cytometry is a LOC form of conventional flow cytometers used to perform a very specific biological analysis using an integrated device [36,37]. Current microchip-based devices show very promising functionality [32–34,36,37], however, the reliability of detection is still too low for a microchip-based device to be applicable in a screening, monitoring, or for POC purposes, thus limiting their deployment in applications. Devices need to be able to mimic the reliability afforded by conventional flow cytometers as closely as possible in order for meaningful and conclusive analysis of target specimens to be extracted. This work shows the development of a microfluidic device that
Micromachines 2012, 3
64
incorporates a novel sealing method for microfluidic channels in a device designed to perform optical excitation on-chip in order to improve the reliability of detection in a flow cytometric application. These devices mimic a conventional approach deployed in flow cytometry to optimize the optical geometry of the photonic beam in the channel used for optical excitation. 2. Experimental 2.1. Materials Four inch glass (Pyrex 7740) and silicon wafers were purchased from University Wafers and served as a substrate. Epoxy photoresist SU-8 resin 2025, 3050, and their developer were purchased from Microchem Corporation to form the device and intermediate layers. PDMS monomer resin and curing agent in the form of a Sylgard 184 silicone elastomer kit were purchased from Dow Corning to form the soft top sealing layer. 3-aminopropyltrimethoxysilane (APTMS) and solvents, including analytical grade anhydride ethanol, hexane, and toluene were purchased from Sigma Aldrich for the aminization of PDMS. Fluorescent dye for device beam excitation was Nile Blue 690 Perchlorate purchased from Exciton Inc. Fluorescent microbeads for flow cytometric analysis performance, 2.5 µm diameter Alignflow and 6 µm diameter AlignFlow Plus, were purchased from Invitrogen. 2.2. Processing and Device Fabrication Wafers were cleaned and prebaked at 265 °C for 3 h to ensure that every molecule of water was removed from the wafer surface in order to ensure effective bonding between the glass and SU-8. After the prebake, the wafers were spin coated using a Model WS-400A-6NPP/LITE from Laurell Technologies Corporation, with a 600 nm thick layer of SU-8 3050. A ~27 µm thick layer of SU-8 2025 was then spun and soft baked at 95 °C ramping up at 100 °C/h and ramped back down to room temperature at 25 °C/h. The SU-8 was patterned using an ABM high performance mask aligner and exposure system from ABM Inc, (San Jose, CA, USA). A dose of 199 mJ/cm2 was applied in step wise fashion to avoid over exposure. A post exposure bake was then performed to crosslink the exposed SU-8 by ramping the temperature up to 90 °C and back down using the same speeds as in the soft bake. SU-8 layers were then developed using the SU-8 developer for 5 min under low agitation, rinsed with isopropyl alcohol and dried under a nitrogen stream. PDMS sheets, approximately 1mm thick, were prepared by casting a mixture using a ratio of 1:10 curing agent and resin from the Sylgard, and allowing them to sit for 24 h so that bubbles could dissipate. PDMS sheets were then baked at 110 °C for one hour and then at 150 °C for 24 h just prior to bonding to SU-8 to drive out all solvents from the surface. An APTMS solution was prepared by adding a certain weight of APTMS into a measured amount of solvent and mixing using a vortex mixer. Anhydride toluene, anhydride hexane, and anhydride ethanol were used as solvents, and various weight percentages of APTMS solutions were prepared to test the effect on bonding efficiency. To bond the PDMS to the SU-8, the PDMS sheet was first exposed to an oxygen plasma for 10 s at a pressure of 550 mTorr using an extended plasma cleaner from Harrick Plasma Inc. The PDMS was quickly removed from the chamber and the bonding side was completely coated with the
Micromachines 2012, 3
65
prepared APTMS solution. Excess solution was blown off with a gentle flow of nitrogen. The PDMS sheet deforms significantly at this point when coated with solutions containing toluene or hexane, but returned to the original geometry as the solvent evaporated. After a period of time, the prepared PDMS sheet was brought into contact with the SU-8 device after careful alignment and subsequently heated at 100 °C for 1 h to drive the bonding reaction. A small weight was applied to the top of the PDMS to ensure good and complete contact with the SU-8 device surface. Fluidic connection to the device was done using a newly developed method that has been specially designed to handle high pressures and will be reported shortly. Coupling to the waveguide facets was completed by dicing the wafers at the waveguide facets to then allow for butt-coupling an optical fiber. 2.3. Testing A scratch test involves trying to scratch the bonded PDMS off the SU-8 by applying pressure at the edge of the PDMS sheet with a blunt instrument. The PDMS will either: de-bond from the SU-8, mechanically fracture and leave a thin layer of PDMS still bonded to the SU-8, or some combination of the two leading to the conclusion that bonding is inconsistent over the surface. An image of the sample is taken and subsequently analyzed using image analysis software (PAXit) where the percentage of remaining PDMS (i.e., still bonded) is reported as a percentage. Any PDMS still bonded to the SU-8 means that the bonding strength is larger than the mechanical strength of the PDMS; the larger the surface area of the remaining material, the better the strength and consistency of the bond across the interface. Contrast is added to the sample after the scratching is completed by coloring the exposed SU-8 area with a black ethanol based ink in order to aid the vision software. Confirmation of the beam shape formed by the integrated optics on the device was performed by first injecting the microfluidic channel with a fluorescent dye that completely filled the channel. The beam in the channel could then be imaged directly from above via a CCD camera (Infinity 2–3, Luminera) as the intersection of injected light with dye by filtering out the excitation light using a narrow band pass filter centered at the fluorescent wavelength of 660 nm (Newport). Imaging software was again used to digitize the image for further quantitative analysis by setting pixel limits of 255 for a saturated pixel and 0 for the darkest pixels. Bead flow tests were performed by hydrodynamically focusing a solution containing suspended fluorescent microbeads via a syringe pump (Harvard Apparatus) past the ideally formed optical beam in the channel. The flow ratio of sample to sheath was altered to try to confine the beads as narrowly as possible in the centre of the channel: a 1:10 sample to sheath ratio produced a 3 µm wide stream for 2.5 µm beads and 2:9 ratio produced a 6.5 µm stream width for 6 µm beads. Bead concentrations of 5 × 10⁶ beads/mL were sonicated vigorously to ensure thorough suspension of the beads throughout the liquid. With a sample flow rate of 20 µL/h, devices had a throughput of 27.8 beads/s. Excitation light was provided via an all-guided optics scheme from a 635 nm CW 50 µm core pigtailed variable-power photodiode (Meshtel) butt-coupled to the facet of the waveguide on the device. Signals from the particles were collected using a typical free-space collection scheme common in conventional cytometry, the details of a similar apparatus can be found in the work by Mu et al. [38]. Essentially, an objective is used to form an image of the interrogation point onto a spatial filter, a narrow bandpass
Micromachines 2012, 3
66
filter-centered on the fluorescent wavelength of 660 nm (Omega Optics)-and finally a PMT (Oriel) that is connected to a computer for analysis via a custom LabView program. 3. Results and Discussion The devices designed in this work aim to integrate the microfluidic components, and the optical components necessary for optical excitation, into the same functional layer. The integration of optics to perform the excitation on-chip removes the dependence of complex, bulky, and expensive free-space optics, thus making the device simple and portable. The device design in Figure 1 consists of a waveguide to couple light from an external source to an integrated lens system. This ensures precise alignment between light and microchannel, eliminating sources of error while increasing the robustness of the device once sealed. The lens system serves to focus the divergent light from the waveguide to achieve a beam geometry in the centre of the channel that will enhance the reliability of the optical interrogation of particles. This process of beam shaping is performed in conventional flow cytometry to increase the reliability of detection and is to be mimicked in this work. Lens systems designed in these devices enhance the uniformity of the beam intensity across the sample stream in the channel to ensure that each particle receives an identical optical excitation as it traverses the beam—even despite slight deviations of the particle in the focused sample flow. Furthermore, the width of the beam can be tailored to be narrow enough to reduce the instance of double detections due to two particles in the beam simultaneously. Increasing the reliability of detection with integrated optics allows portable stand alone devices able to perform specific analysis for a fraction of the cost of a conventional machine. Figure 1. Drawing of the device design (a) showing the fabrication steps to form the device layer and the sealing of the channels with the connection to the external pump source. The zoom in (b) shows the critical area of the device where the integrated waveguide-lens system is placed next to the channel where a specifically tailored beam will be formed in the centre of the particle flow.
The device is fabricated as an assembly of three layers as shown in Figure 1(a). SU-8 was chosen to serve as the device material because it is an optically transparent material in the spectrum of light used by conventional optical detection methods. SU-8 is also rigid so that the performance of optical
Micromachines 2012, 3
67
components is not perturbed by distortions of the material that can be caused by the high fluidic pressure. SU-8 processing is well established, simple, and easily scaled as it is based on established photolithography techniques. A Pyrex glass wafer is chosen to serve as the substrate due to its rigidity, the same optical transparency in the spectrum of interest, the low index necessary for optical confinement in the SU-8 layer above, and to allow for off-chip detection. The top layer is PDMS which is a very soft material that can tightly seal the SU-8 layer while allowing easy fluidic interconnects. The index of the PDMS is also less than that of SU-8 allowing waveguides patterned in the device layer to have a strong optical confinement. 3.1. Device Fabrication 3.1.1. SU-8 Patterning Devices made from SU-8 are realized by removing the appropriate material though patterning the layer via a photomask that contains the designed structures. This ensures precise and exact alignment as all devices have been optimized through simulation. A stepping sequence of 9 s of exposure followed by 5 s of relaxation time ensured that mask designs were patterned exactly to the SU-8. Figure 2 shows a SEM image of a fabricated device showing the formed 2D lenses and microchannel with smooth abrupt walls. Figure 2. SEM image of the device showing the waveguide core, lens system, and microchannel.
It is very difficult to bond SU-8 to glass while maintaining the ability to develop fine features in the SU-8 due to their large mismatch of thermal expansion coefficients leading to fracturing and delamination during the baking procedures. We have developed a method to allow very strong bonding of the SU-8 device layer to the glass substrate while still allowing resolution that is fine enough to permit feasible devices through an intermediate layer introduced between the device layer and the glass substrate. This layer is fabricated from a SU-8 blend that has better glass adhering properties and provides enhanced stress relaxation while not deteriorating the performance of the waveguides fabricated on top [39]. The strong bonding between the glass and SU-8 ensures that the devices are sealed properly as leaks cannot form though delaminated areas or fractures.
M Micromachi ines 2012, 3
6 68
3 3.1.2. SU-8 Channel Seealing Usingg PDMS The sealiing of micrrofluidic deevices needss to be stro ong enoughh to withstannd very hig gh pressurees. F Furthermore e, the sealinng method must m have nearly n 100% % surface contact c at thhe interface as the smaall d dimensions of features place them m in extremeely close prroximity. Leaking L from m channel to t channel or o c channel to waveguide w will occur if even a small s surfacce area is poorly p bondded as the bond b will be b b broken by the t large fluidic f pressure. Thereefore, a meethod to foorm a stronng bond wiith complette innterfacial contact is neecessary to form feasibble devices. The bondiing methodd must also not interferre w the opttical compoonents on thhe chip as sccattering an with nd loss of a guided moode conditio on can rendeer thhe optical components c too inefficiient for feassible applicaation. The combbination off SU-8 and PDMS for device fabrrication is a natural onne. PDMS is i a very sooft m material andd is easily deformed to form coomplete and d constant conformingg contact with w a paireed s surface whille not deforrming to thee extent whhere it would d block funnctional devvices formed d by voids in i thhe SU-8 layyer below. Holes are easily e fabriccated in thee PDMS layyer and the elasticity of o the PDM MS a allows for simple s interrfacing betw ween the microfluidics m s and the exxternal connnections. PD DMS is alsso o optically traansparent inn the opticaal spectrum m of interest and has a smaller inndex than that t of SU--8 e ensuring thee waveguidee cores form med by the SU-8 S maintain a guidinng conditionn and don’t leak into thhe P PDMS layerr. Cured PD DMS and SU U-8 are botth crosslinked materials and cannoot be physiccally bonded together as a itt is impossiible for the polymer chhain segmeents to entan ngle into thhe bulk of tthe other to o form stronng a adhesion. However, devveloped SU U-8 still has sufficient epoxy e groupps on the suurface that are availablle f reaction if it is bakked at the recommend for r ded conditio ons (95 °C at 5 min) [40]. By modifying m thhe P PDMS surfaace with ann amino grooup, the PD DMS surfacee can then be b chemicaally bonded d to the SU--8 s surface throough an am mine-epoxidde reaction [40]. Amination of the t PDMS surface is possible by b a attaching ann aminoproppyltrimethoxysilane (A APTMS) mo olecule to one o of the ssilanol grou ups generateed o the PDM on MS surface after a an oxyygen plasmaa treatment. The introdduced aminno groups caan then reacct w the epooxy groups on the SU-8 surface to with t establish h a strong bond b across the entire PDMS/SU--8 innterface. Thhis process of generatinng silanol groups g on th he PDMS thhen aminizinng the PDM MS surface by b a attaching AP PTMS is illuustrated in Figure F 3. Figuree 3. The chemical c p process of covalently attaching aminopropy a yltrimethoxy ysilane (APTM MS) to polyy(dimethylsiiloxane) (PD DMS) surfaace. The am mine groups are now av vailable to reacct with the epoxy e groupps on the SU U-8.
A couplee of factors were observved to affecct the qualitty of the atttachment off APTMS to o the oxygeen p plasma activvated PDMS S surface annd thus, thee quality off the bondinng with the SU-8. The solvent useed too prepare the t APTMS S solution is an imporrtant factor that affectss bonding oof the devicces. Ethanool,
Micromachines 2012, 3
69
hexane, and toluene were used to form the APTMS solution with various weight percentages of APTMS ranging from 0.1% to 1% for the attachment of APTMS to PDMS. The modified PDMS was attached to SU-8, and the bond was analyzed by the scratch test. Table 1 summarizes the results using the different solutions of APTMS. It is clear that ethanol does not permit bonding no matter what the concentration of APTMS used. A residue in the shape of the placed PDMS piece remained on the SU-8 surface that could not be washed away suggests that the APTMS failed to be chemically attached to the PDMS but was able to bond to the residual epoxy molecules of the SU-8. This was most likely due to the presence of water molecules in ethanol causing the methoxy groups of the APTMS to hydrolyze and then react with each other. Both hexane and toluene are immiscible in water and would not be prone to the same degree of hydrolyzation of the APTMS molecules in solution. As expected, hexane did fare better than ethanol, however the bonding provided was inconsistent and was never able to provide full bonding throughout the entire interface. Toluene was determined to be the most effective solvent for use in the process as it provided almost total bonding at every concentration applied. It was noted during tests that solutions work best when they are prepared right before use and care should be taken to not touch the surface of the PDMS after exposure to the oxygen plasma as it was noted that the bond would not result in these areas. Table 1. Effect of solvent on SU-8–PDMS bonding using three different APTMS concentrations. Concentration (wt% APTMS) 1 0.5 0.1
Fracture in PDMS (%) Ethanol Hexane Toluene 0.5 75–90 95–100 0.5 75–90 95–100 0.5 75–90 95–100
With the solvent and concentration determined, the effect of the drying time of the APTMS-coated samples on the bonding was explored. This test was necessary because PDMS swells with the toluene thus deforming the sealing layer making alignment and bonding quite difficult unless all toluene has evaporated. Three different concentrations of APTMS solutions were applied to oxygen plasma treated PDMS and left with varying drying times before their attachment to SU-8. A scratch test was performed to determine the quality of bonding. Table 2 summarizes the results. There was, again, little variation in bonding caused by the weight percentage of APTMS in the solution. Samples left to dry for up to two hours provided strong bonding, while samples with four hours of drying time showed variation and inconsistency in the bonding quality. Samples that were left to dry for one or two days had bonding that was poor while samples that were left to dry longer exhibited no bonding capacity at all. Thus, two hours was deemed to be the maximum allowable drying time which will not affect the bonding—a reasonable time as PDMS was found to quickly return to its deformed-free state and the process rarely took more than 30 min to complete.
Micromachines 2012, 3
70
Table 2. Effect of drying time of APTMS treated PDMS on bonding to SU-8. Drying Time 1–2 min 30 min 1 hour 2h 4h 1 day 2 days 4 days 1 week 2 week
Fracture in PDMS (%) 1 wt% APTMS 0.5 wt% APTMS 0.1 wt% APTMS 95–100 95–100 95–100 95–100 95–100 95–100 95–100 95–100 95–100 95–100 95–100 95–100 85–95 75–85 75–85 40–60 25–40 25–40 0–10 0–10 0–10 0–5 0–5 0–5 NA NA NA NA NA NA
This method was found to be very forgiving when performing alignment of the PDMS with the SU-8 devices as contact could be made, broken and repeated several times without a noticeable detriment to the bonding between the two materials. Figure 4(a) shows a picture of a packaged device and Figure 4(b) shows a magnified cross-section of the device showing a waveguide facet. The voids formed on either side of the waveguide (and those forming the channel) are clean and completely empty ensuring proper operation as debris will not block channels or cause scattering from the waveguide. The vertical walls and sharp corners show excellent resolution in the photolithographic process and thus, excellent reproduction of the photomask and high quality devices. The PDMS cover layers makes contact across the surface—even across the narrow 50 μm wide waveguide—while not deforming at all into the voids of the SU-8 layer that make the device structures, and therefore ensures proper and efficient bonding for the device. Figure 4. Picture of the fabricated device (a) with a detailed cross-sectional view to show the device layers and bonding contact quality (b).
3.2. Device Performance 3.2.1. Beam Shaping Light provided to the lens system via the integrated waveguide suffered minimal propagation and coupling losses measured to be 2.5 dB/cm and 0.5 dB, respectively. Images of the shaped beam in the
Micromachines 2012, 3
71
channel are shown in Figure 5. These images clearly show that the input from the waveguide can form a beam shape of varying geometry in the channel with only simple changes to the lens system in the designed photomask. These different beam shapes can be employed to optimize the optical interrogation for many different targeted sample specimen sizes. The small beam waist in Figure 5(a) shows a very distinctive bowtie shape [41] and is a consequence of the large demagnification and very large image space NA of the lens system as a 50 µm input is focused to a 6 µm spot. The 6 µm lens system has a designed input NA of 0.083, so with a magnification of 0.12 the image space NA is 0.692. Details of lens designs and parameters were reported in another work [25]. This is a trade-off for forming smaller beam sizes for smaller particle detection [25] but is necessary to keep double detection events minimized. The beam intensity from the 6 µm device in the central portion of the bowtie shape–forming a 6 µm wide by 9 µm long region-shows very uniform intensity and is ideal to ensure uniform excitation of interrogated particles as they pass through the beam. The 25 µm beam in Figure 5(b) shows a beam with near uniform intensity across the channel, however, the beam is of lesser quality due to the preservation of the multimodal shape from the waveguide. Smaller particles would show much more fluorescence variation as they traverse this beam. Furthermore, many small particles could fit within this beam leading to confusion between single and double detections—which could be solved by severely diluting the sample concentration; however this increases run time and decreases throughput drastically. Figure 5. Images of the shaped beam in the channel with (a) 6 μm beam waist, (b) 25 μm beam waist. Light is injected from the bottom while beads flow left to right and would be confined into the centre (vertically) region of the beam.
Figure 6 shows a plot of the intensity of each beam in Figure 5 as a function of the cross channel direction–the beam axis perpendicular to the particle flow. As noted previously, the intensity of the 25 µm beam does not vary much as it traverses the channel. This is because the NA of the lens is small and the divergence of the beam is small as a result leaving the overall Super-Gaussian shape of the input beam largely unaltered except for magnifying it by a factor of 0.5. Though the intensity is largely uniform across the channel, there would still be large variability in detection as the beam quality from left to right in Figure 5(b) is variable and the beam is so wide that multiple particles could be detected simultaneously leading to detection confusion. The 6 µm beam has a narrow region of near uniform intensity across the centre of the channel due the large image space NA. A particle is easily confined via hydrodynamic focusing to this narrow region, and the reliability of detection can be significantly improved as the particle can still deviate ~8 µm from either side of the centre of the channel with
Micromachines 2012, 3
72
negligible change to the excitation intensity as it traverses the beam. Detection reliability is also increased due to much smaller probability of double detection. Note also that the intensity of each of the beams is the same in the narrow area in the centre of the channel. This is slightly coincidental due to coupling variation, but it is also expected as the 6 µm lens system has lower collection efficiency from the waveguide than the 25 µm lens system. This will lower the power available to focus; however, the intensity is increased due to the focusing of the light into a smaller region. Therefore, intensity of the excitation suffers little to no detriment and could be improved with advanced lens structures to increase the input NA of the lens system. Figure 6. Plot showing the intensity of the beam as a function of the cross channel dimension. The x dimension is the vertical direction of the pictures in Figure 5.
3.2.2. Bead Detection Figure 7 shows the results from a fluorescent bead counting test done with 2.5 µm beads. The beads were confined to a 3 µm region in the centre of the channel via hydrodynamic focusing. The runtime data in Figure 7(a) shows a sample of 5 s from the raw data with the individual intensity bursts from the beads clearly visible. The burst intensities are of near uniform height due to the uniform excitation region and ensure reliable and repeatable detection. The histogram in Figure 7(b) shows the collection of all burst intensities over the entire 100 s test and the measure of device performance—the coefficient of variation (CV = σ/μ × 100%)—is calculated as 9.03%. The smaller the CV the better the performance of the device as identical beads should fluoresce identical intensities and yield a CV of 0. However, the detected signals will naturally vary due to errors in the device and from the variation in the manufacturing process of the beads and it is necessary to try to minimize this variability as much as possible. Note a significant lack of events near a value of twice the peak intensity of the histogram indicating that despite bursts in the raw data appearing to happen nearly simultaneously they are resolved as individual beads due to the narrow beam waist.
Micromachines 2012, 3
73
Figure 7. Results of a fluorescence test from 2.5 μm beads in a device that forms a 6 μm beam waist. Real-time data (a) shows the reliable detection and superior performance as the burst intensities are concentrated around a constant value in the histogram (b). The CV of this particular run was 9.03%.
The bead flow test was repeated with 6 µm beads confined to a 6.5 µm wide sample stream width. Figure 8(a) shows another 5 second sample of the runtime data and Figure 8(b) shows a histogram from the entire test. The peaks in the raw data show more variability than in the previous test-as expected as larger beads will show more variability due to a larger value in manufacturing tolerance. The CV is calculated to be 13% in this instance–slightly larger than the CV from the smaller beads. Again, there are negligible events at an intensity that would indicate a double detection meaning that the beam is ideally shaped. The large instance of low intensity events is believed to be from beads escaping from the sample stream into the sheath stream and traversing the beam in the dim divergent regions near the channel wall at the top and bottom of the image in Figure 5(a). This could be remedied by relaxing the hydrodynamic focusing conditions–something that is permitted with these devices as the uniform beams will ensure uniform excitation from the relaxed confinement of the flow stream. Figure 8. Results of a fluorescence test from 6.0 μm beads in a device that forms a 6 μm beam waist. The burst peaks in the real-time data (a) have a slightly larger variation and show a greater spread around a central mean in the histogram (b). The CV of this particular run was 13%.
Micromachines 2012, 3
74
The bead flow test was repeated with each bead size separately but instead using a device that formed a 12 µm beam width. The measured CV for each run was 23%. This is still an acceptable value; however it would limit the resolution of the cytometer and thus the applications. The double detection events also increased noticeably, but would still be considered negligible for most applications. In conventional cytometry a CV value within the range of 5 to 15% is common and routinely achieved. With the devices fabricated and tested in this work, the measured CVs were within this range and were found to be repeatable through multiple runs. This indicates that the analytical accuracy of a conventional machine can be mimicked in a microchip based. Conventional flow cytometers can achieve the best CVs because they are flexible machines that perform every kind of analysis feasible by employing a variety of beam shapes, using 3D hydrodynamic focusing, compensating for double detections by diluting the sample solution, using very efficient free-space optics, and measuring many detection parameters to resolve difficult to perceive differences. Microchip based devices will never be able to mimic the flexibility of a conventional machine, but will be able to mimic the power in a very specific application–such as is demonstrated with these devices as the specific beam shape and configuration is able to perform very reliable detection of 2.5 and 6.0 μm beads at a single wavelength. This device is an inexpensive, compact, and easy to use device that expands the application of flow cytometry to remote and POC medical applications. Our devices show excellent detection capabilities with on-chip optics. Further improvement could be made in the future as more powerful integration capabilities are developed, such as through 3D hydrodynamic focusing and optical multiplexing. The devices in this work show detection capabilities that are on the leading edge of current microchip devices reported in the literature. A microchip device that seeks to improve reliability of detection through the use of on-chip 3D hydrodynamic focusing and regular free-space excitation and detection schemes showed CV values of 15.2% and 9.3% for 7.32 μm and 8.32 beads, respectively [42]—similar values to those measured in this work. However, the device tested in that work still relied on free-space optics that are similar in conventional machines in many respects, thereby limiting the LOC applications. Another group employed beam shaping on-chip by utilizing astigmatic focusing to form a narrow strip of light across the channel though use of a DOE manufactured by electron beam lithography (EBL) on the top surface of the device and a TEM00 beam for excitation [33]. The device demonstrated CVs of 22% for 2 µm beads and were achieved with very low hydrodynamic focusing. The devices in this work also show superior performance in comparison with the reported devices with integrated waveguides. A device that integrated 3D hydrodynamic focusing and fibers onto the chip demonstrated a CV of 15% using 6 µm beads [43]. A highly integrated device with waveguides and a lens system demonstrated CVs of 32.9% and 19.1% for 4 µm and 8 µm beads respectively [44]. 4. Conclusions The design, fabrication, and performance of a photonic-microfluidic integrated device, is demonstrated to have excellent reliability in simple fluorescence detections that is comparable to that of conventional cytometry. SU-8 devices were fabricated on glass using an intermediate layer of SU-8 to manage the stress while a novel method for chemically bonding PDMS to SU-8 was developed and successfully applied to seal the SU-8 devices. The manufactured devices demonstrated the ability to
Micromachines 2012, 3
75
mimic the conventional free-space optical based practice of beam shaping in an on-chip simple integrated fashion. This improved the performance of the devices by tailoring a uniform optical intensity across the sample flow to ensure repeatable fluorescence signals while limiting the chance of double detections. These devices are a step in the direction towards a fully integrated device for applications requiring very simple, accurate, and inexpensive detection. Acknowledgments Thanks to Frances Lin, Rubin Ma, and Jian Sun for their expertise with wafer dicing. Thanks to Ping Zhao and Canjun Mu for help and valuable discussions and advice with respect to device fabrication, assembly, and packaging. References 1. 2. 3. 4.
5.
6. 7. 8.
9. 10. 11. 12. 13.
Whitesides, G.M. The origins and future of microfluidics. Nature 2006, 442, 368–373. Krogmeier, J.R.; Schaefer, I.; Seward, G.; Yantz, G.R.; Larson, J.W. An integrated optics microfluidic device for detecting single DNA molecules. Lab Chip 2007, 7, 1767–1774. Squires, T.M.; Quake, S.R. Microfluidics: Fluid physics at the nanoliter scale. Rev. Mod. Phys. 2005, 77, 977–1026. Manz, A.; Harrison, D.J.; Verpoorte, E.M.J.; Fettinger, J.C. Planar chips technology for miniaturization and integration of separation techniques into monitoring system–Capillary electrophoresis on a chip. J. Chromatogr. 1992, 593, 253–258. Harrison, D.J.; Fluri, K.; Seiler, K.; Fan, Z.; Effenhauser, C.S.; Manz, A. Micromachining a miniaturized capillary electrophoresis-based chemical analysis system on a chip. Science 1993, 261, 895–897. Xia, Y.; Whitesides, G.M. Soft lithography. Annu. Rev. Mater. Sci. 1998, 28, 153–184. Duffy, D.C.; McDonald, J.C.; Schueller, O.J.A.; Whitesides, G.M. Rapid prototyping of microfluidic systems in poly(dimethylsiloxane). Anal. Chem. 1998, 70, 4974–4984. Chang, C.M.; Hsiung, S.K.; Lee, G.B. Micro flow cytometer chip integrated with micro-pumps/micro-valves for multi-wavelength cell counting and sorting. Jpn. J. Appl. Phys. 2007, 46, 3126–3134. Thorsen, T.; Maerkl, S.J.; Quake, S.R. Microfluidic large-scale integration. Science 2002, 298, 580–584. Zhang, C.; Xing, D.; Li, Y. Micropumps, microvalves, and micromixers within PCR microfluidic chips: Advances and trends. Biotechnol. Adv. 2007, 25, 483–514. Stroock, A.D.; Dertinger, S.K.W.; Ajdari, A.; Mezic, I.; Stone, H.A.; Whitesides, G.M. Chaotic mixer for microchannels. Science 2002, 295, 247–251. deMello, A. Control and detection of chemical reactions in microfluidic systems. Nature 2006, 442, 394–402. Fu, A.Y.; Chou, H.P.; Spence, C.; Arnold F.H.; Quake, S.R. An integrated microfabricated cell sorter. Anal. Chem. 2002, 74, 2451–2457.
Micromachines 2012, 3
76
14. Wolff, A.; Perch-Nielsen, I.R.; Larsen, U.D.; Friis, P.; Goranovic, G.; Poulsen, C.R.; Kutter, J.P.; Telleman, P. Integrating advanced functionality in a microfabricated high-throughput fluorescent-activated cell sorter. Lab Chip 2003, 3, 22–27. 15. Ramsey, J.M.; Jacobson, S.C.; Knapp, M.R. Microfabricated chemical measurement systems. Nat. Med. 1995, 1, 1093–1096. 16. Hong, J.W.; Quake, S.R. Integrated nanoliter systems. Nat. Biotechnol. 2003, 21, 1179–1183. 17. Ocvirk, G.; Munroe, M.; Tang, T.; Oleschuk, R.; Westra, K.; Harrison, D.J. Electrokinetic control of fluid flow in native poly(dimethylsiloxane) capillary electrophoresis devices. Electrophoresis 2000, 21, 107–115. 18. Bliss, C.L.; McMullin, J.N.; Backhouse, C.J. Rapid fabrication of a microfluidic device with integrated optical waveguides for DNA fragment analysis. Lab Chip 2007, 7, 1280–1287. 19. Krogmeier, J.R.; Schaefer, I.; Seward, G.; Yantz, G.R.; Larson, J.W. An integrated optics microfluidic device for detecting single DNA molecules. Lab Chip 2007, 7, 1767–1774. 20. Salehi-Reyhani, A.; Kaplinsky, J.; Burgin, E.; Novakova, M.; deMello, A.J.; Templer, R.H.; Parker, P.; Neil, M.A.A.; Ces, O.; French, P.; et al. A first step towards practical single cell proteomics: A microfluidic antibody capture chip with TIRF detection. Lab Chip 2011, 11, 1256–1261. 21. Jiang, H.; Weng, X.; Li, D. Microfluidic whole-blood immunoassays, Microfluid. Nanofluid. 2011, 10, 941–964. 22. Wu, M.-H.; Cai, H.; Xu, X.; Urban, J.P.G.; Cui, Z.-F.; Cui, Z. A SU-8/PDMS hybrid microfluidic device with integrated optical fibers for online monitoring of lactate. Biomed. Microdev. 2005, 7, 323–329. 23. Mogensen, K.B.; El-Ali, J.; Wolff, A.; Kutter, J.P. Integration of polymer waveguides for optical detection in microfabricated chemical analysis systems. Appl. Opt. 2003, 42, 4072–4079. 24. Watts, B.R.; Kowpak, T.; Zhang, Z.; Xu, C.Q.; Zhu, S. A microfluidic-photonic-integrated device with enhanced excitation power density. Proc. SPIE 2010, 7555, doi:10.1117/12.841046. 25. Watts, B.R.; Kowpak, T.; Zhang, Z.; Xu, C.Q.; Zhu, S. Formation and characterization of an ideal excitation beam geometry in an optofluidic device. Biomed. Opt. Exp. 2010, 1, 848–860. 26. Hsiung, S.K.; Lin, C.H.; Lee, G.B. A microfabricated capillary electrophoresis chip with multiple buried optical fibres and microfocusing lens for multiwavelength detection. Electrophoresis 2005, 26, 1122–1129. 27. Hsiung, S.K.; Lee, C.H.; Lee, G.B. Microcapillary electrophoresis chips utilizing controllable micro-lens structures and buried optical fibres for on-line optical detection. Electrophoresis 2008, 29, 1866–1873. 28. Hofmann, O.; Wang, X.; Cornwell, A.; Beecher, A.; Raja, A.; Bradley, D.D.C.; deMello, A.J.; deMello, J.C. Monolithically integrated dye-doped PDMS long-pass filters for disposable on-chip fluorescence detection. Lab Chip 2006, 6, 981–987. 29. Bliss, C.L.; McMullin, J.N.; Backhouse, C.J. Integrated wavelength-selective optical waveguides for microfluidic-based laser-induced fluorescence detection. Lab Chip 2007, 7, 143–151. 30 Yamazaki, M.; Hofmann, O.; Ryu, G.; Xiaoe, L.; Lee, T.K.; deMello, A.J.; deMello, J.C. Non-emissive colour filters for fluorescence detection. Lab Chip 2011, 11, 1228–1233. 31. Seo, J.; Lee, L.P. Diposable integrated microfluidics with self-aligned planar microlenses. Sens. Actuat. B 2004, 99, 615–622.
Micromachines 2012, 3
77
32. Wang, Z.; El-Ali, J.; Engelund, M.; Gotsaed, T.; Perch-Nielsen, I.R.; Mogensen, K.B.; Snakenborg, D.; Kutter, J.P.; Wolff, A. Measurements of scattered light on a microchip flow cytometer with integrated polymer based optical elements. Lab Chip 2004, 4, 372–377. 33. Schonbrun, E.; Steinvurzel, P.E.; Crozier, K.B. A microfluidic fluorescence measurement system using an astigmatic diffractive microlens array. Opt. Express 2011, 19, 1385–1394. 34. Yao, B.; Luo, G.; Wang, L.; Gao, Y.; Lei, G.; Ren, K.; Chen, L.; Wang, Y.; Hu, Y.; Qiu, Y. A microfluidic device using a green organic light emitting diode as an integrated excitation source. Lab Chip 2005, 5, 1041–1047. 35. Balslev, S.; Jorgensen, A.M.; Bilenberg, B.; Mogensen, K.B.; Snakenborg, D.; Geschke, O.; Kutter, J.P.; Kristensen, A. Lab-on-a-chip with integrated optical transducers. Lab Chip 2006, 6, 213–217. 36. Godin, J.; Chen, C.H.; Cho, S.H.; Qiao, W.; Tsai, F.; Lo, Y.H. Microfluidics and photonics for Bio-System-on-a-Chip: A review of advancements in technology towards a microfluidic flow cytometry chip. J. Biophotonics 2008, 1, 355–376. 37. Ateya, D.A.; Erickson, J.S.; Howell, P.B., Jr.; Hilliard, L.R.; Golden, J.P.; Ligler, F.S. The good, the bad, and the tiny: A review of microflow cytometry. Anal. Bioanal. Chem 2008, 391, 1485–1498. 38. Mu, C.; Zhang, F.; Zhang, Z.; Lin, M.; Cao, X. Highly efficient dual-channel cytometric-detection of micron-sized particles in microfluidic device. Sens. Actuat. B 2011, 151, 402–409. 39. Kowpak, T.; Watts, B.R.; Zhang, Z.; Zhu, S.; Xu, C.Q. Fabrication of SU-8 microfluidicphotonic-integrated devices on glass. Macromol. Mater. Eng. 2010, 295, 559–565. 40. Zhang, Z.; Zhao, P.; Xiao, G. The fabrication of polymer microfluidic devices using a solid-to-solid interfacial polyaddition. Polymer 2009, 50, 5358–5361. 41. Watts, B.R.; Kowpak, T.M.; Zhang, Z.; Xu, C.Q.; Zhu, S. Formation of bowtie-shaped excitation in a photonic-microfluidic integrated devices. Microw. Opt. Technol. Lett. 2011, 53, 2583–2586. 42. Mao, X.; Lin, S.C.S.; Dong, C.; Huang, T.J. Single-layer planar on-chip flow cytometer using microfluidic drifting based three-dimensional (3D) hydrodynamic focusing. Lab Chip 2009, 9, 1583–1589. 43. Kennedy, M.J.; Stelick, S.J.; Sayam, L.G.; Yen, A.; Erickson, D.; Batt, C.A. Hydrodynamic optical alignment for microflow cytometry. Lab Chip 2011, 11, 1138–1143. 44. Rosenauer, M.; Buchegger, W.; Finoulst, I.; Verhaert, P.; Vellekoop, M. Miniaturized flow cytometer with 3D hydrodynamic particle focusing and integrated optical elements applying silicon photodiodes. Microfluid. Nanofluid. 2011, 10, 761–771. © 2012 by the authors; licensee MDPI, Basel, Switzerland. This article is an open access article distributed under the terms and conditions of the Creative Commons Attribution license (http://creativecommons.org/licenses/by/3.0/).