from 2007 to 2008 and considerable price decrease shows that price ...... Assink, M. (2006) Inhibitors of disruptive innovation capability: a conceptual model.
JÖ N K Ö P I N G I N T E R N A T I O N A L BU SI N E SS SC H O O L JÖ N KÖ P IN G U N IVERSITY
Factors A ffecting C onsumer R esistance t o Innovation -A study of Smartphones-
Master Thesis within Business Administration Author:
Kamran Khan Kim Hyunwoo
Tutor:
Desalegn Abraha
Jönköping
May 2009
Abstract Background: In mobile phone industry, Smartphones are gaining popularity as an effective communication tool, providing users with “Smart” functionalities of both cellphone and Personal Digital Assistant (PDA). Experts in mobile industry expect that smartphones are going to be dominant in mobile phone market. However, Smartphone industry is facing a different reality, with its declining sales and less market share, forcing research companies (Gartner, Canalys, etc.) to change their expectations. This situation leads us to another important and often ignored perspective of innovation challenges, i.e. consumers' resistance; as consumers' adoption and purchase decision makes a significant difference in the success of innovative products. Problem: Innovation has been called as a key factor for companies to survive and grow in the long run, especially in the dynamic & complex markets and uncertain economic circumstances. Despite the successful outcome of innovations, inhibition or delay in the diffusion of innovation may translate this success into market failure, where resistance has been called as one of the main reasons for inhibiting or delaying the innovation diffusion. Consumers adoption of innovation depend upon several factors: the most important of which are specified as consumers’ characteristics (psychological characteristics of consumers; how they view the innovativeness with respect to that particular product), and the innovation characteristics (outcome and effects of innovation). Past research on innovation & consumers characteristics represents good relationship among the innovation/consumers factors and the adoption/implementation of that innovation by consumers. Purpose: The purpose of this study is to identify and analyze the relationship between consumers' resistance and different factors from innovation and consumers' characteristics. Thereafter, important factors are identified that mainly affect/determine consumers' resistance to smartphones. Moreover, the inter-relationship (correlation) among the selected factors is found out, to know the affects of each factor on other factors. Method: Following abductive approach, confirmatory factor analysis has been done on pre-test questionnaires to test, improve, and verify the constructs (variables/questions) for measuring the hypothesized factors. A theoretical model has been proposed from the hypotheses; and Structural Equation Modeling has been applied, where results are estimated through Partial Least Square and AMOS approaches, using a sample of 330 respondents from Sweden. SmartPLS software has been used to estimate results, thereafter, AMOS has been used to check and verify the results. Almost same results have been derived from both approaches, while results from PLS are found as more satisfactory. Conclusions: Five out of eight hypotheses have been supported by our empirical data, where H1 i.e. relative advantage, H3 i.e. complexity, and H4 i.e. perceived risk, are from innovation characteristics, while H6 i.e. motivation, and H7 i.e. „favorable attitude towards existing products‟ are from consumers' characteristics. Motivation, Complexity, Relative Advantage, and Perceived Risk are found as important factors (as per their order) that affect/determine consumers' resistance to smartphones. Relative Advantage & Motivation are found as positively correlated, and Perceived Risk & Complexity are found as positively correlated. Negative correlation has been found between Perceived Risk and relative advantage. Similarly, negative correlation has been found between motivation and complexity. The proposed model of consumers resistance to smartphones shows an acceptable goodness of fit, where 65% (R-square value) of variation in consumers resistance is caused/explained by the hypothesized factors.
i
Acknowledgement Thesis writing is always a great source of learning and experiences, which cannot be done only with one owns efforts, but also dependent on tremendous help from supervisor, faculty members, friends, and family. First, we would like to express our deepest gratitude to our supervisor Desalegn Abraha, who provided us guidance, critical evaluation and constructive feedback throughout the process of thesis writing. Our sincere thanks go to Andreas Stephen (faculty member), who discussed and explained different statistical methods/tools to achieve the objectives of this study. We are thankful to all those friends who helped us improve, distribute, and respond to the questionnaires. Our colleagues within the seminar group remained a good source of critical feedback and helpful ideas/suggestions that made this work interesting and also challenging for us. Last but not the least; we would like to thanks our family members for their patience, encouragement, and support to complete this study.
Kamran Khan
&
Kim Hyunwoo
Jönköping International Business School, Sweden May, 2009
2
Table of Contents 1 Introduction ............................................................................... 6 1.1 1.2 1.3 1.4 a. b. 1.5
Background ............................................................................................6 Problem discussion ................................................................................7 Research questions .............................................................................. 10 Purpose ................................................................................................ 10 Hypothesis ............................................................................................ 10 Regression coefficients and Correlation ............................................... 11 Delimitations ......................................................................................... 11
2 Frame of reference .................................................................. 12 2.1 Innovation ............................................................................................. 12 2.1.1 Technological Innovation ...................................................................... 12 2.1.2 Types of Innovation .............................................................................. 12 2.2 Smartphone .......................................................................................... 13 2.3 Innovation Resistance .......................................................................... 13 2.4 Sheth Model ......................................................................................... 15 2.5 Ram’s Model ........................................................................................ 16 2.6 Yu and Lee Model ................................................................................ 17 2.7 Technological Acceptance Model (TAM) .............................................. 17 2.8 Related studies ..................................................................................... 18 2.9 Factors Affecting Consumers’ Resistance ............................................ 19 2.9.1 Innovation Characteristics Factors ....................................................... 20 2.9.2 Consumers Characteristics Factors...................................................... 23 2.10 Hypotheses formulation ........................................................................ 25 2.10.1 Relative Advantage .......................................................................... 26 2.10.2 Compatibility ..................................................................................... 26 2.10.3 Complexity ....................................................................................... 26 2.10.4 Perceived Risk ................................................................................. 26 2.10.5 Expectation for better products ........................................................ 26 2.10.6 Motivation ......................................................................................... 27 2.10.7 Attitude towards existing products .................................................... 27 2.10.8 Self-Efficacy ..................................................................................... 27 2.11 Theoretical Model of Consumers Resistance to Smartphones ............. 28
3 Method ..................................................................................... 29 3.1 3.2 3.3 3.4 3.5 3.6 3.7 3.8 3.8.1 3.8.2 3.9 3.9.1
Research Philosophy............................................................................ 29 Research Approach .............................................................................. 30 Research Method ................................................................................. 31 Research Strategy ................................................................................ 31 Data Collection ..................................................................................... 31 Sampling .............................................................................................. 32 Data Analysis and Tools ....................................................................... 33 Statistical Methods ............................................................................... 34 Factor analysis ..................................................................................... 34 Hypothesis testing ................................................................................ 35 Trustworthiness of the Research .......................................................... 36 Validity & Reliability .............................................................................. 36
3
3.9.2 Source of Empirical data ...................................................................... 37 3.9.3 Approach followed to derive results ...................................................... 37
4 Empirical Findings .................................................................. 38 4.1 4.1.1 4.1.2 4.1.3 4.2
Preliminary Analysis ............................................................................. 38 Confirmatory Factor Analysis ............................................................... 38 Consistency (Reliability) Analysis ......................................................... 40 Variables Operationalization & Designing questionnaire ...................... 41 Descriptive Findings ............................................................................. 42
5 Analysis ................................................................................... 43 5.1 5.1.1 5.1.2 5.1.3 5.1.4 5.2
Testing Hypotheses .............................................................................. 43 Partial Least Square ............................................................................. 43 AMOS ................................................................................................... 44 Results Discussion ............................................................................... 45 Regression Equation ............................................................................ 48 Factors Inter-relationship (Correlation) ................................................. 48
6 Conclusion .............................................................................. 50 6.1
Suggestions for further research .......................................................... 51
7 References............................................................................... 52 8 Appendix.................................................................................. 60 8.1 8.2 8.2.1 8.2.2 8.2.3 8.2.4 8.2.5 8.2.6 8.2.7 8.2.8 8.2.9 8.3 8.4
Pre-test Questionnaire.......................................................................... 60 Graphical Representation of factors and measuring variables ............. 60 Relative Advantage .............................................................................. 60 Compatibility ......................................................................................... 60 Complexity ............................................................................................ 61 Perceived Risk ..................................................................................... 61 Expectation for better Products ............................................................ 62 Motivation ............................................................................................. 62 Attitude towards Existing Products ....................................................... 63 Self-Efficacy ......................................................................................... 63 Consumer Resistance .......................................................................... 64 Factor Loadings from the final empirical data ....................................... 65 Appendix 2: Final Questionnaire .......................................................... 65
4
List of Figures & Tables 1
Figure 2.1 .................................................................................................... 14
2
Figure 2.2 .................................................................................................... 15
3
Figure 2.3 .................................................................................................... 16
4
Figure 2.4 .................................................................................................... 17
5
Figure 2.5 .................................................................................................... 28
6
Figure 5.1 .................................................................................................... 43
7
Figure 5.2 .................................................................................................... 44
8
Figure 5.3 .................................................................................................... 45
1
Table 4.1 ..................................................................................................... 38
2
Table 4.2 ..................................................................................................... 41
3
Table 4.3 ..................................................................................................... 41
4
Table 4.4 ..................................................................................................... 42
5
Table 5.1 ..................................................................................................... 46
6
Table 5.2 ..................................................................................................... 47
7
Table 5.3 ..................................................................................................... 49
List of abbreviations used CR= Consumers Resistance RELADV = Relative Advantage COMP = Compatibility CLEX= Complexity PRISK= Perceived Risk EXPBPR= Expectations for Better Products ATEXPR=Attitude toward Existing Products MOTIV= Motivation
SE= Self-Efficacy SEM = Structural Equation Modeling CFA= Confirmatory Factor Analysis EFA= Exploratory Factor Analysis PLS= Partial Least Square AMOS= Analysis of Moment Structures PDA= Personal Digital Assistant SPSS= Statistical Package for Social Sciences
Notes The terms, Innovation resistance and consumers' resistance have been used interchangeably. Similarly the terms like; consumers, respondents, and users are used interchangeably. The term “consumers” has been used for potential consumers of Smartphones.
5
1
Introduction
This chapter aims to introduce the reader to the background of the study topic, the problem area and a brief discussion of related studies. The research questions are formulated, followed by the purpose, hypothesis, and delimitation of this study.
1.1
Background
The trend in mobile phone innovations is going toward a mobile device integrating all the consumer electronic products, like MP3, Camera, Internet (Computer), GPS, and even TV. A new buzzword “SMARTPHONE” (marketing-friendly tag) represent this well known PDA-Cell phone combination (PDA-Phone combo) with manifold functions, representing a radical innovation in mobile phone industry (Park & Chen, 2007). Smartphones are excellent communication tools, providing users with “smart” functionalities of both PDA (Personal Digital Assistants) & cell phones (Nanda et al., 2008). These devices have become an important part of users' life, as they are not only communication tools but also expressions of their lifestyle (Castells, 2006) providing impressive usable interface (Monk et al. 2002). Smartphones are more powerful, with increasing processor capability and storage space, and enhanced communication & multimedia functions (Nguyen et al., 2008). Experts in mobile industry expect that smart-phones are going to be dominant in mobile phone market. However, Smartphone industry is facing a different reality, and the statistics of current market show very less percentage of smart-phone users against traditional/old mobile phone users. According to Gartner, proportion of Smartphone in mobile phone market was at 12 per cent in the fourth quarter of 2008, from 11 per cent in the fourth quarter of 2007. Research companies, who expected explosive growth of Smartphone, are changing their expectations. In March 2009, Gartner said that increase in Smartphone sales started to slow down (Gartner, 2009). The general perception is that high price is the main reason for Smartphones' low market shares (Martin, 2007). However, there is continuous downfall in the prices of Smartphones, and most are available for 200USD (CNET, 2009) which is almost equal to the price of normal mobile phone. Only 1% increase in smart phone market share from 2007 to 2008 and considerable price decrease shows that price remained a least important factor inhibiting the adoption. Smartphone manufacturers may not increase the market shares by simply reducing the prices, as price itself cannot be the main reason for its low market shares. This situation leads us to another important and often ignored perspective of innovation challenges, i.e. consumers‟ resistance. As Smartphones represent “radical innovation” which face considerably more consumers' resistance than “incremental innovation” (Garcia et al., 2007, Heiskanen et al., 2007). Consumer (or end user) adoption and purchase decision make a significant difference in the success of innovative product, so consumers' resistance is one of the important factors in the success of innovation. It can certainly inhibit and/or delay the diffusion of an innovation and thus has important implications for the management of firms (Bradley & Stewart, 2002). Consumers, who resist innovation, are most of the time non-adopters and represent a major part of consumers. These consumers have strong potential for providing valuable information
6
necessary for the development, implementation, and marketing of innovation, and should be given more attention in research studies (Laukkanen et al., 2008). From managerial perspective, studying consumers' resistance to innovation is very important and useful. Understanding resistance will help firms design/develop new products so as to ensure market success, and high product failure rate that is prevalent today, can be reduced. Once firms face consumers‟ resistance to their innovations, they can analyze the underlying causes of resistance, and better be able to design strategies to deal with critical & important resisting factors (Ram, 1987). Studying the factors affecting consumer resistance to Smartphones can provide its manufacturers/marketers with useful information about these important factors that affects consumers' behavior towards innovation.
1.2
Problem discussion
Innovation is a key factor for companies to survive and grow in the long run (Tidd, 2001), and has been called as the lifeblood of most organization (Balachandra & Friar 1997) especially in the dynamic & complex markets, and uncertain economic circumstances (Assink, 2006). Despite the successful outcome of innovations, inhibition or delay in the diffusion of innovation may translate this success in to market failure (Gatignon & Robertson 1991, Crawford 1983, Mahajan et al. 2000). One of the main reasons for inhibiting or delaying the innovation diffusion is consumers‟ resistance, which appears to have been neglected in the academic literature (Ram 1989, Ram & Sheth, 1989) (Laukkanen et al., 2008, Kuisma et al., 2007). Even though the innovative product may provide extensive benefits and improved functionalities, researchers have found that consumers often convey less than enthusiastic response to a number of new products (Gold, 1981; Brod, 1982; Murdock & Franz, 1983; Blackler & Brown, 1985; Salerno, 1985; O'Connor et al., 1990). This response is most usually not expected (Heiskanen et al., 2007) and is expressed in a number of forms, but is usually termed as consumers' resistance (Ellen & Bearden, 1991). Consumers' resistance has been defined as “Innovation resistance is the resistance offered by consumers to an innovation, either because it poses potential changes from a satisfactory status quo or because it conflicts with their belief structure” (Ram & Sheth, 1989, p. 6). The previous research findings imply that firms introducing new products/innovations are required to take consumers' resistance more seriously (Heiskanen et al., 2007). Consumers' resistance plays an important role in the success of innovation, as it can certainly inhibit or delay the consumer adoption. It has been termed as one of the major causes for market failure of innovations (e.g. Ram 1989, Ram & Sheth 1989, Sheth 1981) and also a valuable source of information vital to the successful implementation and marketing of innovation (O'Connor et al., 1990). If the resistance cannot be broken down, adoption slows down, and the innovation is likely to fail (Ram 1989). Firms need to understand consumers resistance, its reasons, and influencing factors; in order to become much more efficient in their improvement efforts, and to identify ways to improve competitiveness, productivity, and profitability (Dunphy & Herbig, 1995). Consumer adoption of innovation depends upon several factors: the most important of which are specified as consumers’ characteristics (psychological characteristics of
7
consumers; how they view the innovativeness with respect to that particular product), and the innovation characteristics (outcome and effects of innovation) (Dunphy & Herbig, 1995, W. Robert, 1998). Innovation characteristics research represents the relationship among the attributes or characteristics of an innovation and the adoption, use, or implementation of that innovation (Tornatzky & Klein, 1982). Robert (1998) argues that, there is a need to identify and understand the factors that seem to most influence customers' resistance to innovative products. It is important to study the effects of important factors (related to consumers' characteristics and innovation characteristics) on consumers' resistance that will reveal the importance of each factor, the intensity of their effect and their relationship. On the other hand, understanding the key factors of consumers and innovation characteristics that affect customers' resistance is crucial for firms' project team to improve its chances of making the right decisions throughout the design and development efforts (W. Robert, 1998). Ram (1987, 1989) argues that, the reasons for innovation resistance vary across different consumers, which affects the adoption processes of each consumer. These variances suggest that firms need to explore the different factors affecting consumer resistance to innovations in order to minimize the possibility of product failure. Part of the problem is that consumers may not understand the characteristics of the innovation in the same way as the manufacturers/marketers (Ellen & Bearden, 1991). It has also been suggested by researchers that smartphone manufacturers/marketers should consider the factors influencing user‟s adoption and resistance to mobile devices (Chang & Chen, 2005). The concept of innovation resistance was presented by Sheth (1981) as the "less developed concept" in diffusion research. He researched psychology of innovation resistance and proposed two psychological constructs which seems very useful in understanding the psychology of innovation resistance. These psychological constructs are; habit/behavior towards existing products and perceived risks associated with innovation adoption. Following this model, Ram (1987) discussed innovation resistance in more details and proposed a detailed model of innovation resistance, based on this model; innovation resistance can be viewed as dependent on three sets of factors: Perceived Innovation Characteristics, Consumer Characteristics, and, Characteristics of Propagation Mechanisms. Ram‟s model was later modified by Lee and Yu (1994), with the argument that consumers' resistance is not dependent on propagation mechanism, as propagation mechanism can only influence innovation diffusion. Numerous studies have applied factors from consumers' characteristics and innovation characteristics to assess consumer adoption of innovation, while some studies have applied these factors to assess consumers' resistance. Below is a brief discussion to mention these studies. Different researchers have analyzed the affects of innovation characteristics on innovation adoption (He et al., 2006, Brown et al., 2003, Tan & Teo, 2000, Holak & Lehmann, 1990, He & Peter, 2007) and some on innovation resistance (Laukkanen et al., 2007, Kuisma et al., 2007). He et al. (2006) analyzed innovation characteristics factors affecting consumers' adoption, and found that compatibility and relative advantage are positively and complexity is negatively related to consumers‟ adoption of online e-payment. Laukkanen et al. (2007) researched innovation characteristics (value, risk, usage, image, etc.) as the barriers that cause innovation resistance to mobile
8
banking among mature consumers. Kuisma et al. (2007) used innovation characteristics and their impact on consumers to analyze the causes of consumers' resistance to internet banking. A number of researchers have applied consumers' characteristics to examine its affects on innovation adoption (Grabner-Kräuter & Faullant, 2008, Wang et al., 2008, Tan & Teo, 2000, Karjaluoto et al., 2002), and also on innovation resistance (Cho Seong & Chang Dae, 2008). These are discussed later in the „frame of reference‟ in detail. Several studies have been found in the literature, that examine consumers’ characteristics and its effects on consumers‟ behavior toward technological innovation, using TAM (Technology Acceptance Model; states that, the intention to use a new technological product is determined by the PU “perceived usefulness” and PEOU “perceived ease of use”) with addition to other factors like risk, self-efficacy etc. (Fang et al. 2005, Lu et al. 2003, Constantiou et al. 2006, Koivumaki et al. 2006, Han et al. 2006, Harkke 2006). A study of physicians' adoption of a mobile system in Finland found that PU among other factors played an important role in physicians‟ intention to use the mobile system (Han et al., 2006; Harkke, 2006). Yang (2005), Yui Chi et al. (2007), and Amin (2008) applied TAM model to examine the affect of consumers’ characteristics factors on their attitude towards mobile commerce, online banking, and mobile phone credit cards respectively. Park and Chen (2007) applied TAM model with addition to “self-efficacy” to study its affect on the adoption of smartphone by medical doctors and nurses. Roberts and Pick (2004) combines the TAM model and innovation characteristics, adding the factors of reliability, security, & cost etc; to analyze the crucial factors affecting corporate adoption of mobile devices. Security risk has been found as critical factor affecting adoption and resistance behavior. The literature review reveals that very less number of studies have investigated factors affecting consumers resistance, and even fewer studies have empirically examined consumers‟ perceptions that can make good understanding of innovation resistance (Park & Chen, 2007). Due to per se different characteristics among consumers, and the varied affect of innovations characteristics on them, both sides' perspectives and factors could cause a significant level of variation in each factor's affects on customers' resistance (He & Peter, 2007). Robert (1998) argues that, there is a need to identify and understand the factors that seem to most influence customers' resistance to innovative products. Awareness of the factors that play an important role in the adoption of innovation is crucial and a smart source of providing useful insights concerning the improvements of chances for customers' acceptance. The study of consumers‟ resistance in the case of smartphone, based on innovation and consumers' characteristics can contribute to the innovation research field, a new breed of information/knowledge regarding consumers' behavior towards newer mobile technology. Ultimately, manufacturers/marketers would be in a better position to predict consumers' reaction/interaction with the new products to minimize/overcome the resulting consumers‟ resistance.
9
1.3
Research questions
a. (i) What are the causal relationships among innovation characteristic factors and consumers' resistance to smartphones? (ii) What are the causal relationships among consumers' characteristic factors and consumers' resistance to smartphones? b. Which factors of consumers' and innovation characteristics affect/determine consumers' resistance to Smart phones?
mainly
c. What is the inter-relationship among the innovation & consumers characteristics factors?
1.4
Purpose
The purpose of this study is to identify and analyze the relationship between consumers' resistance and different factors from innovation and consumers' characteristics. Thereafter, important factors are identified which mainly affect/determine consumers' resistance to smartphones. Moreover, the inter-relationship (correlation) among the selected factors is found out, to know the affect of each factor on other factors. a.
Hypothesis
To answer the first „research question‟, a theoretical model of consumers' resistance to smartphones has been proposed and eight hypotheses (each for one factor) are constructed to find the causal relationships (test the proposed model). This theoretical model is based on some models (Ram‟s, Yu and Lee Model, & TAM) and empirical results from different studies (discussed in the frame of reference). Based on the models and different studies on consumers behavior towards innovation, we propose that; consumers' resistance to adoption of smartphone is mostly determined by innovation characteristics; relative advantage, compatibility, perceived risk, complexity, & expectation for better products, and consumers characteristics; motivation, attitude towards existing products, & self-efficacy. Our eight hypotheses are presented as follow: H1= The lower the Relative Advantage, the higher the consumers' resistance to Smartphones H2= The lower the Compatibility, the higher the consumers' resistance to Smartphones H3= The higher the Complexity, the higher the consumers' resistance to Smartphones H4= The higher the Perceived Risk, the higher the consumers' resistance to Smartphones H5= The higher the Expectation for Better Smartphones, the higher the consumers' resistance H6= The lower the motivation, the higher the consumers' resistance to Smartphones H7= The more favorable/positive consumers' Attitude towards normal mobile phones, the higher the consumers' resistance to Smartphones H8= The lower the Self-efficacy, the higher the consumers' resistance to Smartphones
10
b. Regression coefficients and Correlation The second and third „research questions‟ will be answered from the results of regression coefficients and correlation respectively, and will be performed on the same empirical data collected for hypotheses testing.
1.5
Delimitations
This study is only based on those smartphones that fall under our definition for smartphone, and is limited to only young people/consumers (accessible) in Sweden. It is also limited to the opinions of consumers, as responses from mobile industry (manufacturers/marketers) have not been collected.
11
2
Frame of reference
In this chapter, we have discussed relevant theories and models. These theories and model are used to build a theoretical framework and propose a model to be applied on our empirical data; that will enable us to test the hypotheses and fulfill the desired purpose of the study.
2.1
Innovation
An innovation is "an idea, practice, or object that is perceived as new by an individual or other unit of adoption" (Rogers, 1995, p. 11). An innovation may composed of advancement in existing features, or establishment of new features to an existing product/service, or it might be a totally new/innovative product/service introduced in the (same or new) market (Bagozzi & Kyu-Hyun, 1999). 2.1.1
Technological Innovation
Technological „Innovation‟ is an iterative process started by the perception of a new market and/or new opportunity for an invention (technological) which directs to development/improvement, manufacturing, and then marketing tasks essential for the commercial accomplishment of the invention. This reveals two important perspectives, first, the „innovation‟ process comprises the technological development of an invention with addition to the commercial introduction of that invention to consumers, secondly, the innovation process is iterative and hence, instinctively includes the first opening of a new product and the re-opening of an enhanced and developed innovation (Garcia & Calantone, 2002). The commercialization of new product has been termed as the most critical and also crucial activity that renders its accomplishment (Gourville J. 2006). The above definition made it important to clarify and distinguish between an invention and innovation. “A discovery/invention that moves from the lab into production, and adds economic value to the firm (even if only cost savings) is considered an innovation” (Garcia & Calantone, 2002). An invention cannot get turned into an innovation unless & until it pass through the manufacturing/production and marketing activities, so and invention/discovery that does not move towards commercialization remains an invention (Connor & Colarelli, 1998). 2.1.2
Types of Innovation
Generally there are two types of innovation; incremental and radical innovation. In this study we deal with radical innovation. A radical innovation is “a product, process or service with either unprecedented performance features or familiar features that offer significant improvements in performance or cost that transform existing markets or create new ones” (Assink, 2006). It can also be defined as an “innovation that breaks with traditions in the field”. They can also be labeled as radical, discontinuous, generational or breakthrough (Dahlin & Behrens, 2005), and also disruptive innovation (Tushman & Anderson, 1986). Radical innovations are essential and eminent for manufacturers/marketers because of their capabilities to bring new means of competitive advantage, on the other hand they are necessary for consumers as they are the main source of social and economic change in everyday lives (Garcia & Calantone, 2002). The adoption of radical innovations require much more commitment and entail
12
higher expenditure and risks (including learning costs and psychological effort) than the adoption of incremental innovations (Heiskanen et al., 2007).
2.2
Smartphone
While looking for the definition of smartphones, we realized that there is no agreedupon definition of Smartphone. Even, the definition of smart phone has changed over time (Jo B., 2006). The literature discusses several and somehow controversial definitions of Smartphone, however some commonalities can be found in the ways it has been defined. Gartner, a renowned analyst house, defines "Smartphone" as "A large-screen, voicecentric handheld device designed to offer complete phone functions while simultaneously functioning as a personal digital assistant (PDA)" (Jo B., 2006). Palm (a hand-held device manufacturer)‟ definition on Smartphone is “A portable device that combines a wireless phone, e-mail and Web access and an organizer into a single, integrated piece of hardware”, that represents radical innovation in the mobile phone industry (Mike, 2007). According to Yuan (2006), a smartphone, is any electronic handheld device that integrates the accessibility of a mobile phone, personal digital assistant, also called PDA, or other information device. Chang and Chen (2005) mentioned that smartphone devices have one common baseline characteristics: they all provide cell phone, E-Mail/Internet, and basic PDA functionality. For this study, we define smartphones as a device that provides cell phone, EMail/Internet, PDA (personal digital assistant) functionality with full keyboard and relatively big screen. Considering this, we regard the following phones as Smartphones; the cell phone industry also recognizes these devices as Smartphones (CNET, 2009). - Nokia N-series (N70/N73/N78/N79/N80/N81/N82/ N85/N86/N91/N95/N96/N97) - Nokia E-series (E50/E51/E60/E61/E62/E63/E65/E66/E70/E71/E75/E90 Communicator) - Nokia Xpress-Music Series (5700/5730/5800, etc) - Nokia 6300/6500 Classic/ 6600/7610/7650/3250/3620/9290/9300/9500 - Samsung Omnia/Saga/Epix/BlackJack/SPH-M520/SPH-i325/SGH-i718/SCH-i760 - Samsung IP-830W/SCH-i830/SCH-i730/SP-i600/SPH-i700/SPH-i500/SPH-i300/I7500 - Apple iPhone - HTC T-Mobile/Touch Diamond/Touch Cruise/S743/Touch Pro/Fuze - LG KS20 - AT&T 2125/ 3125/8100/8125/8525 - Palm Treo/Centro - RIM Blackberry Storm/Curve 8900/Curve 8330/Bold/Pearl Flip 8200, etc…
2.3
Innovation Resistance
Innovation resistance is consumers' reaction towards an innovation, either because it create potential changes from a satisfactory status quo or because it is in conflict with their belief structure (Ram & Sheth 1989).
13
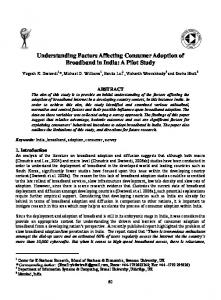
One aspect of innovation resistance is; resistance due to changes imposed by innovation (e.g. changes in consumption or product) and is called resistance to change (Gatignon & Robertson, 1989). Zaltman and Duncan (1977 p. 63) defined this as “any conduct that serves to maintain the status quo in the face of pressure to alter the status quo”. Resistance to change is a natural response of a human being to any changes that disturb the balance of living environment or firms' actions (Watson, 1971; Zaltman & Duncan, 1977). As for innovation resistance, “it is not an innovation per se that people resist but the changes associated with it” (Ellen et al., 1991; Schein, 1985). This creates the postulation of pro-change bias, which means that every innovation is excellent and everyone must implement/adopt it, because success of innovation is inevitable (Dunphy & Herbig, 1995). Innovation resistance has been called as one of the important critical success factors for the adoption of technological innovation (Leonard, 2004), and adoption has been portrayed as the result of overcoming resistance (Szmigin & Foxall, 1998). In another research, adoption and resistance are called as the two ends of a continuum of reaction towards innovation (Lapointe et al., 2002). Ram and Sheth (1989) discovered that, the causes of innovation resistance stem from one or more of the adoption barriers. These barriers are usage, value, risk, image, and traditional barriers. The usage barrier comes when the innovation is not compatible with consumers' existing workflow, practices, or habits. The value barrier is based on the economic value of an innovation that the innovation does not offer strong performance-to-price compared to its alternative products. Risk barrier is the degree of potential risks an innovation may entail. Traditional barrier generally involve the changes an innovation may cause in daily routines, also it “a preference for existing, familiar products and behaviors over novel ones” (Arnould et al. 2004, p.722). The image barrier is associated with the innovations identity (from its origin) like the product category, brand, or the country of origin (Ram & Sheth 1989). Different researchers have found that, even for successful new products, most of the time consumers respond in less than enthusiastic way (Gold, 1981; Brod, 1982; Murdock & Franz, 1983; Blackler & Brown, 1985; Salerno, 1985; O'Connor et al., 1990), this less enthusiasm is often termed as consumers' resistance (Ellen & Bearden, 1991). Consumers‟ resistance plays an important role in the success of innovation, as it can certainly inhibit or delay the consumer adoption, and has been termed as one of the major causes for market failure of innovations (e.g. Ram 1987, Ram & Sheth 1989, Sheth 1981) Resistance leads consumers response towards three forms, it may take the form of direct rejection, postponement or opposition (Szmigin & Foxall, 1998, Mirella et al., 2009). Based on the studies of Mirella et al., (2009) and Szmigin & Foxall (1998), we can represent the concept of consumers' resistance in the figure as:
Postponement
Innovation
Resistance
Fig. 2.1: Concept of consumers' resistance (Derived from Mirella (2009) and Szmigin & Foxall (1998) studies) 14
Opposition
Rejection
Postponement occurs when consumers delay the adoption of an innovation. It simply “refers to pushing the adoption decision to future” (Kuisma et al., 2007). Even though the innovation may be acceptable to them, but usually it is caused by situational factors, like e.g. waiting for the right time, to become capable, or to make sure the product works effectively. Postponement may take the form of acceptance or rejection after a certain time period (Szmigin & Foxall, 1998). Opposition refers to “protesting the innovation or searching for further information after the trial” (Kuisma et al., 2007, p. 464). It is a kind of rejection, but the consumer is willing to test/check the innovation before finally rejecting it. The causes of opposition vary and can be many, e.g. habit resistance, situational factors, and consumers' cognitive style might direct them to reject innovations (Mirella et al., 2009). Most importantly, an opposition might lead the consumers to search for adequate information which can direct them to acceptance. On the other hand consumers might reject an innovation on the basis of existing awareness about the innovation when they understand that it is not suitable for them (Szmigin & Foxall, 1998). Consumers may directly reject an innovation, which is the most extreme form of resistance (Mirella et al., 2009). When a mass of consumers reject an innovation, manufacturers usually change or iterate/modify it appropriately and then re-introduce it in the market. Rejection may occur if the innovation does not offer any valuable advantage, is complex or risky, etc (Szmigin & Foxall, 1998). Rejection can be of two types, passive and active rejection; where passive rejection occur when the innovation is never really adopted or implemented, and active rejection occur when the innovation has been considered but later rejected (Woodside Arch & Biemans Wim, 2005).
2.4
Sheth Model
Sheth (1981) researched psychology of innovation resistance and proposed two psychological constructs, which has been termed very useful in understanding the psychology of innovation resistance. These psychological constructs are; habit/behavior towards existing products and perceived risks associated with innovation adoption.
15
Following this model, Ram (1987) discussed innovation resistance in more details and proposed a detailed model of innovation resistance.
2.5
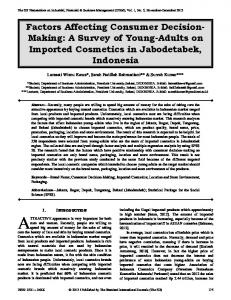
Ram’s Model
According to this model, innovation resistance can be viewed as dependent on three sets of factors; Perceived Innovation Characteristics, Consumers‟ Characteristics, and Characteristics of Propagation Mechanisms, where each set consists of detailed factors. Ram‟s model of innovation resistance is a useful tool for studying innovation resistance, and has been used most widely for assessing consumers‟ resistance to different innovations (Gatignon & Robertson 1991; Rogers 1995).
Fig. 2.3: Ram’s Model of Innovation Resistance
Source: (Ram, 1987)
In 1994 two Korean scholars, Yu and Lee modified Ram‟s model of innovation resistance and have excluded the characteristics of propagation mechanisms claiming that “propagation mechanism” is a barrier to diffusion of innovation from a social perspective rather than source of innovation resistance. Consumers’ characteristics (Im et al. 2003) (Szmigin & Foxall, 1998) (Goldsmith & Hofacker, 1991) and Innovation characteristics (Roger, 1995, Mohr, 2001) (Tornatzky & Klein, 1982) have been termed as important in Ram‟s model of innovation resistance, affecting consumers‟ resistance (Yu & Lee 1994, Midgley & Dowling 1993) (Lassar et al., 2005, Lunsford Dale & Burnett Melissa, 1992). In Ram‟s model of innovation resistance, the factors of innovation characteristics are; relative advantage, compatibility, perceived risk, complexity, and expectations for better products (which are raised by the problem of inhibitory effect on the adoption of other expected Innovations). On the other hand, the factors of consumers‟ characteristics are Perception, Motivation, Personality, Value orientation, Beliefs, Attitude, Previous Innovative Experience, Age, education, and income. All of these
16
factors have different nature of affect on different products and industries, as there is no evidence that these factors are all applicable and have the same affects on different products.
2.6
Yu and Lee Model
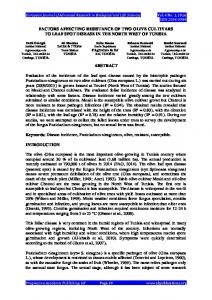
Yu and Lee (1994) modified Ram‟s model of innovation resistance. They distinguished innovation barriers from innovation resistance. According to Yu and Lee, innovation characteristic and consumer characteristic in Ram‟s model generate consumer resistance to innovation. However, propagation mechanism does not generate consumer resistance to innovation but plays a role as a barrier in diffusion of innovation from a social perspective. They claimed that only innovation characteristics and consumer characteristics in Ram‟s model generate innovation resistance.
Fig. 2.4: Lee and Yu model of innovation resistance
2.7
Source: (Lee & Yu, 1994)
Technological Acceptance Model (TAM)
According to TAM, the intention to use a new technology is effected by the PU (perceived usefulness) and PEOU (perceived ease of use) for the specific technology. TAM has been proposed by Davis (1989) and later applied on finding consumers resistance to computer systems (Davis et al 1989). Later on, this model has been extensively applied and extended by researchers to study technology acceptance behavior and to identify the adoption decision determinants of technological innovation (Gefen et al., 2004; Hsu et al., 2004; Luarn & Lin, 2005). TAM is a subset of Ram‟s model, and specifically study technological innovation, where perceived ease of use (PEOU) is derived from complexity and perceived usefulness from relative advantage (Roberts & Pick, 2004). Later on different researchers have chosen the factor “selfefficacy” as an important tool instead of perceived ease of use (PEOU) for examining
17
consumers behavior to innovative technological products (Ellen & Bearden, 1991, Tan & Teo, 2000).
2.8
Related studies
Numerous studies have applied factors from consumers' characteristics and innovation characteristics to assess consumer adoption of innovation, while some studies have applied these factors to assess consumers' resistance. Different researchers have applied Roger‟s (1983) model, to analyze the effect of innovation characteristics on consumers' adoption (He et al., 2006, Brown et al., 2003, Tan & Teo, 2000, Holak & Lehmann, 1990). The model proposed by Roger is used to examine the affect of five innovation characteristics (Relative advantage, Compatibility, Complexity, Trialability, and Observability) on innovation adoption, where most of the factors (relative advantage, compatibility, and complexity) are related to consumers‟ resistance. He et al. (2006) applied Roger‟s innovation characteristics to examine factors affecting consumers' adoption, and found that compatibility and relative advantage are positively and complexity is negatively related to consumers' adoption of Online E-payment. Im et al (2003) performed a study to identify and analyze consumers' characteristics and its affect on innovation adoption. He and Peter (2007) performed a study examining decision factors for the adoption of online payment system. These decision factors are derived from innovation characteristics, consumers' characteristics, and Technology Acceptance Model. While examining consumers’ characteristics and its effects on consumers' behavior toward technological innovation, several studies have used TAM with addition to other factors (Fang et al. 2005, Lu et al. 2003, Constantiou et al. 2006, Koivumaki et al. 2006, Han et al. 2006, Harkke 2006). Venkatraman (1991) analyzed the relationship between personal characteristics and innovation adoption behavior and found that, it depends on consumer innovativeness type (either sensory or cognitive) and product type. Yang (2005), Yui Chi et al. (2007), and Amin (2008) applied TAM model to examine the affect of consumers’ characteristics factors on their attitude towards mobile commerce, online banking, and mobile phone credit cards respectively. Wang et al. (2003) applied TAM model and “perceived credibility” factor, to examine consumers‟ characteristics and the subsequent affects on adoption of internet banking. Park and Chen (2007) applied TAM model with addition to “self-efficacy” to study its affect on the adoption of smartphone by medical doctors and nurses. Nysveen et al. (2005) applying TAM model investigated the moderating affects of gender in explaining intention to use mobile chat services. Roberts and Pick (2004) combines the TAM model and innovation characteristics, adding the factors of reliability, security, digital standards, cost, future web connectivity, and technology product suitability; to identify and analyze the most important factor affecting corporate adoption of mobile devices. Security risk has been found as critical factor affecting adoption and resistance behavior. The TAM model has been criticized by Pijpers et al. (2001) and Yang (2005), as most of the studies based on this model failed to provide understanding of how consumers' perceptions of innovative technologies are formed and how these perception can be modified to increase adoption/acceptance and overcome resistance.
18
The literature review reveals that most of the studies have been done concentrating on consumer adoption of innovation, but very less attention have been given to their affect on consumers’ resistance (Gatignon & Robertson, 1985, 1991; Ram, 1987). The adoption and diffusion theories do not examine the process of consumer resistance to innovations. Majority of the diffusion studies have only looked at successful innovations but consumers' resistance might be present even for successful innovations (Ram, 1989). It has been argued by Ram (1989) and Sheth (1981) that it is much effective to concentrate on understanding the factors affecting innovation resistance rather than innovation adoption (Sheth 1981, Ram 1989). In the innovation diffusion process, resistance usually takes place at a stage earlier to adoption (Ram 1987, Woodside & Biemans 2005), so the first importance has to be given to identifying and understanding consumers‟ resistance. Resistance has been called as the other side of the innovation phenomenon, and it is important to study to concentrate on both sides of the coin (Kuisma et al., 2007). In this study we have chosen relative advantage, as a substitute factor for “perceived usefulness” (PU) and complexity & self-efficacy as substitute factors for “perceived ease of use” (PEOU) in TAM. These factors have been empirically proved in the literature to have considerable effect on the two factor PU (perceived usefulness) and PEOU (perceived ease of use) of TAM (Park & Chen, 2007, Roberts & Pick, 2004) (Venkatesh & Davis, 2000). Moreover, following Ram (1989) and Yu and Lee (1994) model, the factors; compatibility, risk, expectation for better products, are chosen from consumerdependent category of innovation characteristics. „Motivation’ and ‘attitude towards existing products’ are the factors chosen from consumers characteristics affecting innovation resistance.
2.9
Factors Affecting Consumers’ Resistance
There are two kinds of factors that affect consumers‟ resistance, and are based on consumers‟ characteristics and innovation characteristics (Ram, 1987, Kim, 2005, Yu & Lee, 1994, Dunphy & Herbig, 1995, W. Robert, 1998). Innovation characteristics are related to the outcome and the affect of new products on consumers, which determine the amount of resistance generated (Ram, 1987) and has the power to predict consumer adoption and expected resistance. It has been found by some researchers that innovation characteristics provide greater explanation to consumers' behavior towards innovation (Agarwal & Prasad 1997). Innovation characteristics research describes the relationship between the attributes or characteristics of an innovation and the adoption or implementation of that innovation (Tornatzky & Klein, 1982). Consumers' characteristics are the psychological characteristics of consumers e.g. how they view the innovativeness with respect to that particular product (Dunphy & Herbig, 1995). Innovation resistance is dependent on the psychological characteristics of the consumer. The important factors that have been identified as relevant to consumer behavior in innovations context are: Personality, Attitudes, Value Orientation, Previous Innovative Experience, Perception, and Motivation (Ram, 1987).
19
2.9.1
Innovation Characteristics Factors
According to Ram (1987), Kelly, and Kranzberg (1978), innovation characteristics can be divided into two contexts, first is consumer-independent context and second is consumers-dependent. The factors of consumer-independent context can be expected to create the same type of resistance across all consumers (Ram, 1987), and is thus out of the scope of this study. On the other hand, the affects of Consumer-dependent factors vary across different consumers. Innovation characteristics (consumer-dependent) factors effect consumers‟ decision making to adopt a new product, these factors are; relative advantage, compatibility, risk, complexity, and expectations for better products (inhibitory effect on adoption of other innovations). Understanding these factors and their affect on consumers' resistance is crucial for increasing the chances of innovation success (Ram 1987, Yu & lee 1994). Following is the detailed discussion about each factor. 2.9.1.1
Relative Advantage
The relative advantage of an innovation is the “degree to which an innovation is perceived as being better/superior than the idea it supersedes” (Rogers & Shoemaker, 1971, p. 138). This definition has also been cited by (Tornatzky & Klein 1982; Holak & Lehmann 1990). Relative advantage can be presented in economic profitability, social benefits, time saved, hazards removed (Tornatzky & Klein, 1982), and also perceived usefulness (PU) (Roberts & Pick, 2004). Tornatzky and Klein (1982) found relative advantage to be an important factor in determining adoption of innovations, affecting consumers‟ resistance negatively. Agarwal and Prasad (1997) found relative advantage as the dominant factor that predicts consumers‟ intention to adopt or resist innovation. In general, perceived relative advantage of an innovation is positively related to its rate of adoption (Rogers 1983; Tan & Teo 2000), and negatively related to consumers' resistance (Dunphy & Herbig, 1995). Relative advantage, in addition to its direct and negative effect on consumers' resistance, has indirect impact on perceived risk. If considerable advantages are provided with a new product/service, the expected risk maybe decreased as consumers' ignore its deficiencies/flaws (Holak & Lehmann, 1990). Moreover, relative advantage is positively related to compatibility and negatively related to complexity (Holak & Lehmann, 1990) as compatible product can be utilized effectively and may increase its relative advantage, but relative advantage may decrease if the new product is complex and consumers are unable to utilize it effectively (W. Robert, 1998). 2.9.1.2
Compatibility
Compatibility is the degree to which prospective consumers believe that the new product fits with their socio-cultural norms or is consistent with existing values, past experiences, style, behavior patterns, and needs (Dunphy & Herbig, 1995, Holak & Lehmann, 1990). It has been regarded as an important component included in attitude development (Rogers, 1995, Saaksjarvi, 2003) and is of special importance in technological markets. A general cause expressed by different consumers for resisting or not adopting new product is "no need" (Zeithaml & Gilly, 1987), even though all technological innovations usually bring about a number of benefits/advantages for
20
consumers (Roger, 1995). Compatibility (or simply "congruence"), in prior research has been found as a crucial factor than can predict consumers' adoption and resistance behavior (Saaksjarvi, 2003). There are two aspects of innovation compatibility (Tornatzky & Klein, 1982): (1) it may refer to compatibility with the values or norms of the potential adopters or (2) may represent congruence with the existing practices of the adopters. The first is a kind of psychological or cognitive compatibility (e.g. compatibility with what people feel or think about a technology) while the second is a more practical/operational compatibility (e.g. compatibility with people practices). Culture and previous experience with products can determine (to some extent) consumers' sense of security with innovation (Holak & Lehmann, 1990). It has been argued by Tornatzky and Klein (1982) that, “no matter the compatibility is normative/cognitive or practical/operational; from theoretical perspective, the innovation compatibility to the potential adopter is positively related to adoption and implementation of the innovation”. This is also supported by Dunphy and Herbig (1995) and Tan and Teo (2000), who state that compatibility is positively related to the diffusion rate and negatively related to consumers' resistance. Compatibility may lead the innovation evaluative process due to its direct affect on purchase intention and other attributes (Holak & Lehmann, 1990). Research suggests that compatibility has a large and direct positive effect on purchase intentions; as if an innovation is perceived compatible, it is most probable that consumers will learn and get information about the innovation (Holak & Lehmann, 1990). On the other hand, the adoption rate is affected by the old/existing products, the more compatible the old/existing products are, the less consumers intentions to adopt new products (Dunphy & Herbig, 1995) and hence more consumers' resistance. Although the impact of compatibility on other factors has not been studied empirically (Saaksjarvi, 2003), but it is expected to positively affect relative advantage and negatively affect perceived risk (Holak & Lehmann, 1990). For example, if a new product is perceived as incompatible with consumers' work/life-style, it may not be possible to recognize all its advantages. Moreover, if a new product is perceived as compatible with past experience, principles, and life-style, they will be aware of the previous items and hence much competent to judge the innovation in terms of its dominance over existing/old products. The risk (especially psychosocial risks) associated with innovation decreases, if innovation are perceived as more compatible with one's work/life-style (Holak & Lehmann, 1990). 2.9.1.3
Complexity
Complexity can be defined as “the degree to which the innovation is perceived as relatively difficult to understand, use or comprehend” (Rogers & Shoemaker, 1971, p. 154). This definition has been followed by some other researchers (Holak & Lehmann, 1990; Dunphy & Herbig, 1995). Different researchers have found complexity as negatively related to the innovation diffusion and positively related to innovation resistance (Dunphy & Herbig, 1995, Tornatzky & Klein, 1982). Prior research has shown that; an innovative product with
21
considerable complexity demand more skills and efforts (to implement and use innovation) to increase its adoption and decrease the possibility of consumers' resistance (Cooper & Zmud 1990; Dickerson & Gentry 1983; Tan & Teo 2000). It is generally believed that innovative products that are less complex, are easily adopted by consumers (Holak & Lehmann, 1990). There exist a negative relationship between complexity and relative advantage, as if a product is perceived as complex, it will be difficult for consumers to try it and hence cannot be utilized for its advantages (Holak & Lehmann, 1990, W. Robert, 1998). Complexity as a factor of consumers' characteristics is expected to affect consumers' intention and lead towards adoption through relative advantage, risk, and also self-efficacy. It has been argued by Holak and Lehman (1990) that greater risk is associated with innovation which is perceived as more complex, so, there is a positive relationship between complexity and perceived risk. Complexity effect consumers' adoption indirectly through perceived risk (Holak & Lehmann, 1990). 2.9.1.4
Perceived Risk
Bauer (1960), Webster (1969), and Ostlund (1974) introduced risk as an additional dimension in the diffusion and adoption of innovation, which is then added by Sheth (1981) and Ram (1987) as another factor affecting consumers resistance. Here we are talking about the degree of perceived risk associated with adopting & using innovation. It is believed as positively related to consumers resistance and negatively related to adoption (Ram, 1989, Dunphy & Herbig, 1995). Newer technologies/products may be perceived by consumers as more risky. Research has shown that the perceived risk is a critical determinant of a consumer‟s willingness to adopt an innovation (Shimp & Bearden, 1982). As it is very difficult to capture risk as an objective reality (Dowling & Staelin, 1994), it is interpreted as the “consumer‟s subjective expectation of suffering a loss in pursuit of a desired outcome” (Yiu Chi et al., 2007, p.336). Consideration for the consequences of an action, including the perceived risk, are critical aspects that formulate attitude towards that action (Crisp, Jarvenpaa, & Todd, 1997), thus perceived risk may enhance consumers' resistance from adoption of an innovative product. Therefore perceived risk is believed to have positive relationship with consumers‟ resistance (Yiu Chi et al., 2007). Even in situations, where a consumer has evaluated and considered to adopt an innovation, perceived risk and uncertainty create substantial barriers to adoption (Aggarwal et al., 1998). Innovation always involves some degree of perceived risks because of uncertainty (Ram & Sheth, 1989), so innovation that associated with considerable perceived risk, has slower rate of diffusion (Dunphy & Herbig, 1995) and higher consumers‟ resistance (Ram, 1989). Usually, perceived risk is termed as an innovation characteristics, however Fain and Roberts (1997) argue that most of the time, risk is rather a perception of a consumer than merely a characteristic of an innovation. But looking at the dominant literature, we have included perceived risk in innovation characteristics. Researchers have identified six key dimensions of perceived risk, which are; financial, performance, physical, time, social, and psychological risks (e.g. Cherry & Fraedrich, 2002; Ram, 1989; Dholakia, 2001).
22
Following are the definitions of the perceived risk dimensions (Jacoby & Kaplan 1972; Hirunyawipada & Paswan 2006; Dholakia, 2001; Ram, 1989; Kuisma, Laukkanen & Hiltunen 2007). a) Financial risk captures the financially negative outcomes for consumers after they adopt new products. It is also called the fear of economic loss. b) Performance risk concerns with the belief that the new product / innovation will not perform as anticipated. It is also called the fear of performance uncertainty. c) Physical risk is the perception that products will be physically harmful to adopters. d) Time risk relates to the perception that the adoption and the use of the product will take too much time (see e.g. Roselius 1971). e) Social risk has to do with the negative responses from consumer‟s social network. Ram called it “the fear of social ostracism or ridicule”. f) Psychological risk is the fear of psychological discomfort. The nervousness arising from the anticipated post-purchase emotions such as frustration, disappointments, worry, and regret. From these six kinds of risk, financial, performance and also security risk (security of important personal information and the product itself) have been found as the most important types of risk related to smartphone adoption (Richardson, 2003; Roberts & Pick, 2004). 2.9.1.5
Expectation for better products
According to Ram‟s model of innovation resistance, „inhibitory effect on the adoption of other innovations‟ is one of factors that affect innovation resistance. In some cases, the adoption of one innovation products may have an inhibitory effect on the adoption of other innovations (Ram, 1987). If a person purchases an innovative product such as expensive high resolution digital cameras, the person is not likely to purchase another new digital camera with improved performance and more features within a short period of time. The person is postponing his/her purchases. He/she reasons, quite correctly, that if he/she waits, a better product with a lower price tag will soon be in the market (Ram & Sheth1989). Products based on new technologies are especially susceptible to this factor. For example, even in the corporate world, many companies decide to wait for a new generation of products with a better performance-to-price ratio before upgrading their computer systems (Ram & Sheth 1989). Lee and Yu (1994) and Kim (2005) used a term of „expectation for better products‟ rather than „inhibitory effect on the adoption of other innovations‟ as it is easy to understand and give a clear meaning. In this study, we will also use the term „expectation for better products‟. 2.9.2
Consumers Characteristics Factors
For this study we have chosen „Motivation‟ and „attitude towards existing products‟, as motivation is believed as the central key factor driving consumer behavior (Barczak et al., 1997), and “attitude towards existing product” is to examine the role of existing
23
products in driving consumers resistance. Moreover self-efficacy has been added, as it believed to play a major role in technological innovative products (Ellen et al. 1991, Compeau & Higgins 1995). One of purposes behind choosing these factors is because of their easy measurement procedure and intensive use by different researchers (Lee Matthew et al., 2007, Barczak et al., 1997, Wang et al., 2008, Wang et al., 2003). 2.9.2.1
Motivation
Motivation is defined as “goal-directed arousal” that drives consumers need (MacInnis & Moorman, 1991). It entails internal processes that provide behavior with power and direction. Power describe the strength, determination, and concentration of the concerned behavior, while direction provides a specific purpose to the behavior (Lee Matthew et al., 2007). Herzberg at el. (1959) theorized that behavior can be motivated extrinsically and intrinsically. Based on this, motivation is divided in two types, the extrinsic motivation and intrinsic motivation which are two kinds of drivers that evoke a specific outcome behavior. Perceived usefulness and perceived enjoyment are typical examples of extrinsic and intrinsic motivation respectively, in technology adoption context (Lee Matthew et al., 2007). Extrinsic motivation involved performing an activity for achieving other goals i.e. to gain other valued outcomes rather than the activity itself (Davis, Bagozzi, & Warshaw, 1992) e.g. a decision to use computer for writing a letter (Lee Matthew et al., 2007) where behavior is driven by its perceived value and expected benefits. Davis et al. (1992) argue that perceived usefulness (PU) and perceived ease of use (PEOU) are the two paradigm of extrinsic motivation, and found that if users perceive something (technology) to be useful and easy to use, it is more probable that they will use it. It has also been found by Devis et al. (1992) that consumers' perceived usefulness increases through increase in perceived ease of use. In Technology Acceptance Model (TAM) the two factors, PU and PEOU are widely applied in research studies on technology acceptance (Lee Matthew et al., 2007). Intrinsic motivation involves performing an action for its own sake, as the action is itself exciting, engaging, entertaining etc. It means the passion to do an activity for the reward which derives from the enjoyment of the activity itself e.g., expressing personality and status by using a product. Looking at the perspective of intrinsic motivation, behavior is provoked from the feelings of pleasure, joy, and fun (Lee Matthew et al., 2007). It has been empirically proved that both extrinsic (e.g., perceived usefulness and perceived ease of use) and intrinsic (e.g., perceived enjoyment) motivators are important to the formation of intention to use (adoption) (Lee Matthew et al., 2007). 2.9.2.2
Attitude towards existing products
This is a general factor, which examines consumers' attitude toward existing products and is influenced by tradition and the abilities of existing product in serving consumers needs and wants. The tradition value is associated with individual‟s favorable attitude towards the past and present, and shows individual‟s respect for culture, social norms, and traditions (Schwartz, 1992). The tradition value implies consumer‟s favorable
24
attitude toward the products that they are currently using. In such case, consumers will be unwilling to replace their old and still functional products with innovative products. In this era, products life cycle is becoming shorter and shorter and competition getting tougher, new products are coming in the market with much faster pace, and existing products/technologies often become outdated very quickly and prematurely. Due to which, plenty of opportunities are available to consumers to abandon their existing products, and switch to much advanced/improved new products. But, consumers with strong favorable attitude toward existing products will resist innovative products and will continue using their existing products until they fail to function (Wang et al., 2008). It has also been found by researchers that consumers who are not satisfied with the existing products are more likely to adopt change and go for new products, on the other hand, consumers who are satisfied with the existing products will keep up using the same (Karjaluoto et al., 2002). 2.9.2.3
Self-Efficacy
Compeau and Higgins (1995, p. 193) define self-efficacy as “an individual‟s perception of his or her ability to use a technological innovative product”. Self-efficacy is a determinant of perceived ease-of-use and the usability of an item (Davis 1996). It is also defined as, “an individual‟s self-confidence in his or her ability to perform a behavior” (Bandura 1977, 1982). Self-efficacy refers to the confidence in one‟s ability and competence to manage and perform the courses of action required to accomplish a desired outcome (Bandura 1997a, 1982), and initiates from different origins including performance achievement, previous experience, personal interests, etc. (Bandura, 1997b). It has been found by some researchers that self-efficacy has the power to foresee intentions to use a variety of technological innovation (Hill et al., 1986). A consumer with low self-efficacy will probably select a product which can be handled easily, even if there are better/advance products available. Ellen et al. (1991) empirically verified that self-efficacy is also a factor that affects resistance to technological innovations. Other researchers have also considered consumers' self efficacy as a very important factor to study resistance and diffusion of innovation (Tan & Teo, 2000). Self-efficacy is selected as one of the factors in this study as prior studies have revealed that self-efficacy shows a substantial affect of “consumers' perceptions of his ability to use the new technological product” on his decision for product adoption (Park & Chen, 2007). It has been argued that, without skill, performance is not achievable; without self-efficacy, performance may not be endeavored (Compeau & Higgins, 1995). Consumers' self-efficacy and their perception bring about a causal relationship between the adoption of technological innovation and consumers' cognitive factors. Across a wide range of behaviors, self-efficacy has been shown to influence the willingness to act as well as actual action initiation (Bagozzi & Kyu-Hyun, 1999).
2.10 Hypotheses formulation To identify the causal relationship among consumers' resistance to smartphones and the above discussed eight factors, we set up hypotheses based on the models of innovation resistance and previous research findings. Following the above discussed literature on
25
eight factors, a positivistic research paradigm was adopted and eight hypotheses have been constructed. 2.10.1 Relative Advantage In this thesis, we defined relative advantage of smart phones as advantage over nonsmart phones. Based on past research and empirical results (Dunphy & Herbig, 1995), relative advantage is hypothesized to have negative effect on consumers' resistance to smartphones. Hypothesis 1 The lower the Relative Advantage, the higher the consumers' resistance to Smartphones 2.10.2 Compatibility Based on the definition of compatibility in innovation perspective, smartphones compatibility is checked with consumers' needs and life/work style. Following the past research on compatibility (Saaksjarvi, 2003, Dunphy & Herbig, 1995, Agarwal & Prasad, 1997, Holak & Lehmann, 1990), we hypothesize compatibility to have negative effect on consumers' resistance to smartphones. Hypothesis 2 The lower the Compatibility, the higher the consumers' resistance to Smartphones 2.10.3 Complexity Most of the researchers have found complexity to have negative effect on consumers' adoption and positive effect on resistance (Dunphy & Herbig, 1995, Tan & Teo, 2000, Holak & Lehmann, 1990) so we hypothesize complexity to have positive effect on consumers' resistance to smartphone. Hypothesis 3 The higher the Complexity, the higher the consumers' resistance to Smartphones 2.10.4 Perceived Risk Three kinds of risk (financial, performance, and security risk) have been found as important in case of smartphone. Following the past research on perceived risk and consumers' behavior towards innovation (Yiu Chi et al., 2007, Dunphy & Herbig, 1995, Aggarwal et al., 1998), we hypothesize perceived risk to have positive effects on consumers' resistance to smartphones. Hypothesis 4 The higher the Perceived Risk, the higher the consumers' resistance to Smartphones 2.10.5 Expectation for better products Severe inhibitory effects of smartphones (effect of smartphones on the expected adoption of more advanced and better mobile phones in future) make consumers resist
26
its adoption and expect much better smartphones. It is measured by consumers' expectation for “more convenient & useful phones” and with “lower prices”. Based on some studies (Kim, 2005, Lee & Yu, 1994) we hypothesize „expectations‟ to have positive effect on consumers' resistance to smartphone. Hypothesis 5 The higher the Expectation for Better Smartphones, the higher the consumers' resistance 2.10.6 Motivation Motivation drives consumers' needs and intentions to adopt innovation. Following researcher arguments and empirical results (Lee Matthew et al., 2007, Davis et al., 1992), we hypothesize motivation to have negative effects on consumers' resistance to smartphones. Hypothesis 6 The lower the Motivation, the higher the consumers' resistance to Smartphones 2.10.7 Attitude towards existing products This factor is used to find consumers satisfaction from existing products and it plays an important role in driving consumers' behavior toward innovations. This factor has been found to have positive effect on consumers' resistance towards innovation (Wang et al., 2008, Karjaluoto et al., 2002), and therefore we hypothesize consumers' favorable attitude towards normal mobile phones to have positive effect on consumers' resistance to smartphones. Hypothesis 7 The more favorable/positive consumers' Attitude towards normal mobile phones, the higher the consumers' resistance to Smartphones 2.10.8 Self-Efficacy Confidence in one's ability to use/understand smartphones without any difficulty, may increase the chances of adoption, and will have negative effect on consumers' resistance. Different researchers have found self-efficacy to have negative effect on consumer resistance and positive effect on consumers' adoption of innovative products (Ellen & Bearden, 1991, Tan & Teo, 2000, Park & Chen, 2007), based on which we hypothesize consumers self-efficacy to have negative effect on resistance to smartphones. Hypothesis 8 The lower the Self-efficacy, the higher the consumers' resistance to Smartphones
27
2.11 Theoretical Model of Consumers Resistance to Smartphones Following our research problem, purpose, and the formulated hypotheses, we can construct a theoretical model to express the hypothesized relationship between consumers' resistance and factors of innovation & consumers characteristics. This model will be applied in our analysis of empirical data, collected through questionnaires. Accordingly, the factors; relative advantage, compatibility, motivation, and self-efficacy are hypothesized to have negative relationship (-ve effect) with consumers resistance to smartphones. This means that increase in these factors will decrease consumers' resistance to smartphones and vice versa. On the other hand, the factors; complexity, perceived risk, expectation for better products, and attitude towards existing products, are hypothesized to have positive relationship (+ve effect) with consumers' resistance to smartphones. This means that increase in these factor will increase consumers' resistance to smartphones and vice versa. These factors are also correlated with each other, which is represented by two way arrows linking them together. Empirical data will be analyzed on the basis of this model to; test the hypothesis, answer the of research questions and achieve the purpose of this study.
Fig. 2.5: Theoretical Model of Innovation Resistance to Smartphones
28
3
Method
In this chapter we have discussed different available methods and why certain methods are chosen as appropriate for performing this study. Moreover, we have discussed how this study has been conducted through the selected method. Method is a tool/technique for accomplishing the objective of the study in order to create new knowledge. As stated above, the purpose of this chapter is to make the reader understand why certain methodological approaches are chosen and how the study has been conducted.
3.1
Research Philosophy
The approach for conducting research depends upon the way researcher thinks about knowledge creation while accomplishing the objective of his study (Saunders, Lewis & Thornhill, 2003). In research philosophy, there are three dominant scientific approaches about the research processes on how knowledge can be created. These three views are positivism, interpretivism/hermeneutics and realism, where positivism and hermeneutics are termed as the opposite poles of each other (Saunders et. al., 2003, Widerberg, 2002). In the positivism philosophy, researcher and the interpretations are assumed as objective and value-free, and there is relatively high level of generalization. Positivism holds the notion of objectivity (Remenyi et al. 1998) and the author/researcher is independent of the research subject and is not affected nor has any effect on the subject but play a role of statistical analyzer. Where, the interpretation/discussion is made only on the basis of actual findings. In positivism, existing theories are used to develop and test hypothesis for further theory development, which may be tested in future research. For the purpose of facilitating replication, highly structured statistical analysis is done on the basis of quantifiable-observation/quantitative-data (Saunders et. al., 2003). In the hermeneutics/interpretivism view, there is a reduced level of generalization because of complex and often unique business circumstances, where researchers have deep interaction and often significant effect on interpretation and results (Saunder et al 2007). The interpretation and results are somehow affected (unintentional) even if the researcher(s) have strong desire to avoid. The objective of hermeneutics is to gain a good understanding of the subject reality, which is often a challenge because of changing business world. Researchers' close interaction and interpretation is crucial in understanding the subject in meaningful ways (Saunders et. al. 2003). The third research philosophy “realism” is another epistemological position related to scientific enquiry. In realism, the reality is assumed as the truth and exist independent of human thoughts and beliefs. Interpretation and behaviors are affected by social forces regardless of their awareness. Realism aims to understand the subjective reality concerning people in a broader social environment which has an effect on people‟s views and behaviors (Saunders et. al., 2003). The preference of philosophy is based on the choice of research question, and usually there is a mixture of the three philosophies. Widerberg (2002) argues that these three views are not fully independent in all aspects, but are mutually dependent and overlap each other. Hermeneutic approach uses assumption that the researcher has to participate
29
in the phenomenon that is studied, but it greatly influences the outcome of the study, and is a major disadvantage of hermeneutics approach. For this thesis, the philosophies considered to be most appropriate are positivism and to some extent realism. As positivism believes that an assumption is only correct when it corresponds to the reality, where existing theories are used to test hypothesis through statistical analysis in relation with empirical case (Saunders et. al., 2003, Lövblad, 2003), which is the purpose of this study. Secondly, realism approach assumes that existing theories are determined through testing against empirical data. In order to test the power of prediction and/or explanation it is believed as crucial to test them frequently, quantitative data should be used and theory testing is performed through statistical tools and exploring the relationships (Wiklund, 1998). In this study, the empirical data collected from different people in Sweden (through survey questionnaires), is based on their belief/opinions about our empirical case (Smartphones). Thus, it is aimed to understand people's subjective reality, i.e. “realism”, which, according the Saunder et al (2003) has effects on people views/behavior. After collecting empirical data (quantifiable), statistical analysis will be done to test the hypotheses which are constructed on the basis of existing theories. So another philosophy to be considered for this study is positivism.
3.2
Research Approach
It is important to get an awareness of the available approaches and their applicability within the field of study, which serve as a basis for research design. There are two types of research approaches, inductive and deductive, where researchers chose one and also two, called abductive approach (combination of inductive and deductive) (Sekaran, 2003). In inductive approach (the opposite of deductive) data (usually qualitative) is collected using interviews & observations, etc. to analyze and developed into theory, with the objective of gaining a deep understanding of a phenomenon (Saunders et al., 2003). Sekaran (2003) defined induction as a process where certain phenomenon is observed and conclusion are derived on the basis of those observations. This approach is lessstructured and more flexible but usually faced with the problem of difficulty in accessing data or insufficient preceding knowledge (Saunders et al., 2003). In deductive approach, theory is developed by hypothesis testing in an appropriate way. Same as positivist view, the researcher performs the study by distancing himself conducting an objective (statistical) analysis. The results are quantifiable and can be generalized to most extent (Saunders et. al., 2003). Sekaran (2003) defined deduction as a process of reaching towards conclusions by interpreting the results of the data analysis. Welman, Kruger and Mitchell (2005) state that deductive approach deals with finding causal relationships between variables and deriving conclusions from the empirical data, where hypotheses are developed and tested. Researchers have expressed deduction as a research approach where „laws and models‟ provide the basis of explanation (Hussey & Hussey, 1997). In abductive approach, the researcher utilizes both inductive and deductive approaches by moving back and forth in the theory and empirical findings. This approach looks for
30
common findings that most suitably explain and solve the issues about the collected data. This will make the facts in certain order, and will provide valuable tools to analyze and deal with the issues (Reichertz, 2004). The purpose of this study is to find the affect (causal relationship) of different factors on consumers' resistance, by developing and testing hypothesis on the basis of empirical data. The empirical data is collected via survey questionnaires, and two pre-tests are done to make the questionnaire fit for the required data collection. This made us to move back and forth in the theory and empirical findings (partial) to finalize the questionnaire. Based on this, the abductive approach is the most appropriate for accomplishing the desired objective. According to Saunder et al (2007) it is perfectly possible and often more advantageous to combine induction and deduction.
3.3
Research Method
There are two methods of conducting research, which are; qualitative and quantitative methods, where no method is considered to be better than another. Research questions should be taken in consideration before deciding for the most suitable method of conducting study (Ghauri & Gronhaug, 2005). Where why and how questions are generally followed by qualitative research and, what where and when questions are generally followed quantitative research (Maylor & Blackmon, 2005). Maylor and Blackmon (2005) state that, when a study involved statistical conclusion, quantitative research is conducted while the qualitative approach of research deals with processes, such as analyzing non-numeral information, which is out of the scope of this study. Moreover, quantitative approach is strongly linked with hypothesis testing (Saunders et al, 2003), keeping in view the purpose of this study, quantitative measurements (statistical analysis) have been done in order to be able to objectively interpret and analyze the data of a larger sample.
3.4
Research Strategy
The different choices of strategies available are; experiment, survey, case-study, action research, grounded theory, ethnography and archival research. Surveys allow for gathering large quantity of data from a sample of population in an economical and efficient way (Saunders et al, 2003). Considering the purpose of this thesis, it is not possible to use interview and or observation (qualitative method) instead we have chosen to use the survey through questionnaires which is argued as a useful tool for gathering information on a wide variety of topics (Thomas, 2004) using quantitative method. Survey is a popular & common strategy, used to answer „what‟, „who‟, & „how much/many‟ questions. This strategy is comparatively easy to understand and explain, as it collects quantitative data on which inferential or descriptive statistics is applied to derive meaningful results (Saunder et al. 2007).
3.5
Data Collection
There are two kinds of data collection sources, primary and secondary sources. Where primary data is referred to the information gathered firsthand by the researcher, specifically for achieving the study purpose. While secondary data refer to information obtained from already existing sources, and are collected for other purposes but can be
31
re-used for different purposes (Sekaran, 2003). So, most of the time it is not possible to achieve the research objective by only using secondary data, as it doesn‟t fully match the specific purpose of the study, and may draw a skewed picture (Saunder et al. 2003). The aim of this study is to find consumers' behavior based on a set of selected factors, for which it is important to collect primary data with addition to secondary data. Secondary data is collected from multiple sources, which mostly include journal articles, books, and web/online information. Primary data can be collected through interviews, observations, and questionnaire surveys (Sekaran, 2003; Zikmund, 2000). Considering the purpose of this study questionnaire survey is the most appropriate method of primary data collection, as there are large numbers of respondents targeted in a wide geographical area. Questionnaire survey is a very cost efficient, free from interviewer effect, and useful; easily accessing a wide range of sample in less time. For getting fast and many responses with low cost, web-based surveys are conducted. As, Williamson (2002) stated that web-based surveys are characterized by fast responses, low cost, the ability to target a very large sample, and data can be easily managed for statistical analysis through software. Surveys are conducted by inquiring selected respondents from a targeted population, to provide the required information.
3.6
Sampling
It might be rarely possible to collect data from every suitable member/case, which is called census, however due to certain limitations of time and cost; it is often impossible and impracticable to do so. Sampling is a process of choosing a sufficient number of elements/cases/individuals from the population, where population is the entire group of people, events, or elements of interest that researcher desires to investigate (Sekaran, 2003). Saunder et al. (2003) argue that it should not be assumed that census would necessarily give more useful and accurate output than data collection from a representative sample of the whole population. Sampling techniques provide a number of methods/techniques to select a subset of population that really represents the whole population to most extent (Saunder et al. 2003). There are two major kinds of sampling design, probability and non-probability sampling. Probability sampling utilizes some form of random selection, where all the elements/cases/individuals in the targeted population have the same probabilities of being chosen. Probability sampling is used when the representativeness of the population is of importance to make wider generalizability. Non-probability sampling does not involve random selection, which means that the population elements have no probability associated, to be selected as subject sample. The disadvantage of nonprobability sampling is that the results cannot be generalized confidently (Sekara, 2003). Whether to use probability or non-probability sample specifically depends upon researchers' concerns about three factors, which are time, cost/approach and generalizability. If researchers are more concerned about generalizability, it is recommended to use probability sampling, on the other hand, if researchers are more concerned about time and cost (and have limited approach) and less concerns for generalizability, non-probability sampling is recommended (Sekaran, 2003). For this study, our concern about time and cost (also our limited approach) outweigh the concerns for generalizability, and hence non-probability sampling is done. Moreover, the population of this study is very large, i.e. all young individuals in Sweden, so it is
32
impossible for us, to do probability sampling as we do not have access to the whole population. There are three common techniques of non-probability sampling; Convenience, Judgment, and Quota sampling. Where, convenience sampling is the widely used techniques, as it is a least time consuming and least expensive way, enabling the researcher to collect a large number of responses (Wrenn, Loudon & Stevens, 2001). The major disadvantage of convenience sampling is that, it is prone to bias, sampling error, and less generalizable (Saunder et al., 2007). The population of this study has been chosen as the potential young buyers of smartphones in Sweden, and keeping in view such a large population, “convenience sampling” has been selected as most appropriate method to get responses from a large size of population. Web-based/online questionnaires are designed, to get responses, as much as possible. With addition to web-based/online questionnaire, hard copy questionnaires are filled by conveniently accessible people in Jonkoping city. The link of online questionnaire has been sent via email to different people to access a large number of potential respondents (http://www.surveygizmo.com/s/126929/smartphone). Some community websites, Facebook, Tagged, Orkut, and Hi5 are also used to send questionnaires. The time frame of collecting responses was ten days, where most of the responses came in the first four days.
3.7
Data Analysis and Tools
SPSS, AMOS, and Smart-PLS, statistical software have been used to perform statistical analysis, and achieve the desired objectives of the study. First, a large questionnaire was designed and all related and frequently used (by different researchers) variables/questions (for measuring the selected factors) have been included (see table 4.1). Likert scale from 1 to 5 has been used to measure the constructed variables (where 5=strongly agree, 4=agree, 3=neutral, 2=disagree, 1=strongly disagree). The first pre-test has been done by filling & checking the questionnaire by twenty different students in Jonkoping International Business School, to improve the questions and replace any confusing & difficult terms. The purpose of first pretest was also to see, if we have overlooked some important dimensions/elements. After the first pre-test, a full version questionnaire has been finalized for collecting data to perform confirmatory factor analysis. A total of 160 responses have been collected for performing the CFA. Confirmatory factors analysis is done with the help of Amos 16.0 software, as a second pre-test to verify the conceptualization of the selected constructs/indicators for each factor. After performing CFA, unimportant and irrelevant questions have been excluded from the full version questionnaire to get a final version of questionnaire. The final version questionnaire was just a subset of full version questionnaire; that is why the first 160 responses have also been used in further analysis of the study. To examine the reliability of the empirical data, consistency analysis has been done on the basis of Cronbach‟s Alpha method. Keeping in view the objectives, this study implements structural equation modeling (sometimes called path analysis), which is used to find multiple relationships of
33
dependent & independent variables (Hair, Black, Babin, & Anderson 2006). The purpose of selecting an adequate sample size is to fulfill SEM‟s requirement for large sample (Hair et al 2006 p.735). Results are estimated (derived) through partial least square (PLS) approach, and also Amos, using a sample of 330 (160 from full version & 170 from final version questionnaire) respondents. The purpose of applying both approaches (Amos & PLS) is to confirm the results and hence provide it more credibility. Both of these approaches provided sufficient results that are used to fulfill the purpose of this study.
3.8
Statistical Methods
This study deal with the measurement of many factors (Eight factors of innovation characteristics & consumers' characteristics) through different variables/questions, therefore multivariate analysis has been done through structural equation modeling (SEM). Multivariate analyses are statistical techniques that simultaneously analyze multiple measurements on individuals/objects under study. Hair et al (2006) defined it as; “any simultaneous analysis of two or more variables can be termed as multivariate analysis” (p. 626). Structural equation modeling (SEM) is a statistical method that allows separate relationships for each dependent variable set, and provide very efficient estimation procedure for many and separate multiple regression equation that are estimated simultaneously. It is described into two components; structural model & measurement model, where structural model is a path model which relate/associate dependent with independent variables (Eight factors as independent & consumers' resistance as dependent variable in our case). The measurement model allows researcher to use several variables/indicators (questions) to measure a single independent and/or dependent variables (Hair et al 2006). 3.8.1
Factor analysis
There are two kinds of factor analysis available, exploratory and confirmatory factor analysis (Bhattacherjee, 2002). Exploratory factor analysis is data driven and is used to explore theoretical structure. In exploratory factor analysis, researchers usually select the number of factors after examining output from a principal components analysis (i.e., Eigen values are used to decide on a number of factors). EFA is often recommended when researchers have no hypotheses about the nature of the underlying factor structure of their measure (Kim & Mueller, 1978). Confirmatory factor analysis on the other hand, is theory driven and provides a fit of the hypothesized factor structure to the observed data. It is usually used by researchers to confirm the validity of factors and variables constructed/chosen to measure those factors (Bryant et aI., 1999). Confirmatory factor analysis has been chosen for performing factor analysis, as it best suits the objectives of this study. Confirmatory factor analysis (CFA) is a statistical tool/technique which is used to verify the factor structure of a set of observed variables/constructs. It is also used to tests whether a specified set of constructs is influencing responses in a predicted way (Brown, 2006). CFA will allow us to test that there exist a good relationship between observed variables and their underlying latent constructs. Knowledge from the literature, theories, and models has been used to postulate the relationship pattern of our
34
factors to be measured by the measuring variables (questions). CFA is used as a pre-test after collecting empirical data through pre-test questionnaires (full version), to test whether there is significant relationship between the factors to measure and the constructs (variables/questions) used for the measurement of those factors in questionnaires. It is simply used to evaluate the contribution of each question in measuring a particular factor, and also find how well the questions measure each factor (Hair et al 2006). Results from the confirmatory factor analysis have been used to drop out the constructs with less or no relationship with the factors. 3.8.2
Hypothesis testing
Following a structural equation modeling, the results are estimated with the help of partial least square (PLS) Smart-PLS and then AMOS 16.0 software to test the hypotheses. Looking at the value and signs of coefficients, T-values (t-statistics) has been considered, following the rule of thumb (t-value >2 = significant), to accept or reject the hypotheses. 3.8.2.1
Partial Least Square (PLS)
PLS is similar to using multiple regression analysis to find the relationships formulated in a model. It is used to predict the linear conditional expectation relationship between dependent and independent variables (Hahn et al., 2002). PLS is based on variance, is distribution free, prediction oriented approach, and has been extensively applied in marketing studies (Fornell & Cha 1994). It explicitly derives (estimates) the values/scores of the (unobserved) latent variables (consumers and innovation characteristics factors in our case) as weighted aggregates of their observed, manifest variables (the questions in our case) (Wold, 1980). PLS is a robust technique, as it provides solutions even when problems exist that may prevent a solution in using Amos or LISREL approaches of structural equation modeling. It is very easy to handle a large number of measured and or construct variables through PLS (Hair et al., 2006). One of the major advantages of PLS is that, it is very useful in generating estimates even with very small sample size. Software called SmartPLS is the most prevalent implementation as a path model. 3.8.2.2
AMOS
AMOS is a powerful and graphical, easy-to-use structural equation modeling (SEM) software. It creates much realistic models than if standard multivariate statistics or multiple regression models. It is used to estimate, assess, and then present a model in an intuitive path diagram to show hypothesized relationships among variables. It is very useful for testing the validity of different theories on the basis of empirical data, which is the prime objective of this study. AMOS is widely used for getting confirmative and interpretive results, which can be generalized more because of its requirement for a large number of observations (sample size). One of the disadvantages of AMOS is that, it is very sensitive to sample size, and may only provide good results if the sample size is very large. 3.8.2.3
Correlation
Correlation is a statistical tool, used to find the direction and strength of relationship between variables/factors. Correlation provided us the type & direction of inter-
35
relationship and intensity of relationship among our factors. The values for correlations are provided by both AMOS and SmartPLS. The values/results from both AMOS and SmartPLS are found as almost the same (i.e. with very least differences), so results from SmartPLS have been specifically followed and interpreted.
3.9
Trustworthiness of the Research
It is very important for all the researchers to develop a factor of trust on their research study & its results, so that the readers believe on what has been studied and how/what has been got in results. As this is a quantitative study, it is not difficult to retest the results drawn, by providing the inputs, following the appropriate approach. All the empirical data is saved in Excel (.xls) and SPSS (.sav) files, so it is easy to replicate/retest the results. Being the authors of this study, we believe that the trustworthiness of this study (being a quantitative one) is based on three factors; Validity and reliability of empirical data, Sources of empirical data (including sampling method), and the approach followed to derive results. 3.9.1
Validity & Reliability
As discussed in the previous chapter, many researchers have studied our hypothesized factors and consumers' resistance, where instruments have been developed and applied to measure these factors. To provide more validity & reliability to this study, we have modified the same instruments (variable/questions) to measure the selected factors and consumers' resistance. Although the instruments developed by different researchers (presented in table 4.1) to measure the hypothesized factors and consumers' resistance, has established good validity and reliability; but looking at the difference of perspective it is important to test the validity and reliability of the factors and the variable constructs for measuring these factors. Saunders et al. (2003) suggested that the pilot test of the questionnaire is very useful to establish the content and face validity. Creswell (1994 p. 121) defines content validity as, “it refers to whether items measure the content they were intended to measure", and face validity is defined as, “it refers to whether the items appear to measure what the instrument purports to measure". Reliability is to check the trustworthiness and unbiasedness of the empirical data, following consistency techniques. In another way, reliability is defined as, the extent to which a variable or a set of variables are consistent in what they are intended to measure. It differs from validity in that it relates not to what should be measured, but how it has been measured (Sekaran, 2003). Validity test has been done using confirmatory factor analysis, while reliability has been done using consistency analysis. Confirmatory factor analysis refined our tool (questionnaire) for empirical data collection, while consistency analysis provided us values that are believed as reliable/consistent and unbiased. The questionnaire we developed was aimed to measure different factors & consumers' resistance, where some of factors are somehow opposite to each other e.g. self-efficacy is somehow opposite to complexity and relative advantage is opposite to consumers' resistance. So, to measure all the factors in an efficient way, the questions for measuring different factors are arranged in a logical order. On this basis, we measured those factors together which are (more or less) same, e.g. questions about measuring; relative
36
advantage, compatibility, self-efficacy, and motivation are put first, followed by questions for measuring the rest of the factors. Consumers' resistance which proved a bit sensitive factor in our first pre-test has been measured in such ways that the respondents can provide their opinion where resistance can be measured indirectly. For measuring consumers' resistance indirectly, we followed Mirella et al., (2009) and Szmigin and Foxall (1998) studies about the concept of consumers' resistance. 3.9.2
Source of Empirical data
The sources of empirical data depend upon the population and sampling methods. As discussed above (in 3.6), for this study, the most appropriate method of sampling is found as „convenience sampling‟. Although convenience sampling is a widely used sampling method, but one of its major disadvantages is the possibilities of sampling error, and the results may not be generalized confidently to the population of the study. So, the results of this study cannot be confidently generalized to all the young potential buyers of smartphones in Sweden. To minimize the sampling error (to some extent), efforts are done (by making web-based questionnaires and utilizing community websites) to get many responses from a wide geographical area. Another purpose of making web-based questionnaire was also to deal with the problem of observer bias. The questionnaire (web-link) has been emailed to potential respondents, so, we do not know the situation when they have filled the questionnaire, either they filled it alone or were together with some friends that may have biased their answers. Most of the respondents were students, and hence we believe that all of them have good idea of how to fill questionnaire (provide answers) that is unbiased. 3.9.3
Approach followed to derive results
For choosing the right and most appropriate approach (tool) of statistical analysis for deriving results, all the available approaches are studied in detail and consulted with two statistics teachers in Jonkoping International Business School. Based on the nature of this study and the need for multivariate analysis, Structural Equation Modeling has been implemented. In Structural Equation Modeling, two approaches AMOS and PLS were available to derive results from the empirical data. Although the PLS approach (through SmartPLS software) has been found as the most suitable (discussed in 3.8) but we have also applied AMOS approach to verify the results. Almost same results have been derived from both approaches, which confirm the credibility of the derived results and the approach followed.
37
4
Empirical Findings
This chapter aims to present empirical findings, after performing preliminary analysis on empirical data. The purpose of preliminary analysis is to improve the questionnaire (full version) by excluding the irrelevant questions to make it fit for the required data collection. After collecting empirical data from both the full version & final version questionnaires, the descriptive findings are presented.
4.1
Preliminary Analysis
4.1.1
Confirmatory Factor Analysis
To evaluate the construct validity of the factors, factor analysis has been performed, following a theory driven approach. The basic purpose of CFA is to find out those variables/questions that measure different aspects of a same underlying factor and that have less correlation with other variables of the same factors. It is very helpful in choosing the right variable/questions for measuring an underlying factor. A large sample size has been recommended by different researchers (DeCoster, J. 1998) to perform CFA, where the minimum sample size required is 150 (Hair et al 2006, p.662). The following table shows the factor loadings derived from Amos 16.0 (Structural Equation Modeling software) for CFA.
Factor Analysis of Pilot Questionnaire Factors / Latent variables Relative Advantage
Q#
Variable (Observed)
References
Corresponding question
Factors Loading
Q1
More useful, reliable and convenient
Smartphones are more convenient, reliable, and useful than normal mobile phones.
0.86
Q2
More integrated Fashionable & trendy Good Price/Quality relationship
I.Brown et al, 2003; Taylor & Todd, 1995; Holak & lehmann, 1990 Yiu et al, 2007
Smartphone has good integration of wide range of functions and services. Smartphone are more fashionable, stylish, and trendy. The price/quality relationship is acceptable in smartphone, as I can enjoy other free services (e.g. e-mail, voice-mail, MSN & Skype, word processor) anywhere I want. Smartphones bigger screen and full keyboard, make different functions easier to use. Smartphones fit with my needs.
0.62
Smartphones fit with my lifestyle/ work-style.
0.92
Smartphones fits with my habits of using cell phones. Smartphone is a good complement to the traditional mobile phones. I know how to use smartphones.
0.82
Q3 Q4
Compatibility
Holak & Lehmann 1990; Yiu et al, 2007
Q5
Bigger screen and full keyboard
Jo, 2006
Q6
Compatible with needs
Q7
Compatible with lifestyle/workstyle Compatible with habits Complement
Holak & Lehmann, 1990; Yang, 2005 I.Brown et al, 2003; Taylor & Todd, 1995
Q8 Q9 Self-Efficacy
Yang, 2005
Q10
Usage know how
Moore & Benbasat, 1991 He, Fu, & Li, 2006 I.Brown et al., 2003; Compeau & Higgins, 1995
38
0.59 0.84
0.64 0.50
0.66 0.63
Motivation
Q11
Confidence
Q12
Comfort
Q13
Independence
Q14
Q17
Intrinsic motivation Extrinsic Motivation Extrinsic Motivation Intentions
Q18
Convenient
Compeau and Higgins, 1995; Taylor & Todd, 1995 Lee Matthew et al., 2007 Park and Chen, 2007 Lee Matthew et al., 2007 Park and Chen, 2007 Lee & Yu, 1994
Q19
Low price
Lee & Yu, 1994
Q20
Secure
Q21
Durability
Change & Chen, 2004 Change & Chen, 2004
Q22
Preference
Q23
Concept / tradition
Schwartz, 1992
Q24
Attitude towards & satisfaction from existing products Usage complexity
Karjaluoto et al., 2002 Wang et al., 2008
Q15 Q16
Expectation for better products
Attitude towards existing products
Complexity
Perceived Risk
Q25 Q26
Require more skills & mental effort
Q27
Complex to understand functions
Q28
Maintenance
Q29
Performance risk Performance risk
Q30
Q31
Financial risk
Q32
Security risk
Q33
Value/safety
Compeau and Higgins, 1995; I.Brown et al., 2003 Hung et al., 2003
I.Brown et al 2003 Lee, Cheung, Chen, 2007 I.Brown et al, 2003; Moore & Benbasat, 1991; He, Fu, & Li, 2006 Holak Lehmann, 1990 He, Fu, & Li, 2006 Holak & lehmann, 1990 Holak & lehmann, 1990 Holak & lehmann, 1990 I.Brown et al, 2003; Yang, 2005; Chang & Chen, 2004 Holak & lehmann,
39
I am confident of understanding and using smartphone.
0.88
I am comfortable with using technical and advanced consumers’ products (e.g. mp3 player, computer, digital camera, PDA,etc ). I would be able to operate smartphone, even if I have never used it before.
0.83
It is very exciting and entertaining to use smartphone. Using smartphone would be beneficial to my work I need smartphone for its new features/functions. I have intentions to use smartphone in the near future. I expect more convenient and advance smartphones I expect more affordable smartphones
0.80
0.67
0.45 0.86 0.90 0.58
I expect more secure smartphones.
0.55 0.85
I expect more durable smartphones.
0.87
I prefer compact and handy mobile phones. I do not like the idea of putting so many functions together in a cell phone. I am quite satisfied and have favorable attitude towards normal mobile phones.
0.34
Smartphones may be complex to use.
0.75
Understanding and using smartphones may require more skills and or mental effort.
0.34
It may be difficult to understand internet, gaming, mp3, and PDA functions in smartphone. It may be difficult to make updates & put new software in smartphones. Smartphone performance may not meet my expectations. I afraid of getting out of battery, while I need to use smartphone for a long time. I fear of losing much money if I lost my smartphone. I fear of losing my personal information and all the data, if I lost my smartphone.
0.85
It is risky to spend relatively more
0.87
0.72 0.91
0.32 0.23 0.82 0.87 0.86
Consumers' Resistance (Dependent variable/fac tor)
Q34
risk Durability risk
1990; Yang, 2005 Holak & lehmann, 1990; Chang & Chen, 2004
Q35
Postponement
Q36
Postponement
Q37
Postponement
Q38 Q39
Opposition/ Wastage of resources Opposition
Szmigin & Foxall, 1998; Mirella et al., 2009 Szmigin & Foxall, 1998 Szmigin & Foxall, 1998 Yang, 2005
Q40
Opposition
Q41
Opposition
Q42 Q43
Resistance to change Rejection
Q44
Rejection
Q45
Rejection
Szmigin & Foxall, 1998; Mirella et al., 2009 Szmigin & Foxall, 1998 Szmigin & Foxall, 1998; Mirella et al., 2009 Sheth, 1981 Szmigin & Foxall, 1998 Szmigin & Foxall, 1998; Mirella et al., 2009 Mirella et al., 2009
money for buying a smartphone. Smartphone can easily break if dropped etc., and may stop functioning. I will wait to buy smartphone till it proves beneficial for me.
0.49 0.20
I need to clarify some queries and justify the reasons to buy smartphone. I am waiting for the right time and required capability to buy smartphone. Buying smartphone maybe a wastage of money.
0.74
I fear of wasting my time using smartphones.
0.77
I need to get a solution for some of my complaints and objections before I buy smartphone. Smartphone may decrease my autonomy.
0.31
I fear of certain changes smartphone may impose on me. It is unlikely that I buy smartphone in the near future. Smartphone is not for me.
0.27
0.46 0.78
0.73
0.52 0.80
I don’t need smartphones.
0.81 Table 4.1: Full version questionnaire & Factor Analysis
Results from factor analysis have provided factor loadings for each variable (question) where factor loading above 0.70 is termed as acceptable so that each factor is explained more by its constructed variable (question) than by error (Hair et al 2006 p.695, Fornell & Larcker, 1981). Several variables (factor analysis table) have factor loading above than 0.70 and prove as best measure of the corresponding factor. Following this, variables/questions with factor loading above 0.70 are kept for final questionnaire. A visual/graphical representation of all factors and measurement variables/questions has been derived from Amos software and is provided in the Appendix. 4.1.2
Consistency (Reliability) Analysis
To find the reliability of the empirical data, consistency analysis has been done using SPSS. Consistency analysis is used to find the internal consistency of the observed data, and ranges from 0 to 1. Cronbach's Alpha (α) has been calculated to find the internal consistency of the data. The closer Cronbach's alpha coefficient values to 1, the greater the internal consistency of the variables. For deciding on the value of α, George and Mallery (2003) provide the following rules of thumb: “α > 0.9 – Excellent, α > 0.8 – Good, α > 0.7 – Acceptable, α > 0.6 – Questionable, α > 0.5 – Poor, and α < 0.5 – Unacceptable” (p. 231). Also, the value of alpha partially depends upon the number of items (variables/questions) in the scale, it should be noted that the more the number of variables/questions, the less will be the consistency.
40
Below is a table, presenting consistency of each factor, and also overall consistency of the data, where most of the factors are found with good consistency. Consistency Analysis using Cronbach’s Alpha Factors
Relative Advantage
Compatibility
SelfEfficacy
Motivation
Cronbach Aplha (α)
0.816
0.859
0.744
0.850
Overall consistency (α)
Expectations for better products 0.825
Attitude towards ex. products 0.736
Complexity
Risk
0.710
0.854
Resistance (Depende nt factor) 0.900
0.892
Table 4.2: Consistency Analysis 4.1.3
Variables Operationalization & Designing questionnaire
After performing the confirmatory factor analysis, we have been able to finalize our questionnaire based on the value of factor loading. In the below table we have provided all factors with their corresponding variable/question and the abbreviations (short words) used for representing these variables/questions in further analysis. Questionnaire Factors
Relative Advantage Compatibility Innovation Characteristics
Complexity
Expectations for better products Motivation Attitude towards existing products Self-Efficacy Innovation Resistance
Questions
RELADV1
Smartphones are more convenient, reliable, and useful than normal mobile phones. The price/quality relationship is acceptable in smartphone, as I can enjoy other free services (e.g. e-mail, voice-mail, MSN & Skype, word processor) anywhere I want. Smartphones fit with my lifestyle and work style.
RELADV2 COMP1 COMP2 CLEX1 CLEX2
Smartphones fit with my habits of using cell phones. Smartphones may be complex to use. It may be a bit difficult to understand internet, gaming, mp3, and PDA functions in smartphones. I afraid of getting out of battery, while I need to use smartphone for a long time. I fear of losing much money, my personal information and other important data, if I lost/broke my smartphone. It is risky to spend relatively more money for buying a smartphone. I expect more secure smartphones.
PRISK1
Perceived Risk
Consumers' Characteristics
Construct Variables
PRISK2 PRISK3 EXBPR1 EXBPR2
I expect more durable smartphones.
MOTIV1 MOTIV2 MOTIV3 ATEXPR1 ATEXPR2
SE1 SE2
It would be very exciting and entertaining to use smartphone. I need smartphone for its new features/functions. I have intentions to use smartphone in the near future. I do not like the idea of putting so many functions together in a cell phone. I am quite satisfied and have favorable attitude towards normal mobile phones.
I am confident of understanding and using smartphone. I am comfortable with using technical and advanced consumers‟ products (e.g. mp3 player, computer, digital camera, PDA, etc). I need to clarify some queries and justify the reason to buy smartphone. Buying smartphone maybe a wastage of money.
CR1 CR2
41
CR3 CR4 CR5 CR6
I fear of wasting my time using smartphones. I have some complaints / objections against smartphones. I don‟t need smartphone Smartphone is not for me.
Table 4.3: Questionnaire
4.2
Descriptive Findings
The following table summarizes the descriptive findings from the collected empirical data on the basis of full version and final version (160+170=330) 330 samples/observations. Descriptive Statistics Factors
N
Mean
Std. Deviation
RELADV
330
3.511
0.899
COMP
330
3.330
0.987
SE
330
3.983
0.740
MOTIV
330
3.541
0.862
EXPBPR
330
3.868
0.791
ATEXPR
330
3.118
0.912
CLEX
330
3.047
0.887
PRISK
330
3.515
0.856
CR
330
2.995
0.729
Table 4.4: Descriptive statistics The descriptive analysis of the empirical data in the above table shows that most of the respondents have very good self-efficacy of smartphones, which means that they are confident of their ability/skill to use smartphones. Following this, they expect better smartphones, most certainly because of the risk they perceive from smartphones which has also a high value of 3.5. Most respondents have almost the same amount of motivation and perceived relative advantage of smartphones. Slight resistance with low value of standard deviation, has been found which can be called as consumers' neutral response about resistance. This neutral resistance, according to Ellen et al (1991) is consumers' less than enthusiastic response towards innovation, and is the most common form of consumers' resistance.
42
5
Analysis
In this chapter, we have performed statistical analysis on empirical data. Two approaches (PLS & AMOS) of Structural Equation Modeling have been used to get results. Based on these analyses, the constructed hypotheses are tested, and research questions are answered.
5.1
Testing Hypotheses
After getting empirical data from the questionnaires (full version & final version questionnaires), two different approaches (SmartPLS and AMOS) have been used to estimate results for hypothesis testing and answer other research questions. Results with very slight differences have been got from both approaches. The purpose of utilizing both approaches is to confirm the accuracy of the result, and thus provide it more credibility. 5.1.1
Partial Least Square
The following diagram shows the output results from SmartPLS. The values/scores with the paths (arrows) from independent variables (consumers' and innovation characteristics factors) to dependent variable (consumers' resistance) show the regression coefficients. The regression coefficient is interpreted as the rate of change in dependent variable (consumer resistance) as a function of change in independent variables (factors).
Fig. 5.1: Empirical Model of Consumer' Resistance to Smartphones showing regression coefficients and factor loadings derived from SmartPLS.
43
The below figure shows the T-values derived from bootstrapping (with 700 value of sample for 330 cases/observations). Following the rule of thumb (George & Mallery, 2003), t-values below than two (t-value2) is considered as significant, and are used for making decisions on the constructed hypotheses.
45
Factors
Hypothesis
Beta
T-Values
Significance
Relative Advantage Compatibility Complexity Perceived Risk Expectation for Better Products Motivation Attitude towards existing products Self-Efficacy
H1 H2 H3 H4 H5
-0.171 -0.088 +0.191 +0.165 +0.042
3.064 1.422 5.046 3.487 1.292
Significant
H6 H7
-0.303 +0.129
4.812 3.086
Significant
H8
+0.023
0.718
Non-significant
Non-significant Significant Significant Non-significant
Significant
Table 5.1: Results from SmartPLS The above table and figures (fig. 5.1, 5.2, & 5.3) from SmartPLS and AMOS show that all of the hypotheses, except H2 i.e. Compatibility, H5 i.e. Expectations for better products, and H8 i.e. Self-Efficacy are supported. The support for H1 i.e. Relative advantage is expected since past literature has consistently shown that relative advantage has a significant and negative effects on consumers resistance (Ram 1987, Ram & Sheth 1989, Lee & Yu, 1994) (Dunphy & Herbig, 1995). In other words respondents, who feel that Smartphones are relatively more advantageous than normal mobile phone, have expressed less resistance. This negative correlation between consumers' resistance and relative advantage has also been confirmed by technology acceptance model with factor of perceived usefulness (PU) (Park and Chen, 2007, Amin, 2008), where PU is termed synonymously as relative advantage (Roberts and Pick, 2004). Similarly, the support for H3 i.e. Complexity, and H4 i.e. Perceived Risk are in line with previous findings (Ram, 1987, Dunphy & Herbig, 1995, Yiu Chi et al., 2007, Laukkanen et al., 2007) that have shown that complexity and perceived risk has positive effects i.e. increase consumers resistance. So, respondents who feel that smartphones are more complex and risky have shown more resistance. Support for H6 i.e. Motivation with high beta value has shown motivation factor as the most critical one in affecting consumers resistance negatively. As stated by MacInnis and Moorman (1991), motivation is a “goal directed arousal” which drives consumers needs. Respondents who have shown strong motivation to adopt smartphones have expressed no or less resistance to it. In this regard, extrinsic motivation (MOTIV2) has been found as important variable in measuring motivation towards adopting smartphones. Expectedly, consumers' favorable attitude towards normal mobile phones has been found as positively correlated with their expression of resistance to smartphones. Which show that respondents, who favor tradition, are unwilling to replace their old but still functional mobile phones. Same relationship between consumers' favorable attitude and their resistance to innovations, has been found in previous studies (Wang et al., 2008, Karjaluoto et al., 2002). The empirical data collected for this study, do not confirm H2 i.e. Compatibility, H5 i.e. Expectation for better products, and H8 i.e. Self-efficacy. The relationship between
46
compatibility and resistance has been found as negative which is in line with previous findings (Dunphy & Herbig, 1995, Tan & Teo, 2000, Saaksjarvi, 2003, Holak & Lehmann, 1990), but is not significant to support our hypothesis. This shows that respondents who express resistance do not really think that smartphones is not compatible. On the other hand, respondents who expressed no or less resistance do not really think that smartphones are much compatible. Similarly, the factor “expectations for better products” has been found as positively related with consumers' resistance which is also in line with previous findings (Lee & Yu, 1994; Ram, 1987). The significance of this relationship (according to the empirical data collected for this study) is very less to be accepted as significant. From our empirical data we can elaborate on that; no matter respondents resist smartphones or not, most of them have sufficient expectations for better smartphones. The relation between self efficacy and consumers' resistance has been found as very less and also non-significant, which is different from previous findings that respondents with more self-efficacy express less resistance to innovation. In this case, self-efficacy has been found as un-important. The name “smartphone” communicates and gives enough confidence to the respondents about its usage friendliness, so in turn, most of the respondents feel that they have sufficient self efficacy to use smartphones, no matter they resist it or not. Referring to the first research question, the below table mention (i) the causal relationships between resistance and innovation characteristics factors, (ii) the causal relationships between resistance and consumers' characteristics factors.
Innovation Characteristics Consumers' Characteristics
Factors
Causal relationship with consumer resistance.
Score (Beta)
Relative Advantage Complexity Perceived Risk Motivation Attitude towards existing products
Negative Positive Positive Negative Positive
-0.171 +0.191 +0.165 -0.303 +0.129
Table 5.2: Causal relationship between hypothesized factors and resistance to smartphones Following the above table, we can state that there is a negative causal relationship between consumers' resistance to smartphones and relative advantage of smartphones as innovation characteristics factor. There is positive causal relationship between consumers' resistance to smartphones and perceived risk, and also a positive causal relationship between resistance to smartphones and complexity. So, increase in perceived risk and complexity will increase consumers' resistance to smartphones. On consumers' characteristics side, there is a negative causal relationship between motivation and resistance to smartphones, while a positive causal relationship between favorable attitude towards normal mobile phones and resistance to smartphones. Hence, increase in motivation will decrease consumers' resistance to smartphone, and, increase
47
in favorable attitude towards normal mobile phones will increase consumers' resistance to smartphones. The hypothesized factors in the model of consumers' resistance represented almost 65% (Coefficient of determination i.e. R2=0.649, see fig. 5.1) variation in consumers' resistance that is caused by these factors. In other words, 65% variation in consumers' resistance is explained (caused) by innovation and consumers' characteristics factors, which indicates an acceptable goodness of fit of the model (McKelvey & Zavoina, 1975). The goodness of fit of a model indicates how well it fits a set of observations/empirical data. 5.1.4
Regression Equation CR= α + β1+β2+β3+β4+β5+ β6+ β7+ β8 + γ Where, CR = Consumers' Resistance α = Intercept β1 = Relative advantage β2 = Compatibility β3 = Complexity β4 = Perceived Risk
β5 = Expectation for better products β6 = Motivation β7 = Attitude towards existing products β8 = Self-efficacy
and γ can be other factors affecting consumers' resistance. CR = α–0.171β1–0.088β2+0.191β3+0.165β4+0.042β5–0.303β6+0.129β7+ 0.023β8 + γ The value with positive/negative signs are the coefficient from PLS, which e.g. can be interpreted as, when “motivation” goes up by 1, CR goes down by 0.303 etc. Referring the second research question motivation, complexity, relative advantage, and perceived risk are found as the important factors (as per their order) that affect/determine consumers' resistance to smartphones.
5.2
Factors Inter-relationship (Correlation)
To find the inter-relationship between the hypothesized factors, correlation has been derived from SmartPLS. The following table shows the correlation of all the factors, representing the direction and strength of inter-relationship between these factors.
48
ATEXPR
ATEXPR CLEX COMP EXBPR MOTIV PRISK RELADV SE
1 0.510 -0.503 -0.151 -0.532 0.388 -0.543 -0.195
CLEX
COMP
EXBPR
1 -0.414 -0.141 -0.408 0.455 -0.445 -0.197
1 0.337 0.727 -0.531 0.713 0.210
1 0.284 -0.064 0.210 0.252
MOTIV
1 -0.454 0.731 0.278
PRISK
1 -0.501 -0.073
RELADV
1 0.142
SE
1
Table 5.3: Factors correlations The correlations between the hypothesized factors have been found similar to the previous findings (Holak & Lehmann, 1990; W. Robert, 1998). Motivation has been found as positively correlated with relative advantage, selfefficacy, compatibility, and expectations for better products, while negatively correlated with complexity, risk, and attitude towards existing products. Respondents who are more motivated to adopt smartphones perceived it as relatively more advantageous, compatible, and have good self-efficacy, while they perceive smartphones as less risky, less complex, and have unfavorable attitude towards normal mobile phones. Complexity is found as negatively correlated with compatibility, relative advantage, self-efficacy, and expectation for better products. On the other hand, it is found as positively correlated with perceived risk and attitude towards existing products. Respondents who think smartphones are more complex, have less compatibility, relative advantage, and self efficacy, while more perceived risk and favorable attitude towards existing products (i.e. normal mobile phones). Relative advantage is found as positively correlated with compatibility, self-efficacy, and expectation for better products, while negatively correlated with risk and attitude towards existing products. Respondents who perceive smartphones as relatively more advantageous express more self-efficacy and compatibility, while perceiving smartphone as less risky and have less or unfavorable attitude towards normal mobile phones. Perceived risk is found as negatively correlated with compatibility, and self-efficacy, while positively correlated with attitude towards existing products. Respondents who perceived smartphones as more risky, have express less compatibility and self-efficacy, and have more favorable attitude towards existing products.
49
6
Conclusion
This chapter aims to conclude the analysis and findings, to specifically answer the research questions and fulfill the objective of the study. The hypothesized factors in the model of consumers' resistance represented almost 65% (0.649, see fig. 5.1) variation in consumers' resistance that is caused by these factors. In other words, 65% variation in consumers' resistance is explained (caused) by innovation and consumers' characteristics factors, which indicates an acceptable goodness of fit of the model. Based on the research questions and purpose of the study, here we will conclude the results of our analysis: a.
(i) What are the causal relationships among innovation characteristic factors and consumers' resistance to smartphones?
The empirical data supported all the hypotheses related to innovation characteristics, except H2, i.e. Compatibility, and H5, i.e. expectation for better products. So our empirical data could not confirm that; “the lower the perceived compatibility of smartphones, the higher the consumers' resistance”, and “the higher the expectation for better smartphones, the higher the consumers' resistance”. Hypotheses H1, H3, and H4, are supported by the empirical data, which is in line with the previous findings from different studies (Dunphy & Herbig, 1995; Park & Chen, 2007; Laukkanen et al., 2007, etc). Based on the hypotheses results, we can conclude that, the lower the perceived relative advantage of Smart phones, the higher will be the resistance. So, relative advantage and consumers' resistance are found to have negative relationship, where consumers' resistance is the dependent factor, i.e. „increase‟ in relative advantage causes consumers' resistance to „decrease‟, and vice versa. Supporting H3 and H4, it can be concluded that, the higher the levels of perceived risk and complexity of Smart phones, the higher will be the resistance. So, perceived risk and complexity have negative relationship with consumers' resistance, where consumers' resistance is the dependent factor, i.e. „increase‟ in perceived risk and complexity causes consumers' resistance to „increase‟, and vice versa. (ii) What are the causal relationships among consumers' characteristic factors and consumers' resistance to smartphones? In consumers' characteristics factors, our empirical data supported all the hypotheses except H8, i.e. Self-efficacy. So the empirical data could not confirm that “the lower the consumers' self-efficacy of smartphones, the higher the consumers' resistance”. Hypotheses H6 and H7, are supported by the empirical data. One of basis of the results/decision for H6, we can conclude that, the lower the consumers' motivation to buy/adopt smartphones, the higher the consumers' resistance. So motivation and consumers' resistance are found to have negative relationship, where consumers' resistance is the dependent factor, i.e. „increase‟ in motivation causes consumers' resistance to „decrease‟, and vice versa. Supporting H7, we conclude that; the more favorable/positive consumers' attitude towards normal mobile phones, the higher the
50
consumers' resistance. So „attitude towards normal mobile phones‟ and „consumers' resistance‟ are found to have positive relationship, where consumers' resistance is the dependent variable, i.e. „increase‟ in consumers' favorable attitude towards normal mobile phones causes consumers' resistance to „increase‟, and vice versa. b. Which factors of consumers' and innovation characteristics mainly affect/determine consumers' resistance to Smart phones? Motivation, complexity, relative advantage, and perceived risk are found as the most critical factors (intensive as per their order) which affect/determine consumer resistance to smartphones. Where motivation has -0.303, complexity has +0.191, relative advantage has -0.171, and perceived risk has +0.165 value of regression coefficient (Beta), which can be interpreted as; when “motivation” goes up by 1, “consumers' resistance” goes down by 0.303, when “complexity” goes up by 1, “consumers' resistance” also goes up by 0.191 etc. c. What is the inter-relationship among the innovation & consumers characteristics factors? Compatibility, Relative Advantage, and Motivation are found as strongly & positively correlated factors. Secondly, perceived risk, complexity, and attitude towards existing products are found as strongly & positively correlated (See table 5.4). However, the correlation between the two groups “compatibility, relative advantage, motivation” and “perceived risk, complexity, attitude towards existing products” has been found as negative.
6.1
Suggestions for further research
Throughout this study, we found that innovation resistance has been called as very important in the innovation literature, but relatively less research has been done in this area. So, it would be valuable to do further research on innovation resistance from individual and or organizational perspective. Also, it would be interesting to investigate, how innovative companies are dealing with innovation and consumers' characteristics factors, to overcome/decrease consumers' resistance. Further research can be done, to analyze the model of consumers' resistance for other innovative products and also services. Also, the model of consumers' resistance to Smartphones can be extended and applied on empirical data, collected from other geographical areas. As discussed in the sampling, we have used convenience sampling method in this study where results cannot be generalized confidently. If accessible, probability sampling method can be used in further study, so that results can be confidently generalized to the study population. AMOS and SmartPLS approaches used in this study are very useful for finding relationships (between different variables/factors) formulated in a model. These approaches can be used in further studies, to find the cause/affect relationships between different variables in a model.
51
7
References
Agarwal, R., & Prasad, J. (1997). The Role of Innovation Characteristics and Perceived Voluntariness in the Acceptance of Information Technologies. Decision Sciences (28:3), 557-582. Aggarwal, P., Cha, T. & Wilemon, D. (1998). Barriers to the adoption of really-new products and the role of surrogate buyers. The Journal of Consumer Marketing, 15, 358-371. Alex Slawsby, Randy Giusto, Kevin Burden, Ross Sealfon, & Dave Linsalata, (2003). Worldwide smart handheld devices forecast and analysis. IDC 2003–2007 (June 2003) Amin, H. (2008). Factors affecting the intentions of customers in Malaysia to use mobile phone credit cards. Management Research News, 31, 493-503. Assink, M. (2006) Inhibitors of disruptive innovation capability: a conceptual model. European Journal of Innovation Management, 9, 215-233. Arnould, E., Price, L., & Zinkhan, G. (2004). Consumers (2nd edition). New York: McGrawHill/ Irwin. Bagozzi, R. P., & Kyu-Hyun, L. (1999). Consumer Resistance to, and Acceptance of, Innovations. Advances in Consumer Research, 26, 218-226. Balachandra, R., & John H. Friar (1997). Factors for Success in R&D Projects and New Product Innovation: A Contextual Framework. IEEE Transactions on Engineering Management, 44 (August), 276‐287. Bandura, A. (1977). Self-Efficacy: Toward a Unifying Theory of Behavioral Change. Psychological Review (84), 191-215. Bandura, A. (1982). Self-Efficacy Mechanism in Human Agency. American Psychologist (37:2), 122-147. Bauer, R. A. (1960). Consumer Behavior as Risk Taking in Dynamic Marketing in a Changing World, R. S. Hancock, R.S., Chicago: American Marketing Association, 389-398. Barczak, G., Ellen Pam, S. & Pilling Bruce, K. (1997). Developing typologies of consumer motives for use of technologically based banking services. Journal of Business Research, 38, 131-139. Bhattacherjee, A. (2002). Individual trust in online firms: Scale development and initial test. Journal of Management Information Systems, 19 (I), 211-241. Bhimani, A. (1996). Securing the Commercial Internet. Communications of the ACM (39:6), 29-35. Blackler, F., & Colin, B. (1985). Evaluation and the Impact of Information Technologies on People in Organizations. Human Relalions 38 (3): 213-231. Brod, Craig. (1982). Managing Techno-stress: Optimizing the Use of Computer Technology. Personnel Journal 61 (October): 753-757. Brown, I., Cajee, Z., Davies, D. & Stroebel, S. (2003) Cell phone banking: Predictors of adoption in South Africa - An exploratory study. International Journal of Information Management, 23, 381-394. Brown, T. A. (2006). Confirmatory Factor Analysis for Applied Research. New York: Guilford Press. Castells, M., Fernandez-Ardevol, M., Qiu, J.L. and Sey, A. (2006). Mobile Communication and Society: A Global Perspective, The MIT Press, Cambridge, MA.
52
Chang, Y. F. & Chen, C. S. (2005). Smart phone-the choice of client platform for mobile commerce. Computer Standards and Interfaces, 27, 329-336. Cherry, J. & Fraedrich, J. (2002). Perceived risk, moral philosophy and marketing ethics: mediating influences on sales managers‟ ethical decision-making. Journal of Business Research, Vol. 55 No. 12, 951-62. Cho Seong, D. & Chang Dae, R. (2008). Salesperson's innovation resistance and job satisfaction in intra-organizational diffusion of sales force automation technologies: The case of South Korea. Industrial Marketing Management, 37, 841-841. CNET Reviews (2009). CNET Smartphone reviews. Retrieved on 10 March 2009 from http://reviews.cnet.com/smartphone-reviews/ Cooper, R. B., & Zmud, R. W. (1990). Information Technology Implementation Research: A Technological Diffusion Approach. Management Science (36:2), 123-139. Connor, O. & Colarelli, G. (1998). Market learning and radical innovation: A cross case comparison of eight radical innovation projects. The Journal of Product Innovation Management, 15, 151-166. Constantiou, I., Damsgaard, J. & Knutsen, L. (2006). Exploring perceptions and use of mobile services: user differences in an advancing market. International Journal of Mobile Communications, Vol. 4 No. 3. Compeau, D. & Higgins, C.A. (1995). Computer self-efficacy: development of a measure and initial test. MIS Quarterly, June, 189-211. Crawford, M.C. (1983). New Products Management, Irwin, Homewood, IL. Creswell, J. W. (1994). Research design: Qualitative and quantitative approaches. London: Sage Publications. Crisp, C. B., Jarvenpaa, S. L., & Todd, P. A. (1997). Individual Differences and Internet Shopping Attitudes and Intentions, http://ccwf.cc.utexas.edu/_crisp/Indiv_Shop.htmS. Dahlin, K. & Behrens, D.M. (2005). When is an invention really radical? Defining and measuring technological radicalness. Research Policy, Vol. 34 No. 5, 717-37. Davis, F.D., Bagozzi, R.P., & Warshaw, P.R. (1992). Extrinsic and intrinsic motivation to use computers in the workplace. Journal of Applied Social Psychology, 22(14), 1111–1132. Davis, F.D. (1989). Perceived usefulness, perceived ease of use, and user acceptance of information technology. MIS Quarterly, Vol. 13 No. 3. DeCoster, J. (1998). Overview of Factor Analysis. Retrieved from http://www.stat-help.com/notes.html Dickerson, M. D., & Gentry, J. W. (1983). Characteristics of Adopters and NonAdopters of Home Computers. Journal of Consumer Research (10), 225-234. Dholakia, U.M. (2001). A motivational process model of product involvement and consumer risk perception. European Journal of Marketing, Vol. 35 Nos 11/12, 1340-60. Dowling, G. R., & Staelin, R. (1994). A model of perceived risk and intended risk handling activity. Journal of Consumer Research, 21(1), 119–134. Dowling, Grahame R. (1986). Perceived Risk: The Concept and Its Measurement. Psychology & Marketing, 3,193-210. Dunphy, S. & Herbig, P. A. (1995). Acceptance of innovations: The customer is the key! The Journal of High Technology Management Research, 6, 193-209.
53
Ellen, P. S. & Bearden, W. O. (1991). Resistance to technological innovations: An examination of. Journal of the Academy of Marketing Science, 19, 297-308. Fain, D. & Roberts, M.L. (1997). Technology vs. consumer behavior: the battle for the financial services customer. Journal of Direct Marketing, Vol. 11 No. 1, 44-54. Fang, X., Chan, S., Brzeinski, J. & Xu, S. (2005). Moderating effects of task type on wireless technology acceptance. Journal of Management Information Systems, Vol. 22 No. 3, 123-57. Fornell, C., & Larcker, D. F. (1981). Evaluating structural equation models with unobservable variables and measurement error. Journal of Marketing Research, 18(1), 39-50. Fornell C, Cha J. (1994). Partial least squares. In: Bagozzi RP, editor. Advanced Methods of Marketing Research. Oxford, England: Blackwell Business, 52–78. Garcia, R., Bardhi, F. & Friedrich, C. (2007). Overcoming Consumer Resistance to Innovation. MIT Sloan Management Review, 48, 82-82. Garcia, R. & Calantone, R. (2002). A critical look at technological innovation typology and innovativeness terminology: A literature review. The Journal of Product Innovation Management, 19, 110-132. Gartner (2009). Press Release: Gartner Says Worldwide Smartphone Sales Reached Its Lowest Growth Rate With 3.7 Per Cent Increase in Fourth Quarter of 2008. Retrieved from: http://www.gartner.com/it/page.jsp?id=910112 on 13 March 2009. Gatignon, H. & Robertson, T.S. (1985). A propositional inventory for new diffusion research. Journal of Consumer Research, Vol. 11, 849-67. Gatignon, H. & Robertson, T.S. (1989). Technology diffusion: an empirical test of competitive effects. Journal of Marketing, Vol. 53, 35-49. Gatignon, H. & Robertson, T.S. (1991). Innovative decision processes in Robertson, T.S. & Kassarjian, H.H. (Eds), Handbook of Consumer Behavior, Prentice-Hall, Englewood Cliffs, NJ, 316-48. Gefen, D., Karahanna, E., & Straub, D. W. (2004). Trust and TAM in online shopping: An integrated model. MIS Quarterly, 27(1), 51-90. George, D., & Mallery, P. (2003). SPSS for Windows step by step: A simple guide and reference. 11.0 update (4th ed.). Boston: Allyn & Bacon Ghauri, P.N., & Gronhaug, K. (2005). Research Methods for Business Studies: A Practical Guide. Financial Times Prentice Hall. Gold, Bela. (1981). Technological Diffusion in Industry: Research Needs and Shortcomings. The Journal of Industrial Economics 29 (3): 247-269. Goldsmith, R.E., Hofacker, C.F., (1991). Measuring consumer innovativeness. Journal of the Academy of Marketing Science 19 (3), 209–221. Grabner-Kräuter, S. & Faullant, R. (2008). Consumer acceptance of internet banking: the influence of internet trust. International journal of bank marketing, 26, 483504. Hahn, C., Johnson, M. D. & Herrmann, A. (2002). Capturing customer heterogeneity using a finite mixture pls approach. Schmalenbach Business Review (SBR), 54, 243-270. Hair, J.F., Black C.K., Babin B.J., & Anderson R.E., (2006). Multivariate Data Analysis: A Global Perspective (7th Edition), Pearson Education Inc. Newyork. Han, S., Mustonen, P., Seppanen, M. & Kallio, M. (2006). Physicians' acceptance of mobile communication technology: an exploratory study. International Journal of Mobile Communications, Vol. 4 No. 2.
54
Harkke, V. (2006). Impacts of physicians‟ usage of a mobile information system. International Journal of Electronic Healthcare, Vol. 2 No. 4, 345-61. He, F. & Peter, M. (2007). Decision factors for the adoption of an online Payment system by customers. International Journal of E-Business Research. He, Q., Duan, Y., Fu, Z. & Li, D. (2006). An Innovation Adoption Study of Online EPayment in Chinese Companies. Journal of Electronic Commerce in Organizations, 4, 48-69. Heiskanen, E., Hyvönen, K., Niva, M., Pantzar, M., Timonen, P. & Varjonen, J. (2007). User involvement in radical innovation: are consumers conservative? European Journal of Innovation Management, 10, 489-509. Herzberg, F., Mausner, B., & Snyderman, B. (1959). The motivation to work. New York: Wiley. Hill, T., Smith, N. D., & Mann, M. F. (1986). Communicating Innovations: Convincing Computer Phobics to Adopt Innovative Technologies. Advances in Consumer Research (13), 419-422. Hirschman, E.C., (1980). Innovativeness, novelty seeking and consumer creativity. Journal of Consumer Research 7 (3), 283–295. Hirunyawipada, T. & Paswan, A. K. (2006). Consumer innovativeness and perceived risk: implications for high technology product adoption. Journal of Consumer Marketing, 23, 182-199. Holak, S. & Lehmann, D. (1990). Purchase Intentions and the Dimensions of Innovation: An Exploratory Model. Product Innovation Management. Hsu, C. L., & Lu, H. P. (2004). Why do people play online games? An extended TAM with social influences and flow experience. Information & Management, 41(3), 853-868. Hurter, A. P., & Rubenstein, A. H. (1977). Market penetration by new innovations, technological literature. Technological Forecasting and Social Change, 197221. Hussey, J. & Hussey, R. (1997). Business research : a practical guide for undergraduate and postgraduate students. Basingstoke : Macmillan Business Im, S., Bayus, B.L. & Mason, C.H. (2003). An empirical study of innate consumer innovativeness, personal characteristics and new product adoption behavior. Journal of the Academy of Marketing Science, Vol. 31 No. 1, 61-73. Jacoby, J. & Kaplan, L.B. (1972). The components of perceived risk. in Venkatesan, M. (Ed.), Proceedings of the 3rd Annual Conference, Iowa City, 382-93. John T. Gourville (2006). Eager Sellers and Stony Buyers: Understanding the Psychology of New-Product Adoption. Harvard Business Review, Vol. 84, Issue 6. Karjaluoto, H., Mattila, M. & Pento, T. (2002). Factors underlying attitude formation towards online banking in Finland. The International Journal of Bank Marketing, 20, 261-272. Kelly, P. & Melvin, K. (1978). Technological Innovation: A Critical Review of Current Knowledge. San Francisco: San Francisco Press Inc. Kim, J.-O., & Mueller, C.W. (1978). Factor analysis: Statistical methods and practical issues. Newbury Park: Sage. Kim, Kyunngchul. (2005). A Study on Barriers in Activating Mobile Commerce: Innovation Resistance Perspective. Hannam University, Korea.
55
Koivumaki, T., Ristola, A. & Kesti, M. (2006). Predicting consumer acceptance in mobile services: empirical evidence from an experimental end user environment. International Journal of Mobile Communications, Vol. 4 No. 4. Kuisma, T., Laukkanen, T. & Hiltunen, M. (2007). Mapping the reasons for resistance to Internet banking: A means-end approach. International Journal of Information Management, 27, 75-75. Lapointe, L., Lamothe, L. & Fortin, J. (2002). The dynamics of IT adoption in a major change process in healthcare delivery. System Sciences, 2002. HICSS. Proceedings of the 35th Annual Hawaii International Conference on, 19181926. Lassar, W. M., Manolis, C. & Lassar, S. S. (2005). The relationship between consumer innovativeness, personal characteristics, and online banking adoption. The International Journal of Bank Marketing, 23, 176-199. Laukkanen, T., Sinkkonen, S., Kivijärvi, M. & Laukkanen, P. (2007). Innovation resistance among mature consumers. The Journal of Consumer Marketing, 24, 419-419. Laukkanen, P., Sinkkonen, S. & Laukkanen, T. (2008). Consumer resistance to internet banking: postponers, opponents and rejectors. International journal of bank marketing, 26, 440-455. Lee, & Yu. (1994). A Study on the Innovation Resistance of Consumers in Adoption Process of New Product - Concentrated on Innovation Resistance Model. Korean Management Review, Vol.23 (3): 217-249 Lee Matthew, K. O., Cheung Christy, M. K. & Chen, Z. (2007). Understanding user acceptance of multimedia messaging services: An empirical study. Journal of the American Society for Information Science and Technology, 58, 2066-2066. Leonard, J.K. (2004). Critical success factors relation to healthcare‟s adoption of new technology: A guide to increasing the likelihood of increasing adoption. Electronic healthcare vol.2 No. 4. 72-81. Lövblad, H. (2003). Monk, Knight or Artist? The Archivist as a Straddler of a Paradigm. Archival Science, vol 3, p. 131. Luarn, P., & Lin, H. H. (2005). Toward an understanding of the behavioral intention to use mobile banking. Computers in Human Behavior, 21(6), 873-891. Lunsford Dale, A. & Burnett Melissa, S. (1992). Marketing product innovations to the elderly: understanding the barriers to adoption. The Journal of Consumer Marketing, 9, 53-53. Macinnis, D. J. & Moorman, C. (1991). Enhancing and measuring consumers' motivation, opportunity, and ability to process brand. Journal of Marketing, 55, 32-54. Mahajan, V., Miller, E. & Wind, Y. (2000). Introduction. in Mahajan, V., Miller, E. and Wind, Y. (Eds), New Product Diffusion Models, Springer, New York, NY, p. ix. Martin, R. (2007). Innovation, Upheaval Rule Red Hot Smartphone Market. InformationWeek, 32-33. Mirella, K., Nick, L. & Wetzels, M. (2009). An exploration of consumer resistance to innovation and its antecedents. Journal of Economic Psychology. Maylor H., & Blackmon, K. (2005). Researching Business and Management. Palgrave Macmillan. McKelvey R.D., Zavoina W. (1975). A statistical model for the analysis of ordinal level dependent variables. The Journal of mathematical sociology vol:4 nr:1 p.103
56
Midgley, D.F., Dowling, G.R. (1978). Innovativeness: the concept and its measurement. Journal of Consumer Research 4 (4), 229–242. Midgley, F. David & Grahame R. Dowling, (1993). A Longitudinal Study of Product Form Innovation: The Interaction Between Predispositions and Social Messages. Journal of Consumer Research 19 (March): 611-625. Mike Elgan (2007). It‟s time we stopped talking about “smartphones”, available at http://www.techworld.com/mobility/features/index.cfm?featureid=3204 (accessed at 15 April 2009) Mohr, Jakki. (2001). Marketing of High-Technology Products and Innovations. (1st edition) Prentice Hall. Monk, A., Hassenzahl, M., Blythe, M. & Reed, D. (2002). Funology: designing enjoyment. Proceedings of Conference on Extended Abstracts on Human Factors in Computer Systems, Minneapolis, Minnesota, 924-5. Murdock, Gene W. & Lori Frunz. (1983). Habit and Perceived Risk as Factors in the Resistance to Use of ATMs. Journal of Retail Banking 5 (2): 20-29. Nanda, P., Bos, J., Kramer, K.-L., Hay, C. & Ignacz, J. (2008). Effect of smartphone aesthetic design on users‟ emotional reaction: An empirical study. The TQM Journal. Nguyen, V., Hao, S. & Szajman, J. (2008). WiiKey: An Innovative Smartphone Based Wi-Fi Application. International Multi-symposiums on Computer and Computational Sciences, 91-97. Nysveen, H., Pedersen, P. E., & Thorbjørnsen, H. (2005). Explaining intention to use mobile chat services: Moderating effects of gender. Journal of Consumer Marketing, 22, 5, 247–256. O'Connor, E., Charles, P., Robert, L., & David H. (1990). Implementing New Technology: Managemcnt Issues and Opportunities. The Journal of High Technology Management Research I (I): 68- 89. Ostlund, L. E. (1974). Perceived Innovation Attributes as Predictors of Innovativeness. Journal of Consumer Research (1), 23-29. Park, C. & Banwari, M. (1985). A Theory of Involvement in Consumer Behavior: Problems and Issues. Research in Consumer Behavior, Vol. 1, Sheth, J.N. ed. Greenwich, CT: JAI Press, Inc., 201-31. Park, Y. & Chen, J. V. (2007). Acceptance and adoption of the innovative use of smartphone. Industrial Management & Data Systems, 107, 1349-1365. Pijpers, G.G.M., Bemelmans, T.M.A., Heemstra, F.J., & van Montfort, K.A.G.M. (2001). Senior executives use of information technology. Information and Software Technology 43, 959–971 Ram, S. (1987). A model of innovation resistance. Advances in Consumer Research. 14, 208-213. Ram, S. (1989). Successful innovation using strategies to reduce consumer resistanceAn empirical test. The Journal of Product Innovation Management, 6, 20-34. Ram, S. & Sheth, N.J. (1989). Consumer resistance to innovation: The marketing problem and its solution. The Journal of Consumer Marketing. 6(2). 5-14 Reichertz, Jo (2004). A Companion to Qualitative Research. London, England. Saga Publications Ltd Remenyi, D., Williams, B., Money, A. & Swartz, E. (1998). Doing Research in Business and Management: An Introduction to Process and Method. London: Sage
57
Richardson, R. (2003). CSI/FBI computer crime and security survey. Computer Security Institute. Available from: http://www.gocsi.com/forms/fbi/pdf.jhtml. Roberts, G. K. & Pick, J. B. (2004). Technology factors in corporate adoption of mobile cell phones: a case study analysis. System Sciences, 2004. Proceedings of the 37th Annual Hawaii International Conference on, 287-296. Rogers, E.M. (1995). Diffusion of Innovations, 4th ed., The Free Press, New York, NY. Rogers, E.M. & Shoemaker, F.F. (1971). Communication of Innovation: A cross cultural approach. New York: The Free Press. Roselius, T. (1971). Consumer rankings of risk reduction methods. Journal of Marketing, Vol. 35 No. 1, 56-61. Saaksjarvi, M. (2003). Consumer adoption of technological innovations. European Journal of Innovation Management. Salerno. Lynn M. (1985). What Happened to the Computer Revolution? Harvard Business Review (November,December): 129- 138. Saunders, M., Lewis, P., & Thornhill, A. (2003). Research Methods for Business Students (3rd ed.). Prentice Hall. Schein, E.H. (1985). Organizational Culture and Leadership. Jossey-Bass, San Francisco, CA. Schwartz, S.H. & Sagiv, L. (1995). Identifying culture-specifics in the content and structure of values. Journal of Cross-Cultural Psychology, Vol. 26, January, 92116. Sekaran, U. (2003). Research Method for Business: A skill building approach, 4th Edition. John Wiley & Sons, Inc. Shimp, T.A. & Bearden, W.O. (1982). Warranty and other extrinsic cue effects on consumers‟ risk perceptions. Journal of Consumer Research, Vol. 9, June, 3846. Szmigin, I. & Foxall, G. (1998). Three forms of innovation resistance: The case of retail payment methods. Technovation, 18, 459-468. Tan, M. & Teo, T. (2000). Factors Influencing the Adoption of Internet Banking. Journal of the Association for Information Systems. Tornatzky, L. & Klein, K. (1982). Innovation Characteristics and Innovation Adoption Implementation: A Meta-Analysis of Findings. IEEE Transactions on engineering management. Tushman, M.L. & Anderson, P. (1986). Technological discontinuities and organizational environments. Administrative Science Quarterly, Vol. 31, 439-65. Venkatesh, V., Davis, F.D. (2000). A theoretical extension of the technology acceptance model: Four longitudinal field studies. Management Science 46 (2), 186–204. Venkatraman, Meera P. (1991). The Impact of Innovativeness and Innovation Type on Adoption. Journal of Retailing 67 (1): 51-67. Wang, G., Dou, W. & Zhou, N. (2008). Consumption attitudes and adoption of new consumer products: a contingency approach. European Journal of Marketing, 42, 238-254. Wang, Y.-S., Wang, Y.-M., Lin, H.-H. & Tang Tzung, I. (2003). Determinants of user acceptance of Internet banking: an empirical study. International Journal of Service Industry Management, 14, 501-519. Webster, F. E., Jr. (1969) New Product Adoption in Industrial Markets: A Framework for Analysis, Journal of Marketing (33:3), 35-39. Welman, J., C., Kreuger, S., J. & Mitchell, B., C. (2005). Research Methodology (3rd ed.). Cape Town: Oxford University Press Southern Africa.
58
Widerberg, K. (2002). Kvalitativ Forskning i Praktiken. Lund: Studentlitteratur. Wiklund, J. (1998). Small Firm Growth and Performance: Entrepreneurship and Beyond, JIBS Dissertation Series No. 003, Ark Tryckaren, Jönköping Williamson, K. (2002). Research Methods for Students, Academics and Professionals. 2nd edition. Centre for Information Studies: Wagga Wagga. Woodside, A.G. & Biemans, W.G. (2005). Modeling innovation, manufacturing, diffusion, and adoption/rejection processes. Journal of Business & Industrial Marketing, Vol. 20 No. 7, 380-93. Wold H. (1980). Model construction and evaluation when theoretical knowledge is scarce: Theory and application of partial least squares. In: Kmenta J, Ramsey JB, editors. Evaluation of Econometric Models. New York: Academic Press, 47– 73. Wrenn, B., Loudon, D. & Stevens, R. (2001). Marketing Research Text and Cases, 1st edition, Routledge. W. Robert, J. (1998). Key factors affecting customer evaluation of discontinuous new products. The Journal of Product Innovation Management, 15, 136-150. Yang, K. C. C. (2005). Exploring factors affecting the adoption of mobile commerce in Singapore. Telematics and Informatics, 22, 257-277. Yiu Chi, S., Grant, K. & Edgar, D. (2007). Factors affecting the adoption of Internet Banking in Hong Kong-implications for the banking sector. International Journal of Information Management, 27, 336-336. Yuan, Li. (2006). Smartphones Aim at New Markets. The Wall Street Journal, November 2, B5. Yuan, M.J. (2005) Emergence of the Smartphone. Retrieved November 10, 2006, from http://www.oreillynet.com/pub/a/wireless/2005/08/23/whatissmartphone.html? page=1. Zaltman, G. & Duncan, R. (1977). Strategies for Planned Change. Wiley, New York, NY. Zeithaml, VA & Gilly, M.C. (1987) Characteristics affecting the acceptance of retailing technologies: a comparison of elderly and non-elderly consumers. Journal of Retailing, Vol. 63 No.1, 49-68. Zelos Group, (2004). Defining the Market for Full-Feature Handsets, (January) Zelos Group. Zikmund, W.G. (2000) Business Research Methods. Orlando: The Dryden Press.
59
8 8.1
Appendix Pre-test Questionnaire
On Page = 67
8.2 Graphical Representation of factors and measuring variables 8.2.1
Relative Advantage
8.2.2
Compatibility
60
8.2.3
Complexity
8.2.4
Perceived Risk
61
8.2.5
Expectation for better Products
8.2.6
Motivation
62
8.2.7
Attitude towards Existing Products
8.2.8
Self-Efficacy
63
8.2.9
Consumer Resistance
64
8.3
Factor Loadings from the final empirical data ATEXPR
CLEX
COMP
CR
EXBPR
MOTIV
PRISK
RELADV
SE
ATEXPR1
0.845
0.432
-0.395
0.48
-0.124
-0.433
0.28
-0.427 -0.249
ATEXPR2
0.863
0.44
-0.463
0.508
-0.133
-0.474
0.38
-0.499 -0.089
CLEX1
0.486
0.856
-0.394
0.459
-0.182
-0.388
0.42
-0.39 -0.191
CLEX2
0.408
0.886
-0.332
0.512
-0.07
-0.328
0.376
-0.387 -0.154
COMP1
-0.438
-0.363
0.920
-0.59
0.311
0.682
-0.492
0.652
0.173
COMP2
-0.488
-0.4
0.921
-0.594
0.311
0.656
-0.486
0.661
0.214
CR1
0.393
0.363
-0.402
0.675
0.102
-0.437
0.523
-0.466 -0.061
CR2
0.471
0.479
-0.538
0.781
-0.21
-0.563
0.455
-0.534 -0.149
CR3
0.395
0.388
-0.36
0.700
-0.098
-0.411
0.395
-0.448 -0.146
CR4
0.347
0.412
-0.394
0.668
-0.03
-0.423
0.443
-0.442 -0.046
CR5
0.477
0.397
-0.552
0.779
-0.191
-0.604
0.33
-0.559 -0.116
CR6
0.477
0.443
-0.576
0.833
-0.227
-0.617
0.414
-0.568 -0.209
EXPBPR1
-0.154
-0.154
0.328
-0.169
0.939
0.281
-0.057
0.204
0.223
EXPBPR2
-0.099
-0.077
0.254
-0.098
0.807
0.205
-0.056
0.157
0.228
MOTIV1
-0.467
-0.336
0.565
-0.567
0.229
0.801
-0.378
0.631
0.297
MOTIV2
-0.405
-0.306
0.647
-0.547
0.16
0.835
-0.382
0.605
0.17
MOTIV3
-0.468
-0.385
0.626
-0.637
0.317
0.888
-0.388
0.614
0.233
PRISK1
0.275
0.329
-0.349
0.454
-0.027
-0.311
0.799
-0.382
0.035
PRISK2
0.307
0.365
-0.462
0.402
-0.033
-0.373
0.815
-0.389 -0.081
PRISK3
0.37
0.423
-0.497
0.533
-0.089
-0.432
0.857
-0.46 -0.126
RELADV1
-0.449
-0.412
0.667
-0.645
0.222
0.687
-0.485
0.911
0.133
RELADV2
-0.533
-0.388
0.614
-0.579
0.153
0.626
-0.413
0.888
0.121
SE1
-0.189
-0.176
0.217
-0.169
0.245
0.268
-0.084
0.139
0.919
SE2
-0.127
-0.153
0.115
-0.099
0.164
0.182
-0.025
0.089
0.739
8.4
Appendix 2: Final Questionnaire
65
Dear respondent, this questionnaire is aimed to get your personal opinion about smartphones, and will only be used in analysis of our master thesis. Your real opinions are very important for us. This questionnaire can also be filled online, following the link: http://www.surveygizmo.com/s/126929/smartphone Thank you very much. Smartphone is a device that provides cell phone, E-Mail/Internet, PDA (personal digital assistant) functionality with full keyboard and relatively big screen. Strongly Disagree
Disagree
Neutral
Agree
Strongly Agree
Smartphones are more convenient, reliable, and useful than normal mobile phones. The price/quality relationship is acceptable in smartphone, as I can enjoy other free services (e.g. e-mail, voice-mail, MSN & Skype, word processor) anywhere I want. Smartphones fit with my lifestyle and work style.
1
2
3
4
5
1
2
3
4
5
1
2
3
4
5
Smartphones fit with my habits of using cell phones.
1
2
3
4
5
I am confident of understanding and using smartphone.
1
2
3
4
5
I am comfortable with using technical and advanced consumers‟ products (e.g. mp3 player, computer, digital camera, PDA, etc). It would be very exciting and entertaining to use smartphone.
1
2
3
4
5
1
2
3
4
5
I need smartphone for its new features/functions.
1
2
3
4
5
I have intentions to use smartphone in the near future.
1
2
3
4
5
I expect more secure smartphones.
1
2
3
4
5
I expect more durable smartphones.
1
2
3
4
5
I do not like the idea of putting so many functions together in a cell phone.
1
2
3
4
5
I am quite satisfied and have favorable attitude towards normal mobile phones. Smartphones may be complex to use.
1
2
3
4
5
1
2
3
4
5
It may be a bit difficult to understand internet, gaming, mp3, and PDA functions in smartphones. I afraid of getting out of battery, while I need to use smartphone for a long time. I fear of losing much money, my personal information and other important data, if I lost/broke my smartphone.
1
2
3
4
5
1
2
3
4
5
1
2
3
4
5
It is risky to spend relatively more money for buying a smartphone.
1
2
3
4
5
I need to clarify some queries and justify the reason to buy smartphone.
1
2
3
4
5
Buying smartphone maybe a wastage of money.
1
2
3
4
5
I fear of wasting my time using smartphones.
1
2
3
4
5
I have some complaints / objections against smartphones.
1
2
3
4
5
I don‟t need smartphone
1
2
3
4
5
Smartphone is not for me.
1
2
3
4
5
Questions
Thank you.
66
Dear respondent, this questionnaire is aimed to get your personal opinion about smartphones, and will only be used in analysis of our master thesis. Your real opinions are very important for us. This questionnaire can also be filled online, following the link: http://www.surveygizmo.com/s/126929/smartphone Thank you very much. Smartphone is a device that provides cell phone, E-Mail/Internet, PDA (personal digital assistant) functionality with full keyboard and relatively big screen. Strongly Disagree
Disagree
Neutral
Agree
Strongly Agree
Smartphones are more convenient, reliable, and useful than normal mobile phones. Smartphone has good integration of wide range of functions and services.
1
2
3
4
5
1
2
3
4
5
Smartphone are more fashionable, stylish, and trendy.
1
2
3
4
5
The price/quality relationship is acceptable in smartphone, as I can enjoy other free services (e.g. e-mail, voice-mail, MSN & Skype, word processor) anywhere I want.
1
2
3
4
5
Smartphones bigger screen and full keyboard make different functions easier to use.
1
2
3
4
5
Smartphones fit with my needs.
1
2
3
4
5
Smartphones fit with my lifestyle and work style.
1
2
3
4
5
Smartphones fit with my habits of using cell phones.
1
2
3
4
5
Smartphone is a good complement to the traditional mobile phones.
1
2
3
4
5
I know how to use smartphones.
1
2
3
4
5
I am confident of understanding and using smartphone.
1
2
3
4
5
I am comfortable with using technical and advanced consumers‟ products (e.g. mp3 player, computer, digital camera, PDA, etc). I would be able to use smartphone, even if I have never used it before.
1
2
3
4
5
1
2
3
4
5
It would be very exciting and entertaining to use smartphone.
1
2
3
4
5
Using smartphone would be beneficial to my work
1
2
3
4
5
I need smartphone for its new features/functions.
1
2
3
4
5
I have intentions to use smartphone in the near future.
1
2
3
4
5
I expect more convenient and advance smartphones
1
2
3
4
5
I expect more affordable smartphones
1
2
3
4
5
I expect more secure smartphones.
1
2
3
4
5
I expect more durable smartphones.
1
2
3
4
5
Questions
Page Turn Over
67
Strongly Disagree
Disagree
Neutral
Agree
Strongly Agree
1
2
3
4
5
I do not like the idea of putting so many functions together in a cell phone.
1
2
3
4
5
I am quite satisfied and have favorable attitude towards normal mobile phones. Smartphones may be complex to use.
1
2
3
4
5
1
2
3
4
5
Understanding and using smartphones may require more skills and or mental effort. It may be a bit difficult to understand internet, gaming, mp3, and PDA functions in smartphones. It may be difficult to make updates & put new software in smartphones.
1
2
3
4
5
1
2
3
4
5
1
2
3
4
5
Smartphone performance may not meet my expectations.
1
2
3
4
5
I afraid of getting out of battery, while I need to use smartphone for a long time. I fear of losing much money if I lost/broke my smartphone.
1
2
3
4
5
1
2
3
4
5
I fear of losing my personal information and other important data, if I lost my smartphone.
1
2
3
4
5
It is risky to spend relatively more money for buying a smartphone.
1
2
3
4
5
Smartphone can easily break if dropped etc., and may stop functioning.
1
2
3
4
5
I will wait to buy smartphone till it proves beneficial for me.
1
2
3
4
5
I need to clarify some queries and justify the reason to buy smartphone. I am waiting for the right time and required capability to buy smartphone. Buying smartphone maybe a wastage of money.
1
2
3
4
5
1
2
3
4
5
1
2
3
4
5
I fear of wasting my time using smartphones.
1
2
3
4
5
Smartphone may decrease my autonomy.
1
2
3
4
5
I need to get a solution for some of my complaints / objections before I buy smartphone. I fear of certain changes smartphone may impose on me.
1
2
3
4
5
1
2
3
4
5
It is unlikely that I buy smartphone in the near future.
1
2
3
4
5
I don‟t need smartphone
1
2
3
4
5
Smartphone is not for me.
1
2
3
4
5
Questions
I prefer compact and handy mobile phones.
Thank you. 68