Fault Tolerance of Relative Navigation Sensing in Docking Approach of Spacecraft . Dimitry Gorinevsky Mitek Analytics LLC, Palo Alto, CA 94306 and EE Department, Stanford University
[email protected],
[email protected] Gabriel M. Hoffmann, Mitek Analytics LLC and AA Department, Stanford University Marina Shmakova, Mitek Analytics LLC and Physics Department, Stanford University Robert W. Mah, NASA Ames Research Center Scott Cryan, NASA Johnson Space Center Jennifer D. Mitchell, NASA Johnson Space Center
1. I NTRODUCTION
Abstract—This paper analyzes fault tolerance of spacecraft relative navigation in Automated Rendezvous and Docking (AR&D). The relatively low technology readiness of existing relative navigation sensors for AR&D has been carried as one of the NASA Crew Exploration Vehicle Project’s top tasks. Fault tolerance could be enhanced with the help of FDIR (Fault Detection, Identification and Recovery) logic and use of redundant sensors. Because of mass and power constraints, it is important to choose a fault tolerant design that provides the required reliability without adding excessive hardware. An important design trade is determining whether a redundant sensor can be normally unpowered and activated only when necessary. This paper analyzes reliability trades for such fault tolerant system. A Markov Chain model of the system is composed of sub-models for sensor faults and for sensor avionics states. The sensor fault sub-model parameters are based on sensor testing data. The avionics sub-model includes FDIR states; the parameters are determined by Monte Carlo simulations of the near field docking approach. The integrated Markov Chain model allows the probabilities of mission abort and a mishap to be computed. The results of the trade study include dependence of the probabilities on the backup sensor activation delay.
NASA’s Exploration System architecture has a requirement for automated rendezvous and docking (AR&D) of the spacecraft. The relatively low technology readiness of existing relative navigation sensors for AR&D has been carried as one of the NASA Crew Exploration Vehicle (CEV) Project’s top tasks, e.g., see [6], [14]. Operating a chaser spacecraft in proximity of the target during a docking approach is safety critical because of the collision risk. The relative navigation system needs to be faulttolerant; a fault could lead to a mishap. From many points of view AR&D is similar to aircraft Autoland systems, which navigate and guide aircraft relative to a landing strip. Much work on fault tolerant design of Autoland was done in the 1980s when these systems were first developed and introduced, e.g., see [7]. By contrast, there is little prior work on fault tolerance of AR&D navigation. Because of spacecraft mass and power constraints, it is important to choose a fault tolerant design providing required reliability with minimum hardware. One challenge is determining how many redundant relative navigation sensors are needed. Another is determining whether the redundant sensors can be kept unpowered and activated only when necessary.
TABLE OF C ONTENTS 1 2 3 4 5 6
I NTRODUCTION . . . . . . . . . . . . . . . . . . . . . . . . . . . . . . . . . . . M ARKOV CHAIN MODEL . . . . . . . . . . . . . . . . . . . . . . . . . S ENSOR MODEL . . . . . . . . . . . . . . . . . . . . . . . . . . . . . . . . . . AVIONICS /FDIR MODEL . . . . . . . . . . . . . . . . . . . . . . . . . A NALYSIS RESULTS . . . . . . . . . . . . . . . . . . . . . . . . . . . . . . C ONCLUSIONS . . . . . . . . . . . . . . . . . . . . . . . . . . . . . . . . . . . . R EFERENCES . . . . . . . . . . . . . . . . . . . . . . . . . . . . . . . . . . . . . B IOGRAPHY . . . . . . . . . . . . . . . . . . . . . . . . . . . . . . . . . . . . . . .
1 2 3 5 6 7 8 9
We consider spacecraft relative navigation during close-range approach. The system fault tolerance and redundancy management (FT/RM) configuration is as outlined in [23]. There are two relative navigation sensors. Normally, the main sensor is used. The backup sensor is activated if the main sensor fails. An alternative is having both sensors operational all the time. We assume that the inertial navigation system of the spacecraft is fault tolerant. This paper studies (FT/RM) of relative spacecraft navigation for the described system configuration. The analysis approach could be used for other FT/RM architectures and configurations.
This work was supported by NASA Exploration Systems Mission Directorate ETD Program, AR&D Sensors project, through Mitek Analytics LLC research subaward #8318-MAL-001, perotsystems-QSS prime contract #NNA04AA18B. U.S. Government work not protected by U.S. copyright. IEEEAC Paper #1251, Version 6 Updated 12/02/2007.
Looking at the relative navigation system design from the FT/RM perspective, the first question is:
1
Question 1: Is the two fault tolerance requirement (Fail Operational/Fail Safe) achieved?
[21] is exponential explosion of state dimension for complex models. This is not an issue herein. We develop simple Markov chain models for system parts. One such part is a relative navigation sensor that can experience an intermittent failure. Another such part is the sensor avionics, which host fault detection identification and recovery (FDIR) logic. The partial models are integrated taking into account interactions between the main and backup sensor and respective avionics systems.
A short answer to this question is ‘yes’. This answer is based on our earlier study [10]. Achieving the fault tolerance requires (i) being able to detect a fault of the relative navigation sensor and (ii) having a redundancy management and fault recovery capability. The relative sensor fault detection approach based on analytical redundancy is discussed in detail in [10]. It relies on fault-tolerant inertial navigation. The basic idea is that an observed relative pose change must be accompanied by commensurate acceleration and rotation measured by the IMUs. A mismatch indicates a fault.
The integrated model has just 24 states and can be built manually. It is however preferable to automate model development and integration. We integrate the models using off-the shelf software. There are several software packages, a few of them freely available, that facilitate building Markov chain models for PRA. Some of them are surveyed in [3].
If a persistent fault of the relative navigation sensor is detected, a backup sensor could be activated to continue operation (Fail Operational). A fault of the backup relative navigation sensor could be detected the same way. The second failure would require aborting the AR&D approach (Fail Safe). A brief discussion of the Guidance and Control (G&C) for the abort is contained in [10]. The analysis in this paper assumes that a safe abort of the docking approach is always possible. This simplifying assumption is introduced to reduce complexity and to focus on the navigation system analysis. Once the CEV G&C logic for the docking abort is established, the analysis can be extended to include the interaction between the navigation and G&C.
The main contribution of this paper is the trade study for fault tolerant design of relative navigation system for AR&D. The trade study results are useful for design of NASA CEV spacecraft. The results are detailed in Section 5 of the paper. The PRA approach in this paper integrates the Markov chain model of the mission from interacting, simpler sub-models. The approach and the modeling methodology detailed in the next sections could be considered as a separate contribution. The model is overviewed in Section 2 of the paper. Section 3 describes the sensor fault submodel. It presents sensor test data analysis contributing to model parameter understanding. Section 4 describes the sensor avionics submodel, including the FDIR logic. The section discusses a Monte Carlo simulation study of relative navigation used to evaluate the parameters of the avionics model.
The answer to Question 1 and the above discussion of the fault tolerance do not depend on the sensor reliability. The main focus of this study is Question 2: Is the AR&D mission failure probability sufficiently small to be acceptable?
2. M ARKOV CHAIN MODEL
The answer depends on the reliability of the relative sensors. It also depends on reliability improvements provided by the FT/RM architecture. Establishing probabilities of mission failures (mission abort or a mishap) requires probabilistic risk analysis (PRA), which is the main focus of this study.
In this work, the system level performance of the FT/RM architecture is modeled using a continuous time Markov chain model. Since use of continuous Markov chain models in engineering analysis is not standard, below is brief background. A detailed mathematical formulation of continuoustime Markov chain models can be found in [20] among other textbooks. In a general form, the model is described by n discrete states. AtPtime t, it can be at state k with a probability xk (t), where k xk (t) = 1. The probability of transition from state j into state k 6= j over an infinitesimal interval of time [t, t + dt] is assumed to be qkj xj (t)dt, where qkj ≥ 0 is a constant transition rate. The probability rate of staying in the same state j is
The PRA must address (i) the presence of a redundant spare (backup sensor) (ii) the intermittent nature of sensor faults and possibile recovery (with a delay) in sensor fault detection logic. These problem features cause logical loops and are difficult to model with standard fault trees. A possible approach is to use a dynamical fault tree (DFT) model. The discussion in [21] indicates that there are several alternative interpretations and formulations of DFT models. This could make the approach not completely rigorous. An alternative formulation, which we use, is a continuous-time Markov chain model. Such models are used for PRA of fault tolerant computer systems with stand-by spares and component repair (reboot), e.g., see [19], [25] among many papers in this area. More examples of modeling PRA problems with logical loops using Markov chains can be found in [2], [4], [5], [17].
qjj = −
n X
qkj .
k=1,k6=j
The evolution of the state vector x(t) = [x1 (t), . . . , xn (t)]T is given by x(t) ˙ = Qx(t)
The main drawback of using Markov chains mentioned in 2
(1)
where Q is a n × n transition matrix with entries qkj . An advantage of the model (1) is that the solution can be found semi-analytically in the form x(t) = exp (Q(t − t0 )) x0 ,
is considered a success. If both sensor heads are faulty and these faults have been detected by the avionics, then the mission is aborted. Finally, if the sensor head is faulty but the sensor avionics erroneously considers the sensor healthy (an uncovered failure), then a mishap outcome is assumed.
(2)
where x0 = x(t0 ) is the initial probability distribution vector. This allows models of large size to be solved. A disadvantage is that only exponential transition probabilities are modeled. Backup Sensor
The partial models and their assumed parameters are discussed in detail in Sections 3 and 4 of the paper. Section 5 presents the assumed set of the model parameters and considers sensitivity of the analysis results to the parameter variations.
Backup Sensor Avionics
We used an evaluation version of Mobius package from UIUC [15] to build the model. The model is simple and could be also integrated manually (this would be more laborious, though) or by using one of several other software packages available, e.g., see the survey in [3].
Main Sensor
Mission Outcome: {Success, Abort, Mishap} Main Sensor Avionics
3. S ENSOR
MODEL
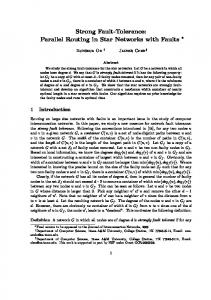
Consider a model for the fault condition of a relative navigation sensor. The model is illustrated in Figure 2 and includes two states: Sensor Healthy (state #1) and Sensor Faulty (state #2). As mentioned above, these states describe environmental conditions that cause deterioration of the sensor performance, such as glint and lighting.
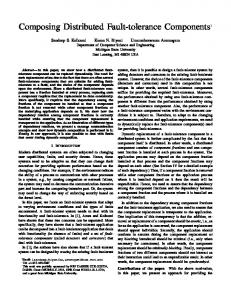
Figure 1. Overview of the PRA model A continuous time Markov chain model for relative navigation FT/RM is build by integrating partial models, see Figure 1. The four partial models shown in Figure 1 are described in detail in the subsequent sections of the paper. The two models describe the fault condition of the main and the backup relative navigation sensor. The models describe the condition of the sensor heads and its relation with the environment condition (such as glint and lighting) that can influence the sensor performance. These two Markov chains are identical and independent.
1
Sensor Healthy
2
Sensor Faulty
Figure 2. Markov chain model for sensor fault
Two more models describe the state of the avionics hardware and software for the main and the backup sensor. The FDIR algorithms are a part of the avionics software. The avionics models for the two sensors are independent and identical, with the exception of the initial state.
The model in Figure 2 is fully described by two transition rates: the sensor failure rate q12 and sensor fault recovery rate q21 . These rates were assumed as shown in Table 1 (The Mean Time is an inverse of the Rate).
The arrows connecting the partial models in Figure 1 describe the dependencies between the partial models. In particular, the main sensor avionics state is influenced by the state of the sensor head for the main sensor. (The FDIR algorithms in the sensor avionics detect, or not, a fault of the sensor head). Similarly, the backup sensor avionics state is influenced by the backup sensor head state. In addition, the backup sensor avionics state is influenced by the main sensor avionics state. (The backup sensor is activated if the main sensor fails).
Transition (from → to state) Sensor failure (1 → 2) Sensor fault recovery (2 → 1)
Rate (sec−1 ) 3 · 10−7 1 · 10−2
Mean Time 100 h 100 s
Table 1. Sensor fault model parameters
Table 1 can be justified as follows. The sensor failure rate is based on the experience with AVGS units described in [11], [14]. No sensor failures were registered in about 1000 hours of lab and flight tests. A conservative assumption that one failure happens every 1000 hours on average yields the rate shown in the table. The assumed failure rate has a similar order of magnitude to the sensor failure rates assumed in the NASA ESAS reliability study [8] based on the relative navigation sensor failures observed in Shuttle flights.
Figure 1 also shows schematically the mission outcome (the oval in the middle). We consider three possible mission outcomes: mission success, mission abort, and a mishap. The solution (2) of the Markov chain is calculated on a given time interval (over the duration of the docking approach). The probabilities of these outcomes are evaluated in the end of the interval. If at least one sensor head is healthy and the respective sensor avionics perform nominally, then the mission 3
The sensor fault recovery rate characterizes mean time the sensor is off-line because of a fault. The main sources of intermittent faults for optics-based sensors are environmental factors such as glint or lighting. The lighting conditions depend on the sun angle. For low Earth orbit with a 120 min orbital period, a 100 second time interval corresponds to a 5 degree change in the sun angle. This should provide a sufficient lighting environment change for the glint to go away. The 100 second average persistency of the fault corresponds to the sensor fault recovery rate in Table 1.
Figure 3. Sensor test data for determining outliers
Sensor model discussion we can estimate an empirical probability of the outlier. Figure 4 shows the results obtained for different thresholds (solid line) together with the cumulative probability density for χ26 (dashed line).
Let us discuss the sensor failure model in more detail. An extensive program of testing several types of relative navigation sensors was carried at NASA. The tests are described in [14]. In this work we used the sensor test data to build a more detailed characterization of the faults. In the test, the target is moved with respect to the sensor, which measures the relative pose. The sensor output data are recorded along with the ground truth data obtained with an independent highaccuracy measurement system. The differences between the two measurements (residuals) can be then analyzed. At each point in time, the residual vector consists of three linear coordinate residuals and three attitude angle residuals.
The empirical cumulative probability distribution (solid line) in Figure 4 has heavy tail. It decays slower than the cumulative probability distribution for normally distributed residuals (dashed line). At the same time, engineering approaches to FDIR algorithm design assume a normal distribution model for outlier detection. There are two possible approaches to handling this discrepancy 1. Assume that the covariance is larger than the empirical such that all the data points are bounded by the χ26 distribution envelope. Current design follows this approach. There are no outliers, but the sensor accuracy specifications are relaxed. 2. Assume the empirical covariance obtained from the data. This covariance is by a factor of 20 smaller compared to the first approach. The smaller covariance improves the accuracy of the navigation filter. At the same time, more outliers (faults) in the sensors data must be detected and removed. The drawback of the approach is that it has more reliance on the FDIR logic to handle the outliers.
The low sensor failure rate in Table 1 is ascertained by having sufficiently relaxed sensor error specifications. Tightening these specifications would lead to a higher rate of intermittent sensor faults. Having an FDIR logic and FT/RM architecture in place allows trading a higher sensors fault rate against the improvement in sensor accuracy specs. This paper analyses the tradeoffs with respect to mission risks. The residual data for the sensor could be characterized using the empirical covariance matrix. N
Q=
1 X rj rjT N − 1 j=1
(3)
The trades between the two described approaches can be evaluated by using the developed PRA framework. One model parameter that is impacted is sensor failure rate in Table 1. Another model parameter is the sensor noise covariance, which influences the FDIR-related performance probabilities discussed in the next section.
where rj ∈