VoIP (Voice over IP) services are using the Internet infras- tructure to enable new ... in the US to a computer in Australia, 220.245.140.196 for example, shows ...
Feasibility of Voice over IP on the Internet Alex Sherman, Jason Nieh, and Yoav Freund Department of Computer Science Columbia University Email: {asherman, nieh, freund}@cs.columbia.edu ABSTRACT
States (US) calling area. However, user experience and anecdotal evidence indicate that international calls can suffer from long delays which result in poor conversation experience. For example, Vonage customers indicate that delays on international calls can be over a second [16]. It is easy to identify the cause of this unfortunate phenomenon. Telephony standards dictate that for a connection to be of acceptable quality, the delay time has to be below 150ms each way, or 300ms round trip time (RTT) [11]. On the other hand, issuing a ping command from a computer in the US to a computer in Australia, 220.245.140.196 for example, shows delays varying between 270ms RTT and 1300ms RTT. In addition, Internet links sometimes suffer significant packet loss which degrade VoIP quality and cause disconnections. It is estimated that standard voice coding schemes suffer serious quality degradation if packet loss exceeds 0.5% [11]. While there exist methods that can overcome higher packet loss rates, the price for this ability is increased delay. Because the enormous importance of VoIP will only continue to increase on a global scale with the rapid improvements in network bandwidth, cost, and ubiquity, it is crucial to understand the limits and effectiveness of VoIP across the Internet for supporting phone calls across diverse geographic regions. However, the feasibility of VoIP on the Internet on a global scale is not well understood and little experimental data is available to quantify the performance of VoIP in these network environments. Even if VoIP performance can be quantified and new mechanisms can be developed to better support VoIP on a global scale on the Internet, previous attempts to introduce and deploy changes to the underlying Internet infrastructure have been very difficult and generally not had much success. The simplicity and universality of Internet protocols is probably the main reason for the great success of the Internet. However, the large installed base and substantial investments in existing Internet protocols and the underlying infrastructure has also made the Internet resistant to change. Overlay networks have been proposed as a mechanism for deploying novel Internet technologies without requiring disruptive changes to the underlying Internet infrastructure. An overlay network consists of a set of packet routers operating at a higher-level which collaborate to provide improved routing to their clients. Overlay networks use the existing Internet infrastructure and build on top of it an additional routing mechanisms that can overcome some of the problems of the default Internet routing protocol. For example, a resilient overlay network (RON) [1] can overcome the failure of a link between two nodes by routing packets through a third node and in this way avoiding the faulty link. We conduct the first global scale experimental studies of VoIP performance and explore the benefits of introducing an overlay network to improve end-to-end quality of service (QoS) for VoIP over the Internet worldwide. Our ex-
VoIP (Voice over IP) services are using the Internet infrastructure to enable new forms of communication and collaboration. A growing number of VoIP service providers such as Skype, Vonage, Broadvoice, as well as many cable services are using the Internet to offer telephone services at much lower costs. However, VoIP services rely on the user’s Internet connection, and this can often translate into lower quality communication. Overlay networks offer a potential solution to this problem by improving the default Internet routing and overcome failures. To assess the feasibility of using overlays to improve VoIP on the Internet, we have conducted a detailed experimental study to evaluate the benefits of using an overlay on PlanetLab nodes for improving voice communication connectivity and performance around the world. Our measurements demonstrate that an overlay architecture can significantly improve VoIP communication across most regions and provide their greatest benefit for locations with poorer default Internet connectivity. We explore overlay topologies and show that a small number of well-connected intermediate nodes is sufficient to improve VoIP performance. We show that there is significant variation over time in the best overlay routing paths and argue for the need for adaptive routing to account for this variation to deliver the best performance.
1.
INTRODUCTION
VoIP (Voice over IP) transfers voice data through IP packets over the Internet, enabling users to use the Internet to make and receive telephone calls instead of a traditional phone line. A major advantage of VoIP is that it avoids the more expensive toll charges of POTS (Plain Old Telephone Service). As a result, VoIP service providers such as Skype, Vonage, and Broadvoice, as well as many cable services are offering telephone services at reduced costs. VoIP technology is now being leveraged by E-Bay and Google to solidify their on-line presence. It is expected that the economic benefits of VoIP technology will soon force all traditional phone companies to offer the cheaper service [22]. Although VoIP provides significant cost advantages, the quality of VoIP communications remains an issue. Audio quality provided by these services is often comparable to those of POTS as long as the calls are within the United
Permission to make digital or hard copies of all or part of this work for personal or classroom use is granted without fee provided that copies are not made or distributed for profit or commercial advantage and that copies bear this notice and the full citation on the first page. To copy otherwise, to republish, to post on servers or to redistribute to lists, requires prior specific permission and/or a fee. Copyright 200X ACM X-XXXXX-XX-X/XX/XX ...$5.00.
1
nodes chosen adaptively to route VoIP packets. There has been much work in the area of Resilient Overlay Networks (RONs) starting with [1]. The original work on RONs was directed towards using a set of overlay nodes to route around network failures. Andersen et. al. continued the study of RONs in [3]. They noted that many failures on the Internet are co-related and many routing faults are avoidable. They offer two techniques of dealing with failures: packet replication and adaptively choosing alternate routes. More recent work on RONs include one-hop source routing [4] that studies improvements to website connectivity by using random intermediate nodes. The authors note that by choosing randomly from only a small set of overlay nodes, website connectivity can be significantly improved. OverQoS [8] is a recently proposed infrastructure for generic applications that could get an improved QoS by using an overlay solution. The Spines overlay network [5] is another ready-made overlay tool. Unlike many of these efforts, we are specifically interested in RONs for VoIP traffic on the Internet not just alternative paths to route around network failures. VoIP networks carry more stringent requirements for network delay and packet loss than most other communications such as FTP, for example. The idea of using RONs for VoIP is not new, but its feasibility has not been well-studied. A recent work on 1800-Overlays [2] presents a working overlay system for VoIP using Spines. That work is mostly focused on implementing the concept of a VoIP overlay and evaluation was only done in a testbed environment and a small PlanetLab deployment of only nodes in the United States (US). Our work conducts a much larger scale study that measures connectivity for over 200 PlanetLab nodes that span diverse geographic locations around the world. Our measurement study provides the first quantitative evaluation of the potential improvement that a world-wide VoIP overlay could achieve. Previous studies have related network characteristics to the quality of VoIP. The earlier recommendations for network VoIP parameters appear in [19] and [20]. The authors of the Beacon project [10, 11] evaluated effects of various loss, jitter and delay on VoIP quality. They concluded that good VoIP quality requires less than 150ms delay and less than 0.5% packet loss. Some other studies have measured VoIP quality over the Internet. [18] looked at inter-connectivity of nine sites in the Americas and Western Europe. They concluded that almost all of the sites have reasonable VoIP inter-connectivity. We consider a much larger set (98 sites) and include a much more diverse set of countries and geographic locations. Moreover, our study provides more accurate measurement granularity by taking pairwise measurements within much closer proximity in time. This allows us to correlate these measurements to assess how an overlay would behave at the time when some direct routes are suffering. [12] studies inter-connectivity among some ISPs. They find some spikes or loss outages that occur on the backbones almost daily. Their study once again is limited to several US ISPs.
periments measure the feasibility and performance of VoIP across a hundred network locations spread across five different continents: Asia, Australia, Europe, North America, and South America. We quantitatively identify network links with sufficient quality over an extended period of time to carry VoIP with acceptable quality and reliability. Our results quantitatively demonstrate that the existing default Internet routing mechanisms can provide suitable VoIP quality on a limited scale within some local geographic regions, but provides very poor QoS for VoIP in a large number of cases when more diverse geographic regions are considered. To address this problem, we experimentally evaluate the benefits of using overlay networks to provide QoS to increase the number of node pairs that can use VoIP at an acceptable quality. Our focus of using overlay networks to provide QoS differs from the goal of most previous work. The problem RONs aim to overcome is that the Internet routing protocol is designed to identify connecting routes but does not aim to find routes with a desired Quality of Service (QoS) profile. The goal of a QoS overlay network is to identify a composite path, going through several intermediate nodes, which achieves a desired QoS when the direct link does not have the desired QoS. Clearly, estimating QoS over a composite route requires much more elaborate communication than simply identifying a connecting route. However, the focus of our study is not on developing and implementing the required protocols for such a QoS overlay. Our focus is in laying the foundation for such developments by providing quantitative analysis to first establish to what extent such a QoS overlay network has at least the potential for achieving significant improvements for VoIP quality. Our results provide evidence that the potential for such improvement is indeed very significant, particularly for less well-connected geographic regions. The contributions of this paper are as follows. First, this paper explores the feasibility of VoIP on the Internet at the global scale and the benefits of a QoS overlay network for improving VoIP performance. Specifically, we show that communication among many geographical regions can be improved via an overlay to be comparable with POTS telephony standards. Secondly, we show that for some intercontinental communication where the parameters cannot be improved sufficiently for an ideal POTS quality of service, they could still be improved significantly. For such regions it is still possible to provide a slightly “less than perfect” voice service that perhaps could be offered to consumers at a reduced cost. Finally, by showing that the best overlay paths could be changing rapidly, we build motivation for adaptive routing infrastructure. The rest of the paper is organized as follows. Section 2 describes related work. Section 3 describes our experimental design and measurement methodology using PlanetLab [6]. Section 4 presents our measurements and discusses their implications for VoIP performance. Finally, we present concluding remarks and directions for future work.
2.
RELATED WORK
3.
Today many companies such as Skype [13], Vonage [15], and Broadvoice [14] offer VoIP services. Although it is not known exactly what these companies do, from observed quality it appears that most of the time a user’s default Internet connection is used without much infrastructure. One way to improve this scenario is via an overlay network of
EXPERIMENTAL DESIGN
To evaluate the feasibility of VoIP on the Internet and the potential benefits of a QoS overlay for VoIP at a global scale, we conducted our experiments using a live Internet deployment of geographically distributed sites. Our focus was to measure the impact of the network characteristics of 2
the Internet infrastructure on VoIP feasibility.
3.1
ets that arrive after the allowed 150ms delay threshold are counted towards loss in our connectivity quality metric. We also explored the impact of alternative delay and packet loss thresholds in our connectivity quality metric. We also apply the same quality metrics used for individual nodes to domains. Domains, which we also refer to as regions, represent nodes within the same hosting institution, such as utexas.edu or rnp.br. To measure connectivity between a pair of regions, we take the statistics between the best-connected nodes in each region, as discussed in further detail in Section 4. We believe this is a fair analysis as we are taking an average between those nodes over time. More importantly, since we are focusing on network parameters, taking two best nodes will likely eliminate problems due to transient hardware or software endpoint failures and focus on the fundamental underlying network characteristics. Our 224 PlanetLab nodes comprise 97 distinct regions.
Experimental Testbed
We conducted our measurements using PlanetLab. PlanetLab provides two important advantages for our experiments. First, it provides a set of geographically distributed nodes around the world, which is crucial for measuring VoIP quality at a global scale. Second, it provides realistic network conditions in a wide area deployment. PlanetLab consists of close to a hundred regions located in distinct countries and networks. This wide-area geographic and network deployment was exactly the type of environment that we wanted to consider for measuring VoIP performance. An alternative approach could have been to use artificially induced conditions in a simulated environment such as Emulab [7]. Although these environments can model quite complex network interactions, they still model predictable events that one could program around and adapt to. In artificial environments, it is hard to model realistic faults, machine and network failures, varying loads and router bottlenecks induced by human faults and otherwise unpredictable load and events. In our study, we specifically were interested in the feasibility of VoIP in the Internet setting and therefore we choose a live Internet deployment. A downside of using PlanetLab is that it may reflect a deployment specific to educational institutions. Many institutions inside the US, for example, communicate via highspeed Internet2. However, if high speed networks are successful, they will only be adapted more quickly across the globe. Furthermore, Internet2 is only used by a subset of the PlanetLab nodes. In particular, most of the sites outside US that do not relay on the Internet2 still can benefit tremendously by using an overlay. We conducted our experiments using 224 PlanetLab nodes located in many distinct countries in North and South America, Eastern and Western Europe, Middle East, Australia and the Far East. With these nodes, we attempted to cover all available PlanetLab regions, although machines in some regions were down during our experiments. To provide some redundancy so that we could continue collecting data across many regions during downtime of some machines, we typically selected two and sometimes three machines per region. To obtain data over a sufficiently long time period, we conducted our experiments for a ten day time period from April 22, 2005 to May 2, 2005. Because of the instability of the PlanetLab nodes, some of the 224 PlanetLab nodes were down for most of the time period covered by the experiments. Typically, 30 to 40 of the machines were unavailable at any given time. In the end, we were able to collect data covering 97 US and International regions.
3.2
3.3
Measurement Methodology
Our primary objective was to measure network latency and packet loss between pairs of PlanetLab nodes to determine whether acceptable VoIP quality was achievable between the respective nodes. These two network characteristics are key for determining whether VoIP quality conforming to acceptable telephony standards of less than 150ms delay and less than 0.5% packet loss is possible. Because we were primarily interested in the underlying network characteristics, we did not directly run a full VoIP application for measurement purposes for two reasons. First, lower-level network measurement tools were simpler to use to obtain the desired results. Second, because PlanetLab nodes are shared and sometimes loaded, we wanted to minimize the impact of having other activities running on the node on our measurements. In practice, a VoIP terminal will not be loaded and we did not want loading on the endpoint to skew the results. We measured the key network characteristics by performing pairwise bursts of ICMP pings between every pair of 224 PlanetLab nodes used for our experiments. We used ICMP pings primarily for simplicity. Moreover, since it is the operating system kernels that reply to ICMP pings we avoid some of the scheduling overhead on destination nodes since it is not necessary to schedule a listening process to handle requests. This helps to reduce some measurement variation due to the nodes being loaded. However, at the source node, local processes are executed to initiate ping bursts, process replies, and measure the round trip time (RTT). The downside of choosing ICMP is that some networks filter out ICMP traffic. The result is that some nodes may not be reachable using ICMP pings. In our experiments, the number of nodes that were not reachable for this reason was very small and they were simply factored out of our results. All of the ping tests were performed in bursts of 400 packets each. Bursts were used rather than rarer individual pings to more closely reflect the characteristics a voice conversation that consists of a stream of packets. By measuring characteristics of a burst, we capture any possible effects a stream could have on intermediate routers and end-point interfaces. Furthermore, when measuring packet loss for VoIP, it is more important to measure loss burstiness, rather than the average loss. The reason is that audio codecs often duplicate or spread information across multiple packets. It is the loss
Quality Metrics
Previous work indicates that VoIP communication that experiences delays of over 150ms and packet loss of over 0.5% quickly degrades in quality [19, 20, 10, 11, 21]. For our experiments, we used these delay and packet loss thresholds for determining whether a route could deliver acceptable VoIP quality. We define two nodes as sufficiently connected if the average latency of received packets is under 150ms and not more than 0.5% of the packets are lost for a measurement period. We also refer to two nodes as having connectivity for VoIP if they are sufficiently connected. Given that VoIP codecs will drop packets that arrive after too late, pack3
of consecutive packets that effects a voice conversation more. We capture such effects more precisely with a quick burst of packets. Each ping burst contains 400 64-byte packets sent with 20ms interval between packets. Each node sends a burst to every other node every 10 minutes. The packet size and delay of our bursts are representative of packetization parameters of a typical audio communication. Note that a loss of 2 packets within our burst that lasts for 8 seconds would still fall within the 0.5% loss range for acceptable VoIP quality. Ping bursts are performed in parallel via a pool of threads. The start of each burst is randomized, but we ensure that there is exactly one burst towards each other node every 10 minutes. The reply packets are collected by a distinct designated thread to avoid conflicts between sending and receiving packets for the same burst and to minimize potential delays in estimating the packet latency. To deal with possible ping process failure, we run a cron job on each machine that restarts our pinging application. In addition, we run a script that restarts the cron daemon in our PlanetLab slice after every machine reboot. These mechanisms were important for our experiments since PlanetLab nodes are all managed individually by their hosting institutions and machines are often brought down unexpectedly due to upgrade, repair or failure. Our restart automation techniques worked quite well for our experiments.
3.4
VoIP connectivity between most region-pairs. In our evaluation we first look at average network-wide statistics and over the ten day period and then turn our attention to variations among regions and time periods. Finally, we look at the overall topology formed by these nodes that gave us some insights for the optimal routing paths.
4.1
We first measured average connectivity of each node over the ten day period. To evaluate whether a pair of nodes are sufficiently well connected we required a maximum delay of 150ms and maximum packet loss of 0.5%. These requirements are based on our search in the literature as well as conversations with experts in this area. [21]. It was the consensus between those sources that the quality of VoIP degrades quickly with greater delay or packet loss. For each ping packet burst of 400 packets, we collected statistics of average delay and packet loss. We calculated delays as RTT/2, where RTT was the average measured round trip time of a ping packet. Any packet that arrived beyond the 150ms delay (or 300ms RTT) was counted towards the packet loss. For average statistics over a large time period, we simply averaged the statistics over each ping burst in that period. In this way, we potentially miss some spikes of poor connectivity, but it gives us a good first approximation as to how well-connected different nodes and regions are. Figure 1 compares average node connectivity for each node between the default direct routing and overlay routing, the latter computed using optimal shortest paths as discussed in Section 3.4. Average node connectivity is the fraction of other nodes with which each node has satisfactory VoIP network characteristics based on the 150ms maximum delay and the 0.5% maximum packet loss. For example, an average node connectivity of 0.5 means that the given node has satisfactory VoIP connectivity to 50% of the nodes on average across the timeframe of the experiment. For visual clarity, the nodes are sorted in order of increasing default connectivity. The results of shortest path overlay routing are necessarily at least as good as the default routing since in the worst case when there is no benefit of using intermediate nodes, the overlay route between any two nodes is the same as the default route. Figure 1 shows that the overlay significantly improves VoIP connectivity for almost all nodes. The best improvement comes for the nodes that have a good connectivity to a small segment of the rest of the network, roughly 5-10%. For such nodes, the overlay often improves connectivity to 6070%, in some cases being more than an order of magnitude improvement in connectivity. On average, while the default connectivity of a node using default routing was only 32%, it is improved to 53% connectivity with an overlay, representing a 65% improvement. These measurements suggest tremendous opportunity for VoIP quality improvement for many of the regions using an overlay. Some nodes have very poor VoIP connectivity anywhere for one of two reasons. One set of nodes were those with high packet loss on all routes that connected to these nodes. Such nodes can rarely be improved with an overlay. The other set of nodes were nodes that exhibited no connectivity due to being down most of the time during our measurement period. Excluding the nodes that were down most of the time during our measurement period, the overlay improves
Shortest Paths using an Overlay
Where the default routing between two nodes does not qualify them as “sufficiently connected” a better route may be possible using intermediate nodes. We use a simple allpairs shortest paths algorithm (based on the Bellman-Ford single source shortest paths) to find the shortest delay route between each pair of nodes. Rather than factoring the packetloss into the path’s weight function we use packet loss as a constraint. Specifically, we sum the packet loss statistics on each segment of the path, and reject a path if the combined packet loss exceeds 0.5%. Then we look for the next shortest path that adheres to the constraint. The shortest-paths algorithms helps “connect” some previously poorly connected nodes, but it does not guarantee a 150ms delay between every pair of nodes. Still we are interested in measuring how often the shortest-path could reduce delay between a pair of nodes. While the users of such nodes may experience a poorer quality conversation it still comes as an improvement on the default Internet routing often used by companies like Skype and Vonage. Of course creating a path with multiple intermediate nodes is not always practical. Using PlanetLab nodes as routers is not feasible without real-time scheduling as noted in [2]. OS scheduling could delay packet forwarding by hundreds of milliseconds precluding the overlay usefulness. In our study we simply want to identify the potential for improvement with an overlay that could be achieved with more sophisticated routing points.
4.
Pairwise Connectivity
MEASUREMENTS
We collected data from 224 of the PlanetLab nodes over a over a period of ten days between April 22 and May 2, 2005. We analyzed this data to assess pairwise connectivity among the nodes and regions. In addition, we computed best paths available between every pair of regions. This computation helps us build the case for using overlay networks to improve 4
0.8
0.75 0.7 Percentage of inter-node connectivity
Percentage of inter-node connectivity
0.7 0.6 0.5 0.4 0.3 0.2 0.1
0
50
100
150
200
0.6 0.55 0.5 0.45 0.4 0.35 0.3
direct overlay
0
0.65
direct overlay
0.25 250
Apr 23
Apr 25
Nodes sorted by their default VoIP connectivity
0.75
0.14 0.12 0.1 0.08 0.06 0.04
0.7 0.65 0.6 0.55 0.5 0.45
0.02
0.4
0
0.35 50
100
150
200
May 1 2005
0.8
direct overlay
0
Apr 29
Figure 3: Average node connectivity across all nodes over time across for time period
Percentage of inter-node connectivity
Variance of the fraction of VoIP connectivity to other nodes
Figure 1: Average node connectivity with default and overlay routes 0.16
Apr 27 Time
direct overlay 2am
250
8am
2pm
8pm
Time
Nodes sorted by their default VoIP connectivity
Figure 2: Variance in node connectivity with default and overlay routes
Figure 4: Average node connectivity across all nodes over time for one day
routing connectivity from 38% for the direct case to 64% using the overlay. Figure 2 compares the variance in the node connectivity for each node between the default direct routing and overlay routing. The variance is computed among the averages of four-hour time slices over the ten day period. The nodes in Figure 2 are sorted in the same way as in Figure 5, in the ascending order of the default node connectivity. Figure 2 shows that the variance in connectivity using the overlay is generally very low. For most of the nodes, using the overlay reduces the variance in connectivity versus using the default direct routing. This is particularly evident for the nodes with higher default node connectivity where the variance for the overlay is barely visible compared to the much higher variance for the direct case. These measurements suggest that using an overlay also improves VoIP connectivity by helping to ensure that nodes that are sufficiently connected stay sufficient connected. Figure 2 shows that in a small number of instances, the variance in using the overlay is higher than using the direct routing. Comparing Figures 2 and 5, the measurements show that the nodes with highest variance were those with worse average connectivity and virtually no connectivity in the direct case. The variance in connectivity for these nodes is low for direct routing because they essentially stay dis-
connected through the entire time period. In contrast, the variance in connectivity for these nodes is high for overlay routing because the overlay allows the nodes to be sufficiently connected for VoIP services for some of the time. To provide a measure of how of the average node connectivity varies over time, Figure 1 shows the average connectivity across all nodes over time throughout the course of the time period in which the measurements were obtained. Although there are connectivity oscillations over time, the key observation is that throughout the entire time period, the connectivity using the overlay is significantly higher than the connectivity using the default direct routing. These results show that the improvement from using the overlay is not limited to any particular small time period due to unusual network routing behavior, but that the improvements are valid and sustainable over an extended time period. To provide a measure of how of the average node connectivity varies over time at a finer granularity, , Figure 4 shows the average connectivity across all nodes over time for just one day, namely April 24, 2005. Similar to Figure 1, Figure 4 shows that during this shorter time period the connectivity using the overlay is also significantly higher than the connectivity using the default direct routing.
4.2 5
Connectivity Thresholds
direct with overlay
overlay direct
0.6 Percentage of inter-node connectivity
Percentage of iter-node connectivity
0.7
0.5
0.4
0.3
0.2
0.1 50
100
150
200
250
0.9 0.8 0.7 0.6 0.5 0.4 0.3 0.2 0.1 2
1.8 1.6 1.4 1.2 1 0.8 Maximum allowed packet loss 0.6 0.4 50
300 250 200 150 Maximum allowed delay 100
300
Maximum allowed delay
Figure 5: Average node connectivity across all nodes for different maximum allowable packet delay 0.75
Figure 7: Average node connectivity as a function of different maximum allowable packet delay and loss curve shows that very few direct paths among the nodes that we selected have both high latency and at the same time low packet loss. Also, because the curves in Figure 6 do not level off as quickly as the curves in Figure 5, they suggest that the packet loss is the more restrictive of the two parameters. Increasing allowable packet loss could result in a higher percentage of inter-connectivity than increasing allowable delay. In fact, at 2% packet loss, the fraction of sufficiently connected nodes using the overlay reaches 0.71. Finally, and most importantly we note that at all the depicted levels of packet loss and delay, the overlay routing noticeably improves overall node connectivity. Figure 7 shows the combined effect of varying packet loss and delay values on the overlay and direct connectivity. For both direct and overlay routing, the VoIP connectivity improves with increased allowable packet delay and packet loss since increasingly delay and loss relaxes the connectivity constraint. For the overlay, the lowest average connectivity of 23% occurs at 50ms allowed delay and 0.5% allowed packet loss. The maximum connectivity of 81% occurrs at 300ms delay and 2% allowed packet loss. At every point of comparison the overlay connectivity is significantly better than that of default direct routing. It is interesting to note that the absolute difference in improvement between the overlay and default routing becomes more pronounced as we relax the delay and the packet loss requirements, as shown by comparing the overlay and direct measurements at 300ms delay and 2% packet loss. This shows that in addition to improving VoIP connectivity for some regions to be within the ideal VoIP parameters, an overlay could be instrumental in providing satisfactory, albeit less than perfect, connectivity to many additional locations.
direct with overlay
Percentage of iter-node connectivity
0.7 0.65 0.6 0.55 0.5 0.45 0.4 0.35 0.4
0.6
0.8
1
1.2
1.4
1.6
1.8
2
Maximum allowed packet loss
Figure 6: Average node connectivity across all nodes for different maximum allowable packet loss To determine the sensitivity of our measurements to the specific connectivity metric used, we consider how VoIP connectivity changes using different packet delay and packet loss thresholds. We measured the average node connectivity for a range of different maximum allowable packet delays from 50ms to 300ms. We also measured the average node connectivity for a range of different maximum allowable packet loss rates from 0.4% to 2%. Figure 5 shows the average node connectivity across all nodes for the entire time period for different values of maximum allowable delay while keeping the maximum packet loss rate at 0.5%. Figure 6 shows the average node connectivity across all nodes for the entire time period for different values of maximum allowable packet loss while keeping the maximum packet delay at 150ms. We note several observations about these graphs. One obviously conclusion is that higher allowed delay and packet loss result in higher inter-connection percentages. For instance, as evidenced in figure 5, if we allow 200ms delay rather than 150ms, using the overlay the fraction of sufficiently connected nodes increases from 0.53 to 0.65. This means that a number of locations on the Internet could still communicate over VoIP effectively although perhaps with a slightly reduced quality since the allowable delays are longer. Second, it is interesting to note that the direct connectivity curve in Figure 5 levels off soon after it reaches 200ms. This
4.3
Number of Hops for Overlay
For an overlay to be useful, it must be possible to construct in practice. In particular, it is important to consider the number of intermediate nodes that may be necessary. While we did not restrict the number of intermediate nodes used in the shortest path overlay, we found that the average length of the shortest paths was close to two intermediate hops, indicating that an overlay does not need to have a large number of hops to provide a performance improvement. This is also important since as voice packets travel through the overlay they may incur non-trivial scheduling 6
0.8
0.7
0.75 Percentage of inter-node connectivity
Percentage of inter-node connectivity
0.8
0.6 0.5 0.4 0.3 0.2 0.1
direct 1 hop overlay overlay
0 0
50
100
150
200
0.7 0.65 0.6 0.55 0.5 0.45 0.4 0.35
250
direct overlay 1 hop overlay 2am
Nodes sorted by their default VoIP connectivity
8am
2pm
8pm
Time
Figure 8: Average node connectivity with direct, 1 hop overlay, and shortest path overlay
Figure 10: Average node connectivity across all nodes over time for one day including 1 hop overlay
0.75
Percentage of inter-node connectivity
0.7
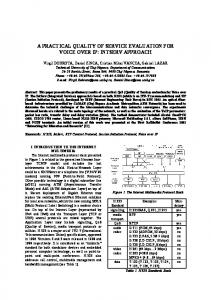
consisted of several geographic groups in the US and Europe. We then picked one region (most commonly used as a hop) from each such group. These regions were: “ucsc.edu”, “nyu.edu”, “uiuc.edu”, “simula.no”, and “tum.de”. We called these regions the “routing cluster centers”. In the next step we collapsed other well-connected regions to their closest cluster centers. This was done by looping through latency measures from 1ms to 30ms and collapsing all regions within the given latency measure to that cluster. More precisely, we imposed the constraint that within a cluster all regions where within the 30ms pairwise latency from one another. Looping from 1 to 30ms, rather than starting at 30ms biased the algorithm in such a way that the closest regions to the center were more likely to be collapsed together with that cluster, and the outer regions were more likely to fail the constraint test as they were added last. The reason we picked 30ms as the cut-off is because that appeared to be the smallest radius which brought most of the common routing points inside some cluster. In this way the topology representation could help highlight regions that were far from routing locations. Interestingly, with only a few exceptions the collapsed routing clusters formed across the geographical groups. These groups were the Western US, Eastern US, Central US, Northern Europe, and Central Europe. Figure 11 depicts the five routing core clusters with routing delays between their cluster centers. Each cluster is annotated with it’s center region, some examples of other collapsed regions in that cluster and the total number of regions included in that cluster. For instance UCSC.edu, representing the Western US includes regions such as “stanford.edu”, “ucsb.edu”, “washingto.edu” among others. The Northern Europe cluster contains regions in Denmark, Norway and Sweden. Interestingly the UK region was closer connected with the Central, rather than Norther Europe cluster, which an Island regions was tighter with the Norther Europe cluster. A few Canadian regions are split among the US clusters. The resulting routing clusters were well representative of our overlay intermediate hops. As an example of inferior clustering, when we tried to collapse the “Central” and “Eastern US” into one cluster we ended up with many good routing regions that were not included in any routing cluster based on our collapsing constraint.
0.65 0.6 0.55 0.5 0.45 0.4 0.35 direct 1 hop overlay overlay
0.3 0.25 Apr 23
Apr 25
Apr 27
Apr 29
May 1 2005
Time
Figure 9: Average node connectivity across all nodes over time across for time period including 1 hope overlay costs at each intermediate node. To that end it is beneficial to minimize the number of intermediate hops in an overlay. Toward this end, Figures 8 to 10 show the node connectivity using an overlay with the restriction of having at most one intermediate node and compare these results with the shortest path overlay and direct routing. In all cases, the 1hop overlay still provides a significant improvement over the default routing, and is only slightly worse than the shortest path overlay. Figure 8 shows that the 1-hop overlay performs well for each node, while Figures 9 and 8 show that the 1-hop overlay performs well over both the entire time period of the study as well as over a shorter one day time period.
4.4
Overlay Topology
To get a better visual insight into the routing paths that may be created by an overlay we worked on constructing an approximate topology of the PlanetLab nodes based on our measurements. For this construction we once again formed the shortest-path table using the average data from the 10 day period with 0.5% packet-loss constraint. We observed that a number of regions were used repeatedly as intermediate hops in the shortest paths graph of the overlay. We also observed that these regions typically 7
Once we defined the “routing core” we focused on the regions that were not included in any of the routing clusters after the collapsing process. We called these the “edge regions”. The edge regions were those that stood to gain the most from the overlay. With the next step we linked these edge regions to the cluster centers closest to each of those regions. The resulting topology and latencies are shown in figure 12. The topology does not include 21 regions which did not meet sufficient packet loss constraints to any of their neighbors and thus could also not be helped with the overlay. While this topology is not an exact shortest-pass graph for all pairs of regions, it is a close visual approximation of VoIP overlay conforming to the packet loss constraint of 0.5% packet loss. As an example, we look at the path between “edu.tw” linked with the Western US. cluster and “ru.is” linked with the Northern Europe cluster. Adding up the paths between these regions along the topology graph gives 187ms, while the actual shortest path table produces 181ms. The topology graph path is a close approximation. The slight overhead is due to the fact that we are using cluster centers as the hops instead of possibly slightly more optimal regions inside the clusters. Note, also, that the direct route between these two regions results in too much packet loss, while the overlay route produces quality close to the optimal VoIP requirement of 150ms delay. We make a few observations about the formed topology. First of all the Asian regions and Australia route faster by going through the Western US even when routing to Europe. This means that by using a few well-connected regions in the Wester US one could expect VoIP communication from Asia to be of almost ideal quality to virtually anywhere else in the world. In fact, even when communicating between Asian regions for best VoIP characteristic the Western US cluster is used. Our data shows that some regions in Asia have better connectivity between one another when going through a Western US node. The regions “edu.cn” and “edu.tw” were such a pair of nodes. Second, a region in Israel “ac.il”, which is another growing high-tech spot connects best via regions in Central Europe. We also observe that out of the 21 regions not included in the topology representation several regions at times show reasonable connectivity. “ac.in” for instance (a region in India) was shown to have a decent connectivity to the Western US at certain time periods. On average, however it had too much packet loss to be included in the topology. Finally, there are a few unexpected anomalies in the topology graph. A region in France: “inria.fr” is shown as connected to the “uiuc.edu” cluster, and a US region “purdue.edu” is connected via Germany. A closer analysis of these regions has shown that although they have closer physical distance to their respective continents, during the test period they exhibited high volatility and packet loss with their respective countries. Using average figures our methodology has located these regions as connected closer to other continents.
4.5
SIMULA.NO Denmark, Sweden Finland ... 7
19
63 UIUC.EDU umich, utah,... Central US 13
61
12 28
TUM.DE France, Italy, UK Switzerland... 11
53 NYU.EDU mit,upenn... Eastern US 13
35 UCSC.EDU stanford, washington ...Western US 14
Figure 11: These subdomains are the centers of the clusters used as most common routing conduits in the overlay network. experience between each other. The nodes that we studied fell into 97 distinct domains, where domains are typically distinct institutions hosting these nodes. Just like in the earlier analysis we study inter-region paths that conform to the high quality VoIP characteristics of 150ms delay and 0.5% packet loss. Figure 13 shows the percentage of other domains that each domain is “connected” to with and without the overlay. The x-axis corresponds to individual domains sorted in increasing order of their default connectivity. These connectivity numbers are based on average characteristics over the ten day period. We specified a few of the domains on the x-axis to give a sense to the reader of how well various domains are connected. For instance “edu.cn” (Chinese University) is connected to only 2 other domains via direct route and to 44 other domains via the overlay. “rssi.ru” (a Russian region) is connected to 58 domains via default routing and to 68 domains via the overlay. It should be noted that 21 of the 97 regions have no “connectivity” to other regions either with OR without the overlay. These regions make up the left-most segment of the graph at 0% connectivity. Actually, some of these regions (that include “rnp.br” (Brazil) and “uoregon.edu”) typically have decent connections to other places. However, due to high load on the nodes in those regions they experience unusually high spikes in packet loss. On average over the ten day period this high loss contributed to over than 0.5% packet loss. For periods of times many of these regions experience much better connectivity suitable for VoIP. Interestingly, there are enough stable nodes and network links in the PlanetLab overlay that allow most other regions experience good connectivity despite oscillatory loads on many of the PlanetLab nodes. It is important to note that for a number of regions outside the US such as those inside China, Australia, Italy, and India among others the overlay makes a significant improve-
Region-based Connectivity
Ultimately, we are interested in inter-connectivity characteristics among distinct physical regions (both inside and outside the US), not just individual machines. Each PlanetLab region represents a University or a research lab that hosts several nodes. Inter-connectivity between a pair of PlanetLab regions could be representative of VoIP quality that individuals in different countries or continents could 8
ac.in
edu.au
144 inria.fr
91
edu.tw
69
ac.kr
80
98 UCSC.EDU stanford, washington ...Western US 14
uwaterloo.ca UIUC.EDU umich, utah,... Central US 13
28 97 35
12 NYU.EDU mit,upenn... Eastern US 13
edu.cn
poly.edu
25
ac.il
61 34
16 53
upc.es
63 19 SIMULA.NO Denmark, Sweden Finland ... 7
rssi.ru
15
TUM.DE France, Italy, UK Switzerland... 11
27
26 ntua.gr
31
69
forth.gr
20
ru.is purdue.edu
Figure 12: Edge domains connected to the core clusters. The core clusters are shown in a sky-blue font. Edges are color-coded to help visualize respective latencies. Latencies below 50ms are green, below 75ms yellow, below a 100ms red and the rest are blue.
9
0.8
0.7
0.7 Percentage of domain connectivity
Percentage of domain connectivity
0.8
0.6 0.5 0.4 0.3 0.2 0.1
default overlay
0.5 0.4 0.3 0.2 0.1
ac.uk nyu.edu
ucla.edu
rssi.ru
lip6.fr
edu.cn
unibo.it edu.au
0
0.6
direct overlay
0 1
4
Domains sorted by their default VoIP connectivity
0.8
0.7
0.7 Percentage of domain connectivity
0.75
0.65 0.6 0.55 0.5 0.45 0.4
direct overlay Apr 29
Apr 27
Apr 25
Apr 23
10
13
16
19
22
25
28
31
34
Figure 15: Average connectivity of US domains to all domains
0.6 0.5 0.4 0.3 0.2 0.1
May 1 2005
Percentage of domain connectivity
Figure 13: Average inter-domain connectivity at 150ms delay and 0.5% packet loss
0.35
7
US Domains sorted by their default VoIP connectivity
direct overlay
0 1
4
7
10
13
16
19
22
25
28
31
34
Non-US Domains sorted by their default VoIP connectivity
Time
Figure 14: Average inter-domain connectivity over time
Figure 16: Average connectivity of Non-US domains to all domains
ment in VoIP QoS. For instance, China’s region connectivity is improved from 2 to 44 regions with excellent VoIP characteristics, and India’s connectivity is improved from 1 to 9 regions. As China represents a significant percentage of the world population and a growing technology-savvy segment, the improvement in QoS of VoIP with China may have a very large impact on global communication. Figure 14 plots the average inter-connectivity of all the regions over time. Just like in the node inter-connectivity graph (figure 3) there are some oscillations, but there is a significant improvement with the overlay. Since we chose the best node (i.e. the most stable) in each region to determine inter-region connectivity characteristics the default inter-region connectivity is slightly better than the default node inter-connectivity. This is exemplified by a slightly higher positioning of the default curve of figure 14 than the default curve of figure 3. To test our expectations of better VoIP connectivity within the US we provide figures 15 and 16. These graphs measure average connectivity for each US and non-US domain to all other domains in our test setup. The graphs show only marginal connectivity advantage for US region. Overall the average US default connectivity is improved from 51% to 73% with an overlay. While the non-us regions are improved from 46% to 65%. One reason for only marginal difference
between the numbers for the US and non-US regions is simply the fact that many European regions have high intraconnectivity among one another just like the US regions. It should be noted that regions that have no sufficient connectivity with any of their neighbors were not included in these graphs. Perhaps the most crucial to our study is the connectivity of the regions that lie on the “edge” of the network. (Edge regions discussed in this section are those regions that were showned to be outside of the clusters in the topology graph in section 4.4). Edge regions stand to gain the most from the overlay. In fact, on average the connectivity of the “edge” regions to all regions in our network is improved from 25% to 55%. That means that on average such a region can use the overlay to more than double the number of excellent VoIP communication destinations. Figures 17 and 18 present these results with all of the edge regions listed along the x-axis. While figure 17 shows connectivity from the edge regions to all of the regions, figure 18 only focuses on connectivity from edge regions to other edge regions. The graphs picture the default route, as well as the overlays with 150ms, 200ms, and 250ms latency constraints. Note that among poorer connected edge regions there are also 2 US domains: “poly.edu” and “purdue.edu”. Although we expect that most of the time these regions will have better 10
0.5
Normalized fraction of route changes
0.8 0.7 0.6 0.5 0.4 0.3 0.2
ntua.gr
ac.il
ru.is
edu.tw
edu.au
poly.edu
uwaterloo.ca
edu.cn
cwru.edu
ac.kr
purdue.edu
ac.in
inria.fr
0
rssi.ru
0.1
upc.es
direct 150ms overlay 200ms overlay 250ms overlay forth.gr
Percentage of domain connectivity
0.9
0.45 0.4 0.35 0.3 0.25 0.2 0.15
shortest paths 1-hop max paths Apr 23
Edge regions sorted by their default VoIP connectivity
Apr 25
Apr 27
Apr 29
May 1 2005
Time
Figure 17: Average connectivity of edge regions to all domains
Figure 19: Comparing changes in routes for one hop and shortest paths routing
increase the number of node/region pairs that can support VoIP communication between them. However, selecting the best available path is not necessarily an easy task especially if the path may be subject to change. To analyze how frequently an overlay route changes, we measured the number of routes that changed for the overlay between two-hour time slices. For each two-hour time slice, we looked at how many pairs of connected nodes go through an overlay path that differs from the previous time slice. Figure 19 shows the number of such changes for the shortest path overlay and the 1-hop overlay respectively normalized by the total number of VoIP-connected nodes in that particular time slice. The measurements show that the best path in both the shortest-path and 1-hop overlays changes over time for a substantial number of nodes. Since the shortest path overlay has more intermediate hops, it is of course much more likely to have path changes than the one-hop path as demonstrated in the figure. For the 1-hop overlay, on average 24% of connected pairs change their intermediate best node! In addition to looking at the intermediate nodes we also looked at how frequently an intermediate region (i.e. the region to which the intermediate node belongs) changes. To simplify this analysis, we only considered the best paths consisting of at most one intermediate hop. Figure 20 compares the frequency of changes when considering intermediate nodes, domains, and clusters. The top curve is the plot of 1-hop intermediate node changes from Figure 19. The second curve represents the changes in domain. Routing changes that remain within a given domain would not be reflected as changes in this curve, and therefore it’s lower than the node plot. The lowest curve treats the regions belonging to one routing cluster (as in section 4.4) as one unit. The “cluster” plot does not reflect changes that keep an intermediate routing node within the same routing cluster. On average with the consideration of clusters only 17% of the the time an intermediate location changes. It is important to note that part of the reason for the changes is not just the network condition, but also the volatility of the PlanetLab nodes themselves. Nodes going down and coming back could contribute to the need of finding alternate routes. Such a behavior could still exist in any overlay especially a P2P overlay where machines are indi-
0.8 0.7 0.6 0.5 0.4 0.3
ac.il
rssi.ru
ntua.gr
upc.es
edu.au
ac.kr
cwru.edu
poly.edu
purdue.edu
inria.fr
edu.tw
ac.in
edu.cn
0
ru.is
0.1
forth.gr
direct 150ms overlay 200ms overlay 250ms overlay
0.2
uwaterloo.ca
Percentage of domain connectivity
1 0.9
Edge regions sorted by their default VoIP connectivity
Figure 18: Average connectivity of edge regions to other edge regions connectivity with the core, they exhibited high volatility during our period of measurements. We proceed to make several observations. First, the improvement in figure 18 (the inter-edge graph) is even more dramatic as the average connectivity improves from 15% to 40% of overall edge regions. Second, for many of the regions where the ideal VoIP quality is not possible, an overlay with a higher delay constraint can often be used. Overlay with 200ms improves inter-connectivity to over 70% in both graphs. And in the case of India, for example, the 250ms overlay allows it improve its connectivity from 0 to more than 80% of the regions. This is an important conclusion as a slightly worse but cheap service can become very successful especially in poorer countries. In general, however, observe that the 250ms overlay graph closely hugs the 200ms overlay graph which implies that beyond a certain threshold the “connectedness” of regions cannot be improved much just by allowing higher latencies. Finally, even US regions such as “poly.edu” and “purdue.edu” that we expect to have better connectivity but may suffer from last-mile effects could also be assisted by the overlay.
4.6
Motivating Adaptive Methods
From the analysis conducted so far, it is clear that using PlanetLab nodes as an overlay network can significantly 11
to an overlay solution for VoIP across this large network. In our testbed of 224 nodes and 97 regions we found that the average inter-connectivity of nodes with ideal VoIP characteristics can be improved from 32% to 54% with an overlay. Excluding nodes that with extremely poor connectivity the average inter-connectivity improves from 38% to 68%. Furthermore, we found that for many more pairs of nodes the overlay can improve the level of service even though it would be of a slightly inferior quality. In particular, if we allow 300ms delay and 2% packet loss the number of VoIPenabled pairs increases from 54% to 81%. We also showed, that even when using a less constraining overlay of one intermediate hop the improvement closely approximates that of a shortest paths overlay. Perhaps the numbers are even more insightful for many of the edge regions that are further removed from the major routing points on the Internet.. We found that specifically for such geographical regions the ideal VoIP connectivity is improved from 25% to 55% or more than double. Finally, we showed that in a large distributed environment such as PlanetLab best routes could be changing frequently and dynamically. This is partially due to changing network conditions and partially due to volatility of individually hosted nodes. Therefore, we motivate our future work of designing and evaluating efficient adaptive algorithms to discover best routing paths.
Normalized fraction of route changes
0.4
0.35
0.3
0.25
0.2
0.15
0.1
nodes domains clusters Apr 23
Apr 25
Apr 27
Apr 29
May 1 2005
Time
Figure 20: Changes in intermediate nodes for one hop routing vidually managed. One way to discover shortests paths in a delay graph is to collect all of the RTT information in a centralized location, identify the best paths, and then distribute this information throughout the RON. Such a solution might be reasonable for a small RON containing only a few nodes. However, for a RON with hundreds or more nodes, where changing information needs to be collected and distributed rapidly such an approach does not scale. To make matters worse, if there is a disruption in the communication in some area of the Internet then the updated information will be delayed on its path to the central site and back, further delaying the needed rerouting. In the next step of this research we intend to implement adoptive routing in RON. In the adaptive scheme each node continually collects statistics abouts its RTT to other nodes in the RON and identifies which paths have a good direct connection to it. Further, each node collects from the nodes to which it has good connections information about their good connections. This way the information about shortest paths propagates through the network in a way similar to the updating of routing tables in the standard internet routing protocol. The problem that remains is how to balance the communication that is used in order to probe the network connectivity with the application communication that the network is meant to carry. The application communication would benefit from the probing communication because it would lead it to be sent on better paths. On the other hand, too much probing communication would compete with the useful communication for the limited bandwidth resources. This problem is an instance of a well known problem in adaptivity called the “multiple arm bandit problem” in which a gambler aims to balance exploration with exploitation. We plan to use the algorithms suggested in [17] in the distributed adaptive routing scheme. That is the next step of our work on using RONs for improving VoIP QoS on the Internet.
5.
6. [1]
CONCLUSION
In our study we conducted extensive network measurements of connectivity among a large set of the PlanetLab nodes. We found suitable network properties that are amenable 12
REFERENCES
D.Andersen, H.Balakrishnan, F.Kaashoek, and R.Morris, “Resilient Overlay Networks,” in Proc. of the 18th Symposium on Operating Systems Principles, Oct 2001, pp. 131-145. [2] Y.Amir, C.Danilov, S.Goose, D.Hedqvist, A.Terzis, “1-800-Overlays: Using Overlay Networks to Improve VoIP Quality,” Technical Report CNDS-2004-2, Aug 23, 2004. [3] D.Andersen, A.Snoren, H. Balakrishnan, “Best-Path vs. Multi-Path Overlay Routing,” in Proceedings of IMC 2003, Oct 2003. [4] K. Gummandi, H.Madhyastha, S.Gribble, H.Levy, D.Wetherall, “Improving the Reliability of Internet Paths with One-hop Source Routing,” OSDI 2004: 183-198. [5] “The Spines Overlay Network,” www.spines.org. [6] http://www.planet-lab.org [7] http://www.emulab.net [8] L.Subramanian, I.Stoica, H.Balakrishnan, R.Katz, “OverQoS: An Overlay Based Architecture for Enhancing QoS,”, in USENIX NSDI ’04, Mar. 2004 [9] Y.Chu, S.Raom, S.Seshan, Hui Zhang, “Enabling Conferencing Applications on the Internet Using and Overlay Multicast Architecture,” in ACM SIGCOMM 2001, Aug. 2001 [10] P.Schopis, P.Calyam, “H323 traffic characterization study, OARnet Technical Report” (2002) [11] P.Calyam, M.Sridharan, W.Mandrawa and P.Schopis, “Performance Measurement and Analysis of H.323 Traffic,” Passive and Active Measurement Workshop, 2004 [12] A. Markopoulou, F.Tobagi, M.Karam, “Assessing the quality of voice communication over Internet backbones”, ACM Transactions on Networking, October 2003. [13] www.skype.com [14] www.broadvoice.com [15] www.vonage.com [16] http://www.vonage-forum.com/ftopic390.html [17] P.Auer, N.Cesa-Bianchi, Y.Freund, and R. Schapire, “The non-stochastic multi-armed bandit problem”, in Proceedings of the 36th Annual Symposium on Foundations of Computer Science, 1995. [18] I.Marsh, F.Li, G.Karlsson, “Wide Area Measurements of Voice over IP Quality”, SICS Technical Report T2003:08 (2003) [19] ITU-T Recommendation G.114 One Way Transmission Time (1996) [20] B. Kelly, “Quality of service in Internet protocol networks” (2002)
[21] Interview with Henning Schulzrinne in March 2005. [22] The Economist cover story “The meaning of free speech”, September 17th, 2005.
13