ements in the spectral distribution. One advantage of our feature-based registration is that the presence of noise in a data-cube is greatly reduced and, therefore, ...
FEATURE BASED REGISTRATION OF MULTISPECTRAL DATA-CUBES A. Broersen and R. van Liere Visualization and 3D Interfaces CWI Kruislaan 413, 1098 SJ Amsterdam, The Netherlands {a.broersen, robert.van.liere}@cwi.nl ABSTRACT Imaging spectroscopy can be used to scan the structure of chemical elements on the surface materials. Multiple threedimensional datasets are created that contain the chemical properties on each location of the scanned surface. A manual pixel-based registration method was used to align the data-cubes to create one large mosaic of data-cubes. In this paper, we present a feature-based method for the registration of multispectral data-cubes. A feature is defined as a combination of important correlated chemical elements in the spectral distribution. One advantage of our feature-based registration is that the presence of noise in a data-cube is greatly reduced and, therefore, will result in a more robust registration. Another advantage is that multiple attempts for registration can be performed using several extracted features to improve robustness. This paper describes our registration method and the conditions to indicate if extracted features contain sufficient information. We also compare the performance of our method with a pixel-based registration method.
(a)
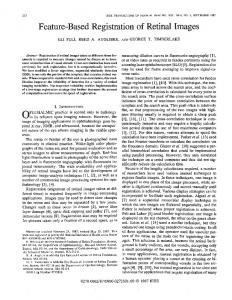
Figure 1. (a) Microscopic image and (b) spectrometric TICimage mosaic of a droplet-deposition on a silicon substrate
ure 1b is created by taking the sum of all spectral intensities on a single two-dimensional location. Instead of the black background in between the crystallized droplets in the microscopic image, the spectroscopic image provides spectra of the material in between the crystals as false color information in the TIC-image. Recently, more advanced techniques for data acquisition are able to sample a larger surface area by capturing a number of data-cubes on a higher resolution. State-of-the-art data-cube registration methods use TIC-images to create one large mosaic of data-cubes. These methods are very similar to pixel-based registration techniques found in many image processing handbooks, for instance [1]. In this paper, we present a feature-based method for the registration of multispectral data-cubes. A feature is defined to be one of the many chemical elements in the spectral distribution. Since chemical elements have a unique and known spectral profile, scientists can use spectroscopy to investigate which elements are present on the surface of a material provided their spectral profile can be extracted from the data-cube. In a previous paper, we have shown how Principle Component Analysis (PCA) can be used for extracting specific spectral profiles from multispectral datacubes [2]. In the next section, we describe the methods for selecting features from a data-cube, registering these features, adding additional weights to areas of high entropy, and the complete algorithm. Section 3 compares our feature registration method with the pixel-based method on two test collections. Finally, we conclude with a discussion of the
KEY WORDS Registration, PCA, and multispectral data-cubes
1 Introduction An imaging mass spectroscope is a device that can acquire spectral distributions of chemical elements on the surface of a material. The output of the mass spectroscope is a multispectral data-cube; a three-dimensional dataset with spatial properties of the surface in the xy-dimension and the spectral distribution of a combination of chemical elements in the z-dimension. In contrast to a volume consisting of 3D points of scalar values, a spectral dataset consists of two spatial dimensions and mass-to-charge ratio in the third dimension. Each scalar value in the volume is interpreted as the intensity on a mass-to-charge ratio at a 2D position on the surface of a material. Material scientists often refer to a spectral volumetric dataset as a multispectral data-cube. Compared to a high resolution microscopic image (see Figure 1a), a spectroscopic Total Ion Count-image (TIC-image) mosaic discloses the chemical composition of surface material on each location. This TIC-image in Fig-
541-148
(b)
543
pros and cons of our method.
2 Method Our registration method can be divided into three parts. In the first part, the data is reduced by selecting and extracting the most important features from the data-cubes using PCA. Then, by applying the mean squares metric to corresponding features in adjacent cubes, a minimalization landscape is constructed. This landscape represents the ’fit’ of the feature when two adjacent data-cubes are aligned with each other. The minima provide the regions with the most similarities. Under various conditions, however, the landscape does not provide sufficient information to robustly assume that the lowest value in the landscape is indeed the desired solution. These conditions can be described in the third step by analyzing the entropy of the landscape and by adding a weight to all of the possible solutions. The resulting algorithm in subsection 2.4 gives an overview of how a solution is found in the final search space.
2.1
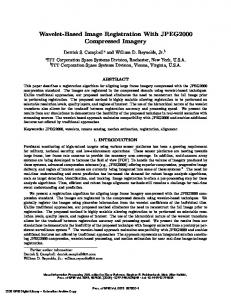
Figure 2. (a) One image component and (b) an other spectrally matching image component
similar area can be found in Figure 2b in the top left corner. The similarity between both regions could be measured using an appropriate similarity metric.
2.2
Mean Squares
Although many metrics and applications already exist for the registration of images [6, 7, 8, etc.], the most basic approach is used in this method. In most cases, there are no clear defined edges or distinguishing regions present in the resulting image components. Landmarking or region-based registration could be problematic when applied on this type of datasets. Most of these approaches use a metric to measure the difference between intensity values between two regions in two images and an optimizer to transform one of the images according to a fitness value to find a better fit. One image is called the fixed image and the image that is being transformed the moving image. Because these spectral data-cubes do not contain many spatial features and could contain some noise, the complete search space has to be considered to find a suitable minimum and a correct offset between the two images. An optimizer is no longer needed, but this is only possible when neither image is too large and -even more important- when the moving image does not need any rotational, scaling or warping transformations. The most simple pixel-based similarity measure is the Mean Squares (MS) measure. The mean squared pixelwise difference is calculated using Equation 2 in which A is a region in the fixed image, B a region in the moving image, N the number of pixels in these regions and i the pixel position.
Principal Component Analysis
First, PCA is applied to the data-cubes to reduce the datacubes by preserving the most important features into a number of spectral and their corresponding image components. There are many methods for decomposing multidimensional data or dimension reduction (see [3, 4, 5]), but these are better suited for decomposing multi-dimensional data in many independent features instead of in only a few components that describe most of the information. PCA can be used to compress the thousands of image planes into a few image components. It selects correlated spectral and spatial features in the data-cubes which results in different components. When sorted, the first few components describe the most variance in the data and therefore provide the most contrast in the image components. PCA is used by unfolding a non-preprocessed λ by x by y data-cube in such a way that a 2D λ by x × y matrix X is constructed. The standard PCA model is used to compute a sorted list of principle components in an orthonormal matrix P (see Equation 1) using eigenvector decomposition. Y = P · XT
(b)
(a)
(1)
The first principle components in P describe those spatial regions in the data-cube with the greatest spectral variance. The original data-cube is projected using the principle components as bases resulting in a matrix Y with the spatial (Yimages ) or spectral (Yspectra ) score vectors. Both these matrices are extracted and combined to be able to select similar spectral components from two data-cubes. Once two similar spectral components can be found in both pieces of the same collection, the corresponding image components (see Figure 2) can be used for registration. For example, Figure 2a shows an area in yellow at the bottom left corner which contains some high intensity values. A
M S(A, B) =
N 1 X (Ai − Bi )2 N i
(2)
Linear changes in intensity between both images will result in a poor match value and poor matches result in large values of the metric. This metric is used on all subregions of two image components (on the left in Figure 3). It results in a 511x511 search space in which each point is the result of the MS metric applied to a combination of two regions. The well-known Normalized Correlation metric also uses images of the same modality. It is invariant to linear changes in intensity and it is robust to noise. Poor matches
544
(a)
(b)
Figure 4. (a) Entropy space of all regions in the image compo-
nent of Figure 2a and (b) the standard deviation fitted entropy of the same image component
Figure 3. Shifting two image components of 256x256 pixels to create a MS landscape of 511x511 pixels of each overlapping region to find the correct minimum represented by the dark colored points
created similarly and combined with the fixed entropy landscape using the entry-by-entry product of both entropy values. The resulting combined entropy landscape of the image components in Figure 2 can be found in Figure 4a. This combined entropy landscape contains some outliers, mostly located at the corners where only a few pixels are being considered. An additional fit on the histogram is made to remove unwanted outliers. This is done according to the normal distribution, by using only the mean values including the standard deviation in the histogram. The values in the histogram left of this area are set to zero and the values to the right of this area are set to the remaining maximum. The remaining landscape (see Figure 4b) is applied as a weight for the MS landscape. The black regions in entropy spaces indicate that a minimum found in the corresponding regions of the MS landscape most likely will not contain enough information to be considered as a solution. The final weighted search space can be created by dividing all values in the MS landscape by the fitted entropy landscape. This results in a MS entropy search space in which a minimum has to be found. With the location of this minimum the offset of the translation between both images can be calculated with the correct registration between both image components.
result in high values of the metric with well-defined minima and sharp peaks. The metric is sensitive to clutter, occlusion and non-linear changes in contrast. It is not used in this case, because it does not perform considerably better than the MS metric on these multispectral datasets.
2.3
Entropy
Looking at the complete MS landscape on the top right in Figure 3, there are still many -black- areas with low values. This is mainly caused by the fact that the intensities in certain regions do not have enough contrast and/or a high amount of randomness and just simply do not contain enough information to accurately use the difference metric. If the subregions consist of only one pixel (at the corners of the MS landscape), it is practically impossible to find an accurate metric for the similarity. Image characteristics can provide some statistical information about the information in an image (see [9]). They can give an indication of fitness of a complete image of a region in an image relative to the other image regions. This characteristic can be used to provide a weight for the MS landscape and create a more realistic search space in order to find the most appropriate minimum. Some commonly used image characteristics are contrast, correlation, energy and homogeneity, but in this context the measure for entropy in [10] is the most suitable to act as a weight. It provides an indication of the ’randomness’ of intensities in an image using its histogram. The entropy H of each region in one image component is calculated using Equation 3, in which A is the region in an image component and Ap the histogram values of A. H(A) = −
X
pA · log pA
2.4
Algorithm
With the use of the previously described methods a PCAbased registration algorithm was created to find the correct offset between two data-cubes, if such an offset exists. If more similar spectral components are present, more minMS search spaces can be compared in order ima in the entropy to find the correct offset. 1. PCA on two data-cubes from one collection of measurements which results in a decomposition of each data-cube with a number of corresponding spectral and image components. 2. Select matching spectral components of both datacubes by comparing of spectral peaks, starting from the components describing the most variance. 3. Registration of the corresponding selected image components from both data-cubes by creating a mean
(3)
The entropy of each region of the fixed image component can be calculated and put into a landscape corresponding with the MS landscape from Figure 3. The entropy landscape of the moving image component can be
545
(a)
acid (DHB), a compound which is widely used as matrix material in matrix-assisted mass spectrometry techniques. Measurements were done using imaging Secondary Ion Mass Spectrometry (SIMS) in microprobe mode (see [11]) on a Physical Electronics TRIFT-2 time of flight mass spectrometer. Each imaged area was 200x200 µm2 . The high abundance of DHB results in distinct peaks in the massspectrum. The low total signal intensity in one of the corners of each of the images is due to inaccurate alignment of the primary ion beam. Another dataset shows a mosaic of the kneecap of a mouse which contains 85 data-cubes recorded with the same mass spectrometry technique as the droplet decomposition. Only a small part of only five data-cubes (see Figure 5b) was taken from the complete collection in this first approach to test this new registration method. In contrast to the crystals dataset there are some data-cubes that do not have an overlap with one of the other cubes in the dataset. There is no overlap between the three combinations: A-E, B-E and B-D in Figure 5b. Both collections of four and five data-cubes are used to compare a traditional TIC-based registration with the PCA-based registration.
(b)
Figure 5. The relative locations of (a) four pieces of the crystal dataset and (b) five pieces of the kneecap dataset
4.
5.
6.
7.
squares landscape of all possible combinations of regions in the image components. Add a weight function to the MS landscape using an entropy image characteristic applied to each region of both the image components to exclude regions that contain not enough spatial information to be considered as a solution. Select the lowest points in the first five regions with loMS search space in such a way cal minima in the entropy that a selection of points remains that are the most appropriate solutions for a correct registration. Repeat step 2 to 5 for the next two corresponding spectral components from the PCA decomposition of both data-cubes in order to get two sets of points that could be solutions for a correct registration. If present, select that point in both selections of appropriate solutions, with the lowest value to find the best solution for a registration. If there is no such point, no suitable offset between both data-cubes can be found.
3.2
Since there has not yet been an attempt to register imaging mass spectrometry data-cubes automatically, the TICimages are used in a manual approach to stitch different spectral image planes. These images are constructed by taking the summation of all image planes of the multispectral data-cubes. Each combination of these resulting images can be registered with each other using the same MS entropy metric which is used in the PCA-based approach to be able to quantitatively compare both approaches. The crystal dataset consists of four data-cubes resulting in six combinations, in which there is an overlap with every other data-cube. The kneecap dataset consists of five data-cubes resulting in ten combinations, in which seven combinations do have an overlap and three of them do not. The results of this registration can be found in the next subsection. All combinations in each dataset are being registered using this new PCA-based method. First, a PCA is conducted on each data-cube using the algorithm from subsection 2.4. Similar spectral components are being matched and each corresponding image component (see Figure 2) is used for the registration. This results in several MS landscapes (see Figure 6) for each matching spectral component in which minima have to be found to get a most appropriate solution for a registration. The entropy space (see Figure 4) of each component MS search image is calculated and combined into the entropy space to add a weight to the solutions according to the amount of information that is present in each region. FigMS search space of the first specure 7a shows the entropy trally matched components of two data-cubes. And FigMS search space of the next specure 7b shows the entropy trally matched components of the same two data-cubes.
This algorithm can be applied on each combination of multispectral data-cubes in a collection of measurements. Two datasets are used in the next section to compare this PCAbased algorithm with a traditional approach.
3 Application The constructed algorithm is applied on two collections of multispectral data-cubes resulting from imaging mass spectrometry. These data-cubes have two spatial dimensions (256x256 pixels) and one spectral dimension (more than 3000 image planes) with a mass-to-charge ratio which provides information about the chemical elements on each two-dimensional location.
3.1
Registration
Two collections
One dataset of four overlapping data-cubes (see Figure 5a for their relative positions) is a measurement of an array of crystals as shown in Figure 1. They were produced from an aqueous solution by droplet-deposition on a silicon substrate. The crystals consist mainly of dihydroxybenzoic
546
PCA-based correct fit incorrect fit (a)
array of crystals found not-found 5 1 -
kneecap of a mouse found not found 5-1 2 3 0
Table 2. Summary of the results from the PCA-based approach
(b)
Figure 6. Mean Squares landscape from comparing the (a) first
The white regions in both images are caused by the entropy weight. The overlapping regions in these white areas do not relatively contain enough intensity information to be considered in the solution. Both landscapes do have a global minimum on the same location which should be the best solution for the translational offset between both datacubes. The same procedure is applied on all other possible combinations to find those offsets or dismiss the combination if there is no joint local minimum in both search spaces and therefore not an overlap of regions.
were only two correct offsets successfully found within the MS kneecap dataset using the global minimum in the entropy search space in this TIC-based approach. There was no indication available in the TIC-based approach whether or not the global minimum would result in an incorrect fit or not. This is the reason why the three incorrect fits of the kneecap dataset were put in the ’not found’ column. Table 2 contains the corresponding results with PCAbased registration. All but one of the correct offsets between the six combinations of the crystal dataset could be found. In some cases there was only one pair of spectral components that gave a match in a combination of datacubes. The reason is probably that there was not enough similar information present to find more than one match of spectral components that had a comparable contribution to the complete data-cube. In those cases only the found MS search space was used and its global match and its entropy minimum was considered as a solution. The three combinations in the kneecap dataset without any overlap were correctly found as indicated in the row with the ’incorrect fit’. Two offsets that did exist could unfortunately not be found. This was caused by the lack of entropy in regions that should provide for a correct fit. The remaining four of six existing offsets were found and one was found, but was incorrect. This solution was found by comparing two regions without much intensity information. The joint entropy was not low enough to dismiss it as a possible solution.
3.3
4 Conclusion
and the (b) second principal component of C and E of the kneecap dataset in which the location of the correct solution for the registration is marked
(b)
(a)
MS search space of the (a) first principal comFigure 7. entropy ponent and the (b) second principal component with the possible solutions in the blue color
Results
The results of the six combinations of TIC-based registration of the crystal dataset together with the ten combinations of the kneecap dataset are presented in Table 1. None of the correct offsets between the six combinations in the crystals dataset could be found using the TICbased approach as shown in the row with the ’global fit’. MS search space could be considered for each Only one entropy combination of data-cubes. So the global minimum in the search space was used as a solution for a best fit. There TIC-based global fit incorrect fit
array of crystals found not-found 0 6 -
The results show that the PCA-based approach for the registration of a collection of multispectral data-cubes is superior to a traditional TIC-based method. Pixel-based registration of selected image components using the MS metric with a complete coverage of the search space and an additional entropy weighting is able to correctly register two data-cubes if a solution exists. We can find a more robust solution with the multiple minima from the landscapes of several extracted features instead of using only one pair of images. Some remarks can be made about the metrics used in this method with the possibility to improve and/or optimize the algorithm.
kneecap of a mouse found not found 2 5 0 3
4.1
Discussion
There was only one case in the kneecap dataset in which the solution found by the algorithm was incorrect. This
Table 1. Summary of the results from the TIC-based approach
547
the accuracy of the PCA too, because this method is based on the spectral and spatial correlations in the dataset. The accuracy of the final analysis and visualization of the spatial distribution of chemical elements would be greatly improved, once these data-cubes can be fused successfully.
was mainly caused by the fact that the overlapping regions with the found minimum did not contain enough intensity information. Unfortunately, the entropy did not contribute enough as a weight to eliminate it as a solution in MS search space. However one mistake out of ten the entropy combinations is not a serious problem when the complete mosaic has to be constructed. With the joint contributions of all correct solutions, it is not hard to find the correct location of the data-cube in the mosaic. Besides the advantage of directly registering the important features with this PCA-based approach, more search spaces are available in one combination of data-cubes. In those cases where no match could be found between spectral components of two data-cubes or that the correct solution could not be found, the algorithm still does not produce an ambiguous solution, because it is able to use more search spaces. Generally said, it does not have to be a problem if some of the offsets can not be found, if there is enough certainty about the ones that are found. With the TIC-based approach, there is no alterMS search native but to use the global minimum in the entropy space. The MS metric was not able to find an unambiguous offset to register the TIC-images, while they can be found with the PCA-based approach. So even if some of the datacubes do not have much overlap or useful spatial features in those overlapping regions, it is still possible to create a MS search space complete mosaic when the complete entropy is used.
4.2
Acknowledgements We would like to thank MSc. L.A. Klerk, Drs. A.F.M. Altelaar and Prof.Dr.Ing. R.M.A. Heeren from the Institute for Atomic and Molecular Physics (AMOLF) who prepared and supplied the spectral datasets that were used for the given examples. This work was carried out in the context of the Virtual Laboratory for e-Science project (www.vl-e.nl). This project is supported by a BSIK grant from the Dutch Ministry of Education, Culture and Science (OC&W) and is part of the ICT innovation program of the Ministry of Economic Affairs (EZ).
References [1] L. Ibanez & W. Schroeder, ITK software guide, chap. 8 (USA:Kitware, Inc., 2003). [2] A. Broersen & R. van Liere, Transfer functions for imaging spectroscopy data using principle component analysis, Proc. Eurographics / IEEE VGTC Symposium on Visualization, Leeds, UK, 2005, 117-123. [3] R.A. Harshman, Foundations of the PARAFAC procedure: Models and conditions for an explanatory multimodal factor analysis, UCLA Working Papers in Phonetics, 16, 1970, 1-84. [4] J.D. Carroll, & J.J. Chang, Analysis of Individual Differences in Multidimensional scaling via an N-way generalization of Eckart-Young decomposition Psychometrika, 35, 1970, 283-319. [5] J. le Moigne, Multi-Sensor Image Registration, Fusion and Dimension Reduction, Online Journal of Space Communication, 3, 2002. [6] L. Fonseca, & M. Costa, Automatic registration of satellite images, Proc. Brazilian Symposium on Graphic Computation and Image Processing, 1997, 219-226. [7] V. Rankov, R. Locke, R. Edens, P. Barber, & B. Vojnovic, An algorithm for image stitching and blending, Proc. of SPIE, 5701, 2005, 190-199. [8] B. Zitova, & J. Flusser, Image registration methods: a survey, Image and Vision Computing, 21, 2003, 977-1000. [9] R. Gonzalez, R. Woods, & S. Eddins, Digital image processing using MATLAB (Prentice Hall, 2003). [10] P. Chalermwat, High performance automatic image registration for remote sensing (Fairfax, Virginia:George Mason University, 1999). [11] L. van Vaeck, A. Adriaens, & R. Gijbels, Static secondary ion mass spectrometry (S-SIMS) Part 1: methodology and structural interpretation, Mass Spectrometry Reviews, 18, 1999, 1-47.
Future work
The presented algorithm could be tuned by changing the registration metric using, for instance, reciprocal square differences, wavelets or the different implementations of mutual information. Some -combinations of- other image characteristics acting as a weight like a gradient-based metric or maybe a variogram-based approach may create some improvement in certain cases. These are more computationally intensive than the currently used metric. For accuracy, it is desirable to use each combination of data-cubes by the creation of the mosaic. The use of many complex metrics may improve the results, but they slow down the process significantly when using larger collections. The next step for solving this problem of creating a mosaic is applying the algorithm to larger collections and investigating if some optimizations are needed. Image-pyramids are commonly used to reduce the search space and to reduce the computations. Once the correct offset is found in a low resolution image, this offset could be refined using subpixel interpolation. After successfully finding the correct offset between two data-cubes, the two datasets can be fused together. The PCA-based registration algorithm can be applied to the fused and remaining pieces in the collection to have a more accurate solution. The process of creating fused multispectral data is outside the scope of this paper, but will be an interesting optimization to enhance spatial information. Having more fused spectral information will improve
548