Journal of Contaminant Hydrology xxx (xxxx) xxx–xxx
Contents lists available at ScienceDirect
Journal of Contaminant Hydrology journal homepage: www.elsevier.com/locate/jconhyd
Field demonstration of foam injection to confine a chlorinated solvent source zone ⁎
Clément Portoisa,b, , Elyess Essouayeda, Michael D. Annablec, Nathalie Guiserixb, Antoine Joubertd, Olivier Atteiaa a
Bordeaux INP ENSEGID, University of Bordeaux Montaigne, EA 4592 Georessources et Environnement, Carnot ISIFoR, 1 Allée Daguin, Pessac 33 600, France Renault SAS, 1 Allée du Golf, Guyancourt 78 280, France c Department of Environmental Engineering Sciences, University of Florida, Gainesville, FL 32611, USA d SERPOL, 2 chemin du Génie, Vénissieux 69 633, France b
A R T I C LE I N FO
A B S T R A C T
Keywords: Foam Groundwater Chlorinated solvents In situ DNAPL containment
A novel approach using foam to manage hazardous waste was successfully demonstrated under active site conditions. The purpose of the foam was to divert groundwater flow, that would normally enter the source zone area, to reduce dissolved contaminant release to the aquifer. During the demonstration, foam was pre generated and directly injected surrounding the chlorinated solvent source zone. Despite the constraints related to the industrial activities and non-optimal position of the injection points, the applicability and effectiveness of the approach have been highlighted using multiple metrics. A combination of measurements and modelling allowed definition of the foam extent surrounding each injection point, and this appears to be the critical metric to define the success of the foam injection approach. Information on the transport of chlorinated solvents in groundwater showed a decrease of contaminant flux by a factor of 4.4 downstream of the confined area. The effective permeability reduction was maintained over a period of three months. The successful containment provides evidence for consideration of the use of foam to improve traditional flushing techniques, by increasing the targeting of contaminants by remedial agents.
1. Introduction
candidate for mobility control to support remedial goals. Foam was originally used for Enhanced Oil Recovery (EOR). Surfactant stabilized lamellae are responsible of trapping gas in a discontinuous form by the creation of fine bubbles (Bikerman, 1973). Foam is defined as “strong”, if gas bubbles occupy all of the pore space, while it is “weak” if some gas channels exist (Rossen, 1996; Schramm, 1994). One of the benefits of using foam in Environmental Remediation (ER) is its ability to act as a selective permeability reduction agent (Bertin et al., 1999; Kovscek and Bertin, 2003). Bertin et al. (2017) demonstrated in 2D laboratory pilot tests that foam is generated in the high-permeability layer and subsequently diverts flow towards the lowpermeability region. Using a tracer test, Bertin et al. (2017) demonstrated that the generation of foam into porous media leads to the reduction of the hydraulic conductivity where the foam is in place. This process was also confirmed by Singh and Mohanty (2017). A field demonstration of the foam ER process was successfully conducted by Hirasaki et al. (1997) where foam was used to block high permeability zones to divert the subsequent surfactant flushing into low permeability zones to improve the recovery of trapped DNAPLs.
Contamination of soil and groundwater by Dense Non-Aqueous Phase Liquids (DNAPLs) remains a major challenge for site managers. Extensive research has been carried out, highlighting the inherent difficulties of removing DNAPLs from heterogeneous aquifers. Traditional flushing techniques, or pump and treat, suffer limitations with respect to removing contaminant due to the chemical properties of DNAPLs (low solubility, high density, high/low viscosity) and the aquifer configuration (i.e. heterogeneity). In heterogeneous aquifers, liquids used for remediation tend to flow through the most permeable layers and residual DNAPLs can often remain tapped in low permeability zones. Mobility control has emerged as a promising alternative technique to enhance the recovery of DNAPLs by using a low mobility agent (i.e. high viscosity) such as polymers (Giese and Powers, 2002; Martel et al., 1998, 2004; Robert et al., 2006) or surfactant-foam (Hirasaki et al., 1997; Longpré-Girard et al., 2016; Maire et al., 2015; Maire and FatinRouge, 2017; Rothmel et al., 1998; Wang and Mulligan, 2004) to improve the sweep efficiency in aquifers. Foam appears as a suitable
⁎ Corresponding author at: Bordeaux INP ENSEGID, University of Bordeaux Montaigne, EA 4592 Georessources et Environnement, Carnot ISIFoR, 1 Allée Daguin, Pessac 33 600, France. E-mail address:
[email protected] (C. Portois).
https://doi.org/10.1016/j.jconhyd.2018.04.003 Received 22 December 2017; Received in revised form 20 March 2018; Accepted 26 April 2018 0169-7722/ © 2018 Elsevier B.V. All rights reserved.
Please cite this article as: Portois, C., Journal of Contaminant Hydrology (2018), https://doi.org/10.1016/j.jconhyd.2018.04.003
Journal of Contaminant Hydrology xxx (xxxx) xxx–xxx
C. Portois et al.
Hirasaki et al. selected an optimal field site to demonstrate foam effectiveness (Hill Air Force Base (Utah), OU2 site). At the OU2 site, DNAPL was located in a buried channel incised into the underlying aquitard, that provided favourable conditions to propagate foam. These authors however did not assess the radius of influence of the injected foam. The objective of the present study was to use foam as a blocking agent to confine a source zone of chlorinated solvents (mainly Trichloroethylene (TCE)). The blocking ability of foam was used to divert groundwater flow around the source zone area. The second objective was to present tools to assess the foam extent and the reduction of contaminants moving into the aquifer.
Quaternary aquifer is also confined at the top in the source zone area, with the exception of the region near piezometer 133. These characteristics allowed for the use of foam in the aquifer. 2.2. Foam characterisation Initial laboratory experiments consisted of a series of foam floods in a 1D column where foam was pre generated before flowing through a 10 Darcy homogeneous sand (grain diameter ranged from 0.25 to 0.50 mm) (Table S1). The aim of this series of measurements was to define parameters leading to the generation of a strong foam in order to increase the efficiency of liquid displacement. The impact on foam generation of surfactant concentration, foam quality (which is the ratio between air and water flow rate) and fluid flow rates were investigated in order to select suitable conditions to generate strong foam (Kam and Rossen, 2003; Gauglitz et al., 2002). The setup used for the 1D column experiments comprised a 12 cm long, 3,5 cm diameter homogeneous sandpack. A syringe pump and a Bronkhorst EL-FLOW F-201CV gas flow controller was used to inject surfactant solution and gas into the system respectively. During the injection process, the foam’s effectiveness was determined by monitoring the pressure drop over the sandpack using Idroscan© AEP transducers. The pressure drop results are given as resistance factors (RF) which is the ratio of the steady state pressure drop during the period of foam injection compared to that obtained during a single phase waterflood at the same flow rate. Higher RF implies a more effective foam. Liquid production and residual water saturation were calculated by weighting the column.
2. Material and methods 2.1. Site characterization The study site is an active factory of 26 ha where several contaminants (chlorinated solvents, BTEX, mineral oil) have been found in soil and groundwater. The study is focused on one specific contamination event around 1980 from a storage tank containing TCE. Since 2013, given the apparent complexity of the system, iterative modelling and well drilling was conducted to target the source zone and design the foam injection. The location of wells was driven by constrains typical of an active industrial site such as machinery, work areas or various underground networks (mainly electrical). The identified DNAPL source zone is located in the Quaternary aquifer (Fig. S1). Soil and water analyses combined with hydrogeological modelling helped to approximately delineate the extent of the TCE source zone. Using pumping and slug tests, the hydraulic conductivity field was determined prior to foam injection. Heterogeneities were observed visually by analysing drilling cuttings and was observed through hydraulic conductivity measurements to vary by more than one order of magnitude (Fig. 1). Darcy flux in the study zone ranged from 5 to 15 cm/day. Two dominant clay layer zones were identified by modelling using piezometers 128, 125, 129 and 114. Injection of foam in low permeability zones requires higher injection pressures and also risks soil heaving and soil fracturing (Gauglitz et al., 2002; Khatib et al., 1988). Based on these concerns, we choose to inject foam to surround the source zone by only injecting in the relatively high permeability zones. The Quaternary aquifer lies on an impervious aquitard in the injection area. Transfer of groundwater/contaminant between the Quaternary and Tertiary aquifers is avoided in this area. Moreover the
RF =
∇p foam ∇p water
observed at the same flow rate
Then, a Darcy experiment was conducted by injecting pressurized water (between 0.6 and 1.2 bar in relative pressure) to measure the relative permeability to water in the two phase system, foam-water. Scaling to the water flood experiment in a saturated column allowed calculation of krw. 2.3. Design of injection The injection wells drilled for this study (126, 127, 130, 131, 132, 133) had an inside diameter of 80 mm with a stainless steel casing. Injection wells were 7.5 m deep and screened over a height of 2 m corresponding to the thickness of the targeted aquifer. To avoid air leaks to the surface, each injection well was isolated using bentonite
Fig. 1. (Left) Piezometer network, injection points were 126, 127, 130, 131, 132, 133), (right) Initial hydraulic conductivity field (m·s−1).
2
Journal of Contaminant Hydrology xxx (xxxx) xxx–xxx
C. Portois et al.
To support interpretation of the results, we developed a 2D groundwater flow model using the numerical model MODFLOW-2000 (Harbaugh et al., 2000). The model extent was 100 m length and 100 m width. Grid size resolution was locally refined near well 38, to reach a cell size equal to the diameter of the pumping well. To represent the foam in the aquifer, we positioned different hydraulic conductivity zones with a given K and storage coefficient S around the injection wells. The size and position of the zones as well as the values of K and S were varied in order to simultaneously fit all of the monitored drawdown curves. This was done manually since several tests for automatic fitting were unsuccessful.
sealing over 2 m above the screen and a steel lid at the surface. Lids were modified to allow recording of the injection pressure and to allow injection of foam. In the surfactant selection process, the site management required the use of a biodegradable surfactant. Additionally, the surfactant was selected to render the remediation economically feasible. Based on laboratory results and krw reduction, a surfactant mixture of Sodium Laureth Sulfate, Cocamidopropyl betain and Lauryl Glucoside were selected. These surfactants were commonly tested separately in the literature (Gauglitz et al., 2002; Ma et al., 2012; Maire et al., 2015) because of the good foaming performance, the biodegradability of the mixture and the relative low cost for large amounts of product. To avoid solubilisation and mobilization of chlorinated solvents or wasting too much surfactant in high hydraulic conductivity zones (Renkema and Rossen, 2007), no pre saturation of the aquifer with surfactant solution was performed. In order to limit the size and cost of the injection material a single foam generator was connected to two injection wells (Fig. S2: Injection line IL1 for wells 127 and 131: Injection line IL2 for wells 130, 133; Injection line IL3 for wells 126 and 132). Based on the water flow rate and the surfactant mass injected into the delivery line, the surfactant concentration delivered in wells was easily calculated. This configuration permitted regulation of the surfactant concentration to increase the foaming performance with regard to the injection pressure (Fig. S2). In other words, if the pressure was too low, we could increase the surfactant concentration to enhanced foaming performance. During the process, the surfactant concentration was maintained over a range of 0.3–0.9 wt% (4 to 14 times the Critical Micellar Concentration CMC of CAPB) and a foam quality ranging from 95% to 99% (based on laboratory experiments). Air was supplied by an air compressor and air pressure and gas flow rates were regulated by the operator. The air flow rate and liquid flow rate (with dissolved surfactant) were recorded and displayed in terms of fluxes at atmospheric pressure. Foam quality was established by using the air flow and water flow controllers. Relative pressure was continually recorded in each well with pressure transducers (AEP transducers©).
2.4.3. Targeted sampler The targeted samplers used in this study, and presented in Fig. 2, were developed by InnovaSol for low hydraulic conductivity settings. The tools provide three windows for sampling groundwater, each separated by small packers. During sampling (before the foam injection and 3 months after the foam injection), all pumps were simultaneously activated to extract water from each horizontal layer to avoid communication between the filter pack of the piezometer and each layer. 2.4.4. Passive flux meter The Passive Flux Meter (PFM) was developed by Hatfield et al. (2004) to measure contaminant and groundwater fluxes in the saturated zone. Fields tests have demonstrated the use of this tools for measuring groundwater and chlorinated solvents fluxes (Annable et al., 2005; Basu et al., 2006). Calculating groundwater and contaminant fluxes requires the evaluation of the mass fraction of resident tracers lost and the mass of contaminant sorbed on activated carbon. Extraction of organic constituents (following Annable et al. (2005)) were performed and analysis were carried out using GC-MS.
2.4. Performance evaluation Several test were conducted at different times before and after the foam injection: immediately after the foam injection (t1), 1 month after foam injection (t + 1m), and 3 months after foam injection (t + 3m). 2.4.1. Slug tests Slug tests are often used to determine the hydraulic conductivity surrounding a well. Slug tests were performed before and after foam injection (t1 and t + 3m) in order to evaluate the efficiency of foam in the immediate vicinity of the injection well. The slug tests conducted were mechanical using a low volume of water (2–5 L) in order to observe an instantaneous change. The water level changes during the test were monitored using a pressure transducer placed at the bottom of the well. Drawdown curves for each well were analysed using the Bouwer and Rice (1976) solution (Bouwer, 1989) to calculate the hydraulic conductivity, K. 2.4.2. Pumping test In order to define the radius of foam influence, a pumping test was conducted 1 month after foam injection (t + 1m). Well 38, located in the centre of the designed foam injection zone, was selected for pumping. Drawdowns were monitored using pressure transducers placed at the bottom of wells 38, 126, 127, 128, 130, 131, 132, 133 and confirmed by manual measurement. Caution was taken to prevent displacement of the pressure sensor over the duration of the pump test and the extraction flow rate was continuously measured.
Fig. 2. Schematic of the targeted sampler. The targeted sampler provides three water sampling zones separated by packers.
3
Journal of Contaminant Hydrology xxx (xxxx) xxx–xxx
C. Portois et al.
Fig. 3. Pressure (bar) and flow rates histories (L/min) over the time (hours) during the foam injection in six wells. On the top graph, air flow rate was regulated (i) to enhanced foam generation and (ii) to avoid high pressure due to safety concerns. On the bottom graph, characteristic behaviour of foam in porous media such as generation and propagation are isolated.
Wells 117, 118, 134 and 135, located downstream of the predicted foam blocked area, were selected as monitoring wells to measure fluxes before and after foam injection in order to characterize flux changes. PFMs were deployed for a period of 15 days prior to the foam injection based on the expected groundwater velocity at the site. Based on groundwater velocity calculated in the first campaign, we installed PFMs 3 months later (t + 3m) during a 28 day period in order to observe the reduction of fluxes downstream of the foam confined area. PFM concentration results were compared to traditional groundwater sampling and analysis (targeted sampler method).
Table 1 Calculated hydraulic conductivity over the time. Piezometer
127 130 131 133
Hydraulic conductivity (m·s−1)/(Reduction factor) Initial
Right after foam injection (t1)
3 months later (t + 3m)
5,63E-05 2,32E-05 4,94E-05 1,57E-05
– – 3,59E-07/(137) 1,44E-07/(109)
1,17E-06/(48) 1,37E-06/(17) – 6,15E-07/(25)
4
Journal of Contaminant Hydrology xxx (xxxx) xxx–xxx
C. Portois et al.
3. Results and discussion
At 67 h, the surfactant tank was empty leading to the injection of only air and water into the aquifer. This event can be seen on the pressure record with a drop in all the injection pathways. Then the injection was shut down for 30 min. Based on the injection pressure record, we fixed the air flow rate, water flow rate and surfactant concentration to:
3.1. Laboratory columns In order to select a strong foam, several tests were conducted in the column by changing the concentration of surfactant. Two trends were observed, increasing surfactant concentration implies higher RF, until reaching a plateau at 0.6–0.75 wt% with a RF equal to 38 (foam quality (Fq) was set at 99%). Based on these results, foam was injected into a sand column (Fq = 95%, Total flow rate Qt = 10 mL/min and surfactant concentration = 0,75 wt%) and residual water saturations were measured at Sw = 0.17 after 5 pore volume (PV) of foam injection. Darcy experiments were conducted following foam flooding and showed a reduction of the foam krw by 3 orders of magnitude (krw = 0.0015 for Sw = 0.23 after the water injection test). Strong foams are needed to enhance fluid displacement, but pressure constrains are an important factor in order to avoid soil heaving and fracturing. The above cited experiments suggest that field injection could be realized with the following specifications: concentration range 0.3–0.9 wt% and foam quality range from 95% to 99%.
1- Avoid high pressure, because the design of the injection was built in order to inject below 3 bar, by reducing flow rates. For instance, at 47 h, on IL1 the pressure reached 3 bar (Fig. 3). We decreased air flow rate from 35 L/min to 12 L/min. Water flow rate was also decreased from 0.35 L/min to 0.07 L/min. 2- Increase the injection pressure to generate a strong foam by increasing flow rates and surfactant concentration. On IL2, to satisfy the generation of a strong foam we increased the surfactant concentration (at 9 h) and total flow rates (at 48 h). In each case, this change was followed by a significant increase in pressure. The first indication of the foaming performance is the increase of the injection pressure in all injection lines. For IL2, injection pressure increased during the first 12 h before reaching a maximum of 2.55 bar. Subsequently, the pressure stabilized around 1.8–1.9 bar until the end of the injection period.
3.2. Pressure and rate histories during field injection The field site injection pressure, air and water flow rates are provided in Fig. 3. Foam injection was performed continually during a 96 h period. The first 24 h allowed the injection system to be established and ensure the validity of the injected flows and to regulate the system so that it operates independently.
3.3. Injected volume Based on the air and water flow at atmospheric pressure, the foam volume injected into piezometers can be approximated. Assuming that for a given injection line, all air is transformed to foam and that foam is
Fig. 4. Drawdown (y-axis expressed in meter above sea level m.a.s.l.) curves for the eight monitoring wells during the pump test (x-axis expressed in hour) after foam injection. Crosses represent measured data and continuous lines the fitted model. 5
Journal of Contaminant Hydrology xxx (xxxx) xxx–xxx
C. Portois et al.
information about the foam radius of influence. 3.5. Pumping test The first modelling step was to fit the observed drawdowns at the pumping well (38) and monitoring wells (126, 127, 128, 130, 131, 132, 133) using an initial hydraulic conductivity field (pre-foam injection). The model provided a good reproduction of the drawdown when using an average hydraulic conductivity of 1.6 × 10⁻⁴ m·s−1 and a classical value for the storage coefficient (10−4). Following foam injection, the heads observed at the foam injection wells required significantly different values of both hydraulic conductivity and storage coefficient due to the presence of foam. We thus established a low hydraulic conductivity zone to define the influence of foam and its propagation within the aquifer for a zone around each injection well. The estimated radius of those zones were first input considering the injected foam volume. However, in order to reproduce the drawdown curves it was necessary to individually fit the diameter of the foam zone for each injection well. Indeed, a sensitivity analysis (Fig. S4) showed that the shape of the drawdown curve was mainly related to the diameter and position of the foam zone while only the maximum drawdown was linked to the hydraulic conductivity and storage coefficient (Fig. 4). Due to this sensitivity, and the interactions of foam zones as they blocked a part of the flow, automated parameter estimation (Hydraulic conductivity K, storage coefficient S and foam size and position) through PEST was unsuccessful. The drawdown curves were quite different from what may occur in a natural aquifer, with a fast response but a very small amplitude. One well (130) shows a difference between the measured and modelled value which may be due to the presence of a very low hydraulic conductivity zone, leading to values that may not be at equilibrium with the rest of the aquifer. The fitted foam zone radii ranged between 2.0 and 3.2 m (Fig. 5). Calculated drawdowns only matched observed data when foam zones were smaller than those estimated based on injected foam volume and with a very low hydraulic conductivity value (range from 9.2 × 10⁻⁹ to 1.0 × 10¹⁰ m·s−1). The fitted storage coefficient for foam are higher than the original value in the aquifer (range between 2 × 10⁻³ and 5 × 10⁻²), which may be related to the presence of air in the foam.
Fig. 5. Hydraulic conductivity field (m·s−1) before (top) and after (bottom) foam injection. Foam zones correspond to the supplementary zones added compared to the base case (zones with black lines inside).
homogenously injected in both piezometers, a theoretical radius of foam penetration ranging from 4 to 7 m is calculated (Table S2). This calculation might be reduced due to gas segregation farther from the injection well (Rossen et al., 2010; Shi and Rossen, 1998) and due to heterogeneities (Renkema and Rossen, 2007). Shi and Rossen (1998) suggest that maintaining a high horizontal pressure gradient increases the distance from the injection well where gas segregates from the foam. Thus the calculated volume and radius may be the maximum possible based on simulations.
3.6. Passive flux meter and targeted sampler results Following methods from Annable et al. (2005), Darcy fluxes were calculated for each PFM layer. The permeability contrast between the aquifer and the PFM leads to convergent or divergent flow and were taken into account based on Strack and Haitjema (1981) equation (Annable et al., 2005; Hatfield et al., 2004). The PFM placed in a well screen induces a coefficient alpha representing the convergence of the aquifer flow due to the contrast between the hydraulic conductivity of the aquifer (range between 1·10−5 and 5·10−5 m·s−1) and the hydraulic conductivity of the PFM (5·10−3 m·s−1). Applying the convergence equation from Annable et al. (2005), Α was set equal to 2. Using the chlorinated solvent mass accumulation on each PFM layer, the deployment period and the Α coefficient provides the average mass flux of chlorinated solvents (expressed in mmol·m−2·day−1). During the sampling campaign, concentrations were also obtained with the use of targeted sampling. The fluxes for this method were calculated by multiplying these concentrations by Darcy velocity measured by PFMs. Traditional groundwater samples represent an instantaneous snapshot of the contamination, while PFM gives a temporal integration of the mass flux. Results of both PFM and targeted sampler were plotted before and after the foam injection in terms of total fluxes integrated over the thickness of the aquifer (Fig. 6) (vertical distributions are given in supplementary information (Fig. S5)).
3.4. Slug tests results The slug tests provide a quick overview of the success of the injection near the injection wells. Field observation showed that all injection piezometers were completely dry just after the end of the foam injection test. Because the recovery of water was quite long (more than 14 h to reach initial water levels for the fastest recoveries), slug tests could not be performed in piezometers 132, 126, 130, 127. Fig. S3 provides an indication of the time required to displace a given volume of water before and after foam injection. Calculated hydraulic conductivity using Bouwer and Rice (1976) solution (Bouwer, 1989) are provided in Table 1. Reduction factors of K higher than 100 were measured right after the foam injection indicating the presence of foam around the injection well. The persistence of foam was characterized by slug test measurements after 3 months with a K reduction over 10. These measurements show the local efficiency of the foam injection but do not provide
6
Journal of Contaminant Hydrology xxx (xxxx) xxx–xxx
C. Portois et al.
All monitoring wells recorded a decrease of chlorinated solvents fluxes ranging between 39 and 206 mmol·m−2 day−1. The maximum reduction was recorded for well 117 at one order of magnitude (from 51 to 5 mmol·m−2·day−1). The Reduction factor ranged between 4.5 (well 135) and 6.1 (well 118). After foam injection, the concentration gradient was maintained with a maximum in well 135 and a decline further West. As the results of well 118 were difficult to interpret we defined the reduction factor based on the three other wells, which sum up to a value of approx. 265 mmol·m−2·day−1 for both techniques before the injection and an average of 60 mmol·m−2·day−1 after the injection (47 for targeted sampler and 76 for PFM), or a reduction factor of approximately 4.4 (corresponding to t + 3m). The total flux measurement highlighted the significant impact of foam injection downstream of the confined area. These results are confirmed by modelling the source dissolution with and without foam. The foam model was used to calculate the dissolved flux of CS delivered form the source zone (Fig. 7), by considering an estimated source zone dimension and a fixed concentration at the source boundary. By only using the calibration obtained with pumping test data (correspond to t + 1m), the flux was reduced by a factor of 3.05 due to foam injection, which is similar to the reduction based on flux measurements. Up gradient of the foam injection area, a certain percentage of groundwater was diverted around the confined area that lead to the reduction of the mobilisation of chlorinated solvents even if the area was not completely confined, as suggested by the 2D groundwater flow
Fig. 6. Passive flux meter (PFM) and targeted sampler (TS) results (mmoles·m−2·day−1). Numbers below the x-axis are the well numbers.
Total molar concentrations of all chlorinated solvents (CS) calculated for the PFMs was globally in the same range as the analysis of groundwater from classical sampling techniques, except 118 which is lower for traditional sampling and analysis.
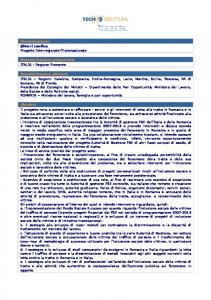
Fig. 7. Transport simulation (isolines express the value of the molar concentration of CS in mmol/L): (a) plume before, (b) and after foam injection. (c) Flux of contaminant (mmoles·m−2·day−1) are plotted along the line. 7
Journal of Contaminant Hydrology xxx (xxxx) xxx–xxx
C. Portois et al.
model. Therefore, foam clearly acts as a hydraulic barrier and leads to the reduction of contaminant fluxes downstream of this area.
Bertin, H., Estrada, E.D., Atteia, O., 2017. Foam placement for soil remediation. Environ. Chem. 14 (5), 338–343. Bikerman, J.J., 1973. Foams, 1st ed. vol. 10 Springer-Verlag, Berlin Heidelberg. http:// dx.doi.org/10.1007/978-3-642-86734-7. Boeije, C.S., Rossen, W., 2014. Gas-injection rate needed for SAG foam processes to overcome gravity override. SPE J. 20, 49–59. Bouwer, H., 1989. The bouwer and rice slug test—an update. Groundwater 27, 304–309. Bouwer, H., Rice, R.C., 1976. A slug test for determining hydraulic conductivity of unconfined aquifers with completely or partially penetrating wells. Water Resour. Res. 12, 423–428. Gauglitz, P.A., Friedmann, F., Kam, S.I., Rossen, W.R., 2002. Foam generation in homogeneous porous media. Chem. Eng. Sci. 57, 4037–4052. Giese, S.W., Powers, S.E., 2002. Using polymer solutions to enhance recovery of mobile coal tar and creosote DNAPLs. J. Contam. Hydrol. 58, 147–167. Harbaugh, A.W., Banta, E.R., Hill, M.C., McDonald, M.G., 2000. MODFLOW-2000, The U. S. Geological Survey modular ground-water model-user guide to modularization concepts and the ground-water flow process. In: Open-file Report. U. S. Geological Survey, pp. 134. Hatfield, K., Annable, M., Cho, J., Rao, P.S., Klammler, H., 2004. A direct passive method for measuring water and contaminant fluxes in porous media. J. Contam. Hydrol. 75, 155–181. http://dx.doi.org/10.1016/j.jconhyd.2004.06.005. Hirasaki, G.J., Miller, C.A., Szafranski, R., Lawson, J.B., Meinardus, M.J., Londergan, J.T., ... Wade, W.H., 1997. Field demonstration of the surfactant/foam process for aquifer remediation. In: SPE Annual Technical Conference and Exhibition, San Antonio, TX, USA, 5-8 October. Kam, S.I., Rossen, W.R., 2003. A model for foam generation in homogeneous media. SPE J. 8, 417–425. Khatib, Z.I., Hirasaki, G.J., Falls, A.H., 1988. Effects of capillary pressure on coalescence and phase mobilities in foams flowing through porous media. SPE Reserv. Eng. 3, 919–926. Kovscek, A.R., Bertin, H.J., 2003. Foam mobility in heterogeneous porous media. Transp. Porous Media 52, 17–35. Longpré-Girard, M., Martel, R., Robert, T., Lefebvre, R., Lauzon, J.-M., 2016. 2D sandbox experiments of surfactant foams for mobility control and enhanced LNAPL recovery in layered soils. J. Contam. Hydrol. 193, 63–73. Ma, K., Liontas, R., Conn, C.A., Hirasaki, G.J., Biswal, S.L., 2012. Visualization of improved sweep with foam in heterogeneous porous media using microfluidics. Soft Matter 8, 10669–10675. Maire, J., Fatin-Rouge, N., 2017. Surfactant foam flushing for in situ removal of DNAPLs in shallow soils. J. Hazard. Mater. 321, 247–255. Maire, J., Coyer, A., Fatin-Rouge, N., 2015. Surfactant foam technology for in situ removal of heavy chlorinated compounds-DNAPLs. J. Hazard. Mater. 299, 630–638. http://dx.doi.org/10.1016/j.jhazmat.2015.07.071. Martel, R., Gélinas, P.J., Saumure, L., 1998. Aquifer washing by micellar solutions: 3 Field test at the Thouin Sand Pit (L'Assomption, Québec, Canada). J. Contam. Hydrol. 30, 33–48. Martel, R., Hébert, A., Lefebvre, R., Gélinas, P., Gabriel, U., 2004. Displacement and sweep efficiencies in a DNAPL recovery test using micellar and polymer solutions injected in a five-spot pattern. J. Contam. Hydrol. 75, 1–29. Portois, C., Boeije, C.S., Bertin, H., Atteia, O., 2018. Foam for environnemental remediation: generation and blocking effect. Transp. Porous Media (Revised version send). Renkema, W.J., Rossen, W.R., 2007. Success of SAG foam processes in heterogeneous reservoirs. In: IPTC 2007: International Petroleum Technology Conference. Robert, T., Martel, R., Conrad, S.H., Lefebvre, R., Gabriel, U., 2006. Visualization of TCE recovery mechanisms using surfactant—polymer solutions in a two-dimensional heterogeneous sand model. J. Contam. Hydrol. 86, 3–31. Rossen, W.R., 1996. Foams in enhanced oil recovery. Surfactant Sci. Ser. 413–464. Rossen, W.R., Gauglitz, P.A., 1990. Percolation theory of creation and mobilization of foams in porous media. AICHE J. 36, 1176–1188. Rossen, W.R., Van Duijn, C.J., Nguyen, Q.P., Shen, C., Vikingstad, A.K., others, 2010. Injection strategies to overcome gravity segregation in simultaneous gas and water injection into homogeneous reservoirs. SPE J. 15, 76–90. Rothmel, R.K., Peters, R.W., St. Martin, E., DeFlaun, M.F., 1998. Surfactant foam/ bioaugmentation technology for in situ treatment of TCE-DNAPLs. Environ. Sci. Technol. 32, 1667–1675. Schramm, L.L., 1994. Foams: Fundamentals and Applications in the Petroleum Industry. American Chemical Society. Récupéré sur, Washington, DC, USA. http://pubs.acs. org/doi/abs/10.1021/ba-1994-0242.fw001. Shan, D., Rossen, W.R., 2002. Optimal injection strategies for foam IOR. In: SPE/DOE Improved Oil Recovery Symposium. Shi, J.X., Rossen, W.R., 1998. Simulation of gravity override in foam processes in porous media. SPE Reserv. Eval. Eng. 1, 148–154. Singh, R., Mohanty, K.K., 2017. Foam flow in a layered, heterogeneous porous medium: a visualization study. Fuel 197, 58–69. Strack, O.D., Haitjema, H.M., 1981. Modeling double aquifer flow using a comprehensive potential and distributed singularities: 1. Solution for homogeneous permeability. Water Resour. Res. 17, 1535–1549. Wang, S., Mulligan, C.N., 2004. An evaluation of surfactant foam technology in remediation of contaminated soil. Chemosphere 57, 1079–1089. http://dx.doi.org/10. 1016/j.chemosphere.2004.08.019.
3.7. Foam efficiency Although the reduction of CS flux is significant, the results show that the injected foam did not block the entire area. The blocked areas have a very low hydraulic conductivity, i.e. lowered by a factor of more than 100. Laboratory experiments showed that the reduction of krw was linked to a lower water saturation of the porous medium during foam injection. Portois et al., 2018 showed that this effect seems to occur only after injection of several pore volumes. It is therefore possible that the foam identified in the flow model is the only part where the water saturation is close to residual leading to very low krw values. The first PVs of injected foam could thus be a weak foam and have limited effect on the hydraulic conductivity of the medium (Portois et al., 2018). This is not considered in the flow model and could play some role, justifying the higher downgradient CS fluxes in the model rather than those measured. The overall foam efficiency could be improved using two approaches: a different mixture of surfactant that decreases the weak foam effect, or injecting at higher velocity to favour the strong foam (Rossen and Gauglitz, 1990), or by using Surfactant Alternating Gas (SAG) (Boeije and Rossen, 2014; Hirasaki et al., 1997; Shan and Rossen, 2002; Shi and Rossen, 1998). 4. Conclusions Surfactant foams were shown to be a very effective permeability reduction strategy and was used for the confinement of a chlorinated solvents source zone. Foam injection was performed over a 96 h period using a commercial mixture. Applying the foaming formulation investigated in this study provided drastic reduction in hydraulic conductivity to water (over a 100-fold) over several meters around injections wells. A modelling procedure allowed estimation of the foam size and extent of penetration through the aquifer with a maximum radius of 3.2 m. PFM measurements recorded the highest flux reduction 206 mmol·m−2·day−1 in well 117, and documenting the efficiency of foam for management a contaminant source zone. Here foam was demonstrated as a confinement agent, further study is needed to evaluate the economics of foam combined with conventional remediation techniques. The impact of foam on the residence time of oxidizing/reductive or biological agents must be clarified. Acknowledgments The authors want to thank M. Momtbrun and P. Perrier for their help in building the injection material and for its field implementation. Appendix A. Supplementary data Supplementary data to this article can be found online at https:// doi.org/10.1016/j.jconhyd.2018.04.003. References Annable, M.D., Hatfield, K., Cho, J., Klammler, H., Parker, B.L., Cherry, J.A., Rao, P.S., 2005. Field-scale evaluation of the passive flux meter for simultaneous measurement of groundwater and contaminant fluxes. Environ. Sci. Technol. 39, 7194–7201. http://dx.doi.org/10.1021/es050074g. Basu, N.B., Rao, P.S., Poyer, I.C., Annable, M.D., Hatfield, K., 2006. Flux-based assessment at a manufacturing site contaminated with trichloroethylene. J. Contam. Hydrol. 86, 105–127. Bertin, H.J., Apaydin, O.G., Castanier, L.M., Kovscek, A.R., others, 1999. Foam flow in heterogeneous porous media: effect of cross flow. SPE J. 4, 75–82.
8