Horizontal red line shows the half maximum height. Color scaling is the same as in. Figure 3. B) The area at the half-maximum value of the gaze probability ...
Current Biology, Volume 28
Supplemental Information
Gaze and the Control of Foot Placement When Walking in Natural Terrain Jonathan Samir Matthis, Jacob L. Yates, and Mary M. Hayhoe
Figure S1. Additional measures of subject gaze, Related to Figure 3 and 4. A) 2D, top-down view of the gaze density distributions shown in Figure 3. Black square shows +/- .3 leg lengths, which was the area used in the analysis shown in Figure 4A. Horizontal red line shows the half maximum height. Color scaling is the same as in Figure 3. B) The area at the half-maximum value of the gaze probability distributions in the different foothold centered reference frames (Area within the red solid line in Figure 3 and Extended Data Figure 1). Green, orange, and purple lines are for the Flat, Medium, and Rough terrains, respectively. Dots show subject means, error bars are +/- 1 SEM.
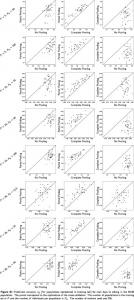
Figure S2. Summary data for Subject #1, Related to Figure 3 and 4. A) Equivalent to gaze probability distributions shown Figure 3, with insets showing 2D heatmap from Extended Data Figure 2. B,C,D) Equivalent to Figures 4A, 4B, and Extended Data Figure 1B, respectively. All axes are the same as the summary data figures. Gaze behavior between subjects was highest in the Flat terrain, likely due to the fact that precise visual-locomotor coupling wasn’t necessary in that terrain. In the Medium and Rough terrains, most subjects’ gaze behavior was consistent with the general trends shown in Figures 3 and 4, with some variability in the way that subjects split gaze between Footholds N+2 and N+3.
Figure S3. Summary data for Subject #2, Related to Figure 3 and 4. A) Equivalent to gaze probability distributions shown Figure 3, with insets showing 2D heatmap from Extended Data Figure 2. B,C,D) Equivalent to Figures 4A, 4B, and Extended Data Figure 2, respectively. All axes are the same as the summary data figures. Gaze behavior between subjects was highest in the Flat terrain, likely due to the fact that precise visuallocomotor coupling wasn’t necessary in that terrain. In the Medium and Rough terrains, most subjects’ gaze behavior was consistent with the general trends shown in Figures 3 and 4, with some variability in the way that subjects split gaze between Footholds N+2 and N+3.
Figure S4. Summary data for Subject #3, Related to Figure 3 and 4. A) Equivalent to gaze probability distributions shown Figure 3, with insets showing 2D heatmap from Extended Data Figure 2. B,C,D) Equivalent to Figures 4A, 4B, and Extended Data Figure 2, respectively. All axes are the same as the summary data figures. Gaze behavior between subjects was highest in the Flat terrain, likely due to the fact that precise visual-locomotor coupling wasn’t necessary in that terrain. In the Medium and Rough terrains, most subjects’ gaze behavior was consistent with the general trends shown in Figures 3 and 4, with some variability in the way that subjects split gaze between Footholds N+2 and N+3.
Figure S5. Summary data for Subject #4, Related to Figure 3 and 4. A) Equivalent to gaze probability distributions shown Figure 3, with insets showing 2D heatmap from Extended Data Figure 2. B,C,D) Equivalent to Figures 4A, 4B, and Extended Data Figure 2, respectively. All axes are the same as the summary data figures. Gaze behavior between subjects was highest in the Flat terrain, likely due to the fact that precise visual-locomotor coupling wasn’t necessary in that terrain. In the Medium and Rough terrains, most subjects’ gaze behavior was consistent with the general trends shown in Figures 3 and 4, with some variability in the way that subjects split gaze between Footholds N+2 and N+3.
Figure S6. Summary data for Subject #5, Related to Figure 3 and 4. A) Equivalent to gaze probability distributions shown Figure 3, with insets showing 2D heatmap from Extended Data Figure 2. B,C,D) Equivalent to Figures 4A, 4B, and Extended Data Figure 2, respectively. All axes are the same as the summary data figures. Gaze behavior between subjects was highest in the Flat terrain, likely due to the fact that precise visuallocomotor coupling wasn’t necessary in that terrain. In the Medium and Rough terrains, most subjects’ gaze behavior was consistent with the general trends shown in Figures 3 and 4, with some variability in the way that subjects split gaze between Footholds N+2 and N+3.
Figure S7. Summary data for Subject #6, Related to Figure 3 and 4. A) Equivalent to gaze probability distributions shown Figure 3, with insets showing 2D heatmap from Extended Data Figure 1. B,C,D) Equivalent to Figures 4A, 4B, and Extended Data Figure 2, respectively. All axes are the same as the summary data figures. Gaze behavior between subjects was highest in the Flat terrain, likely due to the fact that precise visual-locomotor coupling wasn’t necessary in that terrain. In the Medium and Rough terrains, most subjects’ gaze behavior was consistent with the general trends shown in Figures 3 and 4, with some variability in the way that subjects split gaze between Footholds N+2 and N+3.