Business and Economic Research ISSN 2162-4860 2012, Vol. 2, No. 2
Financial Development and Economic Growth in Africa: Lessons and Prospects Roseline Oluitan (Corresponding author) Department of Accounting & Finance, Lagos State University, Lagos. Nigeria Tel: 234-808-528-2611
Received: August 7, 2012 doi:10.5296/ber.v2i2.2205
E-mail:
[email protected]
Accepted: August 21, 2012 URL: http://dx.doi.org/10.5296/ber.v2i2.2205
Abstract This paper examines financial institutions within Africa if they are well positioned to assist the continent out of poverty with their growth prone capability. The study uses dynamic panel with variables as described by King & Levine (1993) and observed bi-directional relationship between finance and growth. Proxy for trade was not significant while evidences point to poor credit allocation to the private sector. The research also supports non-inclusion of money outside bank coffers in the King & Levine (1993) paper. The study covers 1970 to 2005 for about thirty-one African countries. Keywords: Financial Development, Economic Growth and Africa JEL Classification: C33, E44, G21, N27, O16 1. Introduction 1.1 The Role of Banks in Financial Intermediation The finance literature provides support for the argument that countries with better/efficient financial systems grow faster while inefficient financial systems bear the risk of bank failure (Kasekende, 2008). In a review of finance literature, the study opined that better functioning financial systems ease the external financing constraints that impede firm and industrial expansion. This view is buttressed the recent study by Demetriades & James 2011 that richer Sub-Saharan African countries tend to have more developed banking system. One of the seminal works that analyse the relationship between finance and growth is by King & Levine (1993). The paper examine about eighty countries of varied level of development and conducted a cross sectional study for thirty years (1960 to 1989). It is argued that the wide disparity in the level of development of the countries may at best be a distortion against the poorly and highly developed economies (Levine, 2005). Secondly, the 54
www.macrothink.org/ber
Business and Economic Research ISSN 2162-4860 2012, Vol. 2, No. 2
methodology used is classified as inadequate to capture the relationship in more detail (Demetriades & Andrianova, 2004). They also suggest that the paper ought to address the issue of causation as discussion on it seems unsettled. Finally, they comment on the inclusion of developing countries without including money outside the banking sector. Researchers are of the opinion that developing countries have large volume of liquid liabilities outside the banking system and omitting the variable is viewed as bias. 1.2 Relationship between Finance and Growth The relationship between finance and growth has been extensively discussed in the literature, albeit an inconclusive decision. Patrick (1966) postulated two types of relationship: Supply Leading hypothesis and Demand Following hypothesis. Subsequently, Demetriades & Hussein (1996) conducted a Johansen based ECM and postulated bi-directional relationship as the third. The view of the Supply-leading hypothesis assumes that the intermediation activities of the financial institutions make the real sector to increase their productive capacity, which subsequently enlarges the productive base of the economy. As such finance is positive and significant in motivating growth. Notable scholars such as Schumpeter (1934), McKinnon (1973), Fry (1988), Odedokun (1998), Levine et al (2000), Calderon & Liu (2003), King & Levine (1993), Johannes et al (2011) and Estrada et al (2010) all support this hypothesis. The proponents of demand following hypothesis assume that the enlargement of the economy pushes the real sector to demand for fund from the financial institutions to meet up with the increase in productivity (Goldsmith, 1969; Gurley & Shaw, 1967, Robinson 1952,). As a result, the economy pushes the financial institutions to intermediate The postulation of bi-directional causation assumes that both financial development and economic growth exert influence on each other. Sequel to the Demetriades & Hussein (1996) study, other scholars (Ogundokun, 1998; Demetriades & Andrianova, 2004; Akinlo & Egbetunde 2010) have conducted studies that buttress this assertion. Recent studies observe a diminishing or altogether broken link between finance and growth. According to Demetriades & James (2011) in a panel cointegration study on eighteen Sub-Saharan African countries, they observe that while bank liabilities are found to follow (but not lead) growth, the link between credit and growth is altogether absent. Kumar (2011) conducted bounds test analysis and gave a similar opinion that financial development does not have any significant long run effect on per worker income. He suggests developing exports and remittances market for long term sustainability of the economy while efforts are geared into searching for innovative ways to make financial sector more integrated to economic activities. 2. Indicators of Financial Development and Economic Growth Researchers use various measures of financial development such as credit to the private sector, liquid liabilities of the financial system (measured by M3) and volume of credit provided by banks (Allen and Ndikumama, 1998); the ratio of liquid liabilities of the financial system to GDP (LLY), ratio of deposit money bank domestic assets to deposit money bank, domestic assets and central bank domestic assets (BANK), the ratio of claims 55
www.macrothink.org/ber
Business and Economic Research ISSN 2162-4860 2012, Vol. 2, No. 2
on the non-financial private sector to total domestic credit (PRIVATE) and ratio of claims on the non-financial private sector to GDP (PRIVY) (King and Levine, 1993). Oura (2008) used the ratio of external (bank) finance to total firm finance while Davis (2004) used four variables as indicators of financial development namely – stock market capitalisation, stock market turnover, listed companies and bank credit. Other studies have used stock market indicators, which indicate financial development for more advanced countries. In determining the proxy for growth, there seems to be no serious controversy about the variables used. Most of the variables represent different variations of GDP. Specifically, King and Levine (1993) used per capita GDP, which they termed GYP; per capita physical capital formation termed GK; the efficiency of the financial intermediaries, which is termed EFF, and ratio of investment to GDP termed INV. GYP is a very popular growth indicator, which measures the real per capita growth rate in the quantity of total domestic production over a specific period. GK is a variable that measures the growth rate of the real per capita physical stock while EFF is to capture the residual from the two growth indicators mentioned above. To capture the residual, the study uses the production equation y = kαx, where y is real per capita GDP, k is the real per capita physical stock, α is the production parameter function and x is used to capture other factors that account for growth. This equation after transformation through log and differencing becomes GYP = α(GK) + EFF. To analyse the relationship, they use a range of 0.2 to 0.4 to depict the value of α and eventually use 0.3 to calculate EFF reported. In essence, EFF is to measure other factors outside the GYP and GK that also contributes to growth within an economy. Such factors according to them include technological growth, human capital accumulation, increases in the number of hours worked etc. EFF can thus be termed “improvements in efficiency” they concluded. Different variations of the above-mentioned variables are reported in other papers too. This study uses the variables defined by King and Levine (1993) as stated above though the unavailability of data caused the exclusion of their measure for investment (INV) and the ratio of deposit money bank domestic assets to deposit money bank domestic assets plus central bank domestic assets (BANK). 3. Empirical Investigation: Research Question The research question tested in this study is:1) Is financial development important for generating growth within Africa?
Data, Analytical Method and Model Formulation The data for this study is from the World Development Indicator (WDI) 2008 dataset and the International Financial Statistics (IFS). The study covers thirty – one African Countries. The three financial variables used are LLY, PRIVATE and PRIVY. LLY is the ratio of liquid liabilities (M3) to GDP, is to measure in part the size of the financial intermediaries hence the ability to provide financial services. PRIVATE measures the ratio of Private Sector Credit to Domestic Credit of the Deposit Money Banks. The variable is able to capture the source of 56
www.macrothink.org/ber
Business and Economic Research ISSN 2162-4860 2012, Vol. 2, No. 2
allocation of funds and the quantity of total financial intermediation that the banks lend to the growth-promoting sector of the economy. PRIVY measures the ratio of Private Sector Credit to GDP. We introduce a variable to capture the impact of liquid liabilities that is outside the Deposit Money Banks termed LLYO. This is used to access the importance of liquid liabilities that do not form part of banking intermediation. For the growth variables, we use GYP, GK and EFF. EFF is measured as the difference between GYP and 0.3 of GK. Panel methodology is used to estimate the relationship. The estimation includes regressing each of the financial development proxy along with some indirect variables that are relevant in view of recent empirical studies on each of the growth proxy. Such indirect variables include Inflation termed INF; ratio of government spending to GDP termed GOVT and ratio of trade (exports plus imports) to GDP termed TRADE The reasoning behind the choice of these variables is similar to that of King and Levine (1993) above. In addition, we examine the causal relationship between finance and growth. The study starts with the two-stage GMM estimation, using the ivreg2 command in Stata. One peculiar feature of this approach is that the method is able to fix the requirement for instrumental variables as essential results relative to that will confirm the possibility of using such instruments or otherwise. Secondly, the Shea’s partial R2 provides additional test to confirm the relevance of the instruments. This test assists us to confirm whether the instruments explain properly the endogenous variable. We consider other tests such as the weak, under and over identification of instruments and report on them in the result profile. In addition to that, the correlation matrix for the variables is presented in table 1 below. Table 1. Correlation Result between Proxies for Growth and Financial Development Variables
Variables LLY GYP 0.362 (0.000) GK 0.527 0(.000) EFF 0.155 (0.000)
PRIVATE 0.143 (0.000) 0.130 (0.001) 0.124 (0.002)
PRIVY 0.452 (0.000) 0.438 (0.000) 0.341 (0.000)
LLYO 0.065 (0.103) 0.076 (0.059) 0.034 (0.386)
KEY: - GYP is Real per capita GDP Growth rate; GK is Real per capita Fixed Capital Formation Growth rate; EFF is defined as GYP – (0.3)GK; LLY is Liquid liabilities to GDP; Private is private Sector Credit to Domestic Credit Privy is Private Sector Credit to GDP and LLYO is Money outside the Deposit Money Banks. P-value in parenthesis () From Table 1, all the financial development variables are highly correlated with the various proxies for growth. The only exception is money outside the coffers of the deposit money banks (llyo) which exhibits weak correlation (at 10%) with GK and no correlation with both GYP and EFF. As a result of this observation, money outside the banking system is dropped from the list of variables. This observation justifies the decision of King and Levine not to include it in the list of variable used for their analysis.
57
www.macrothink.org/ber
Business and Economic Research ISSN 2162-4860 2012, Vol. 2, No. 2
Table 2. Correlation Result for the Proxies of Growth Variables GYP GK EFF
GYP GK EFF 1.000 0.635(0.000) 1.000 0.898(0.000) 0.231(0.000) 1.000
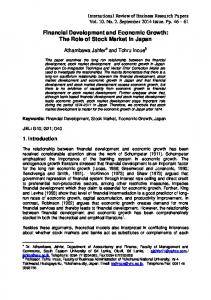
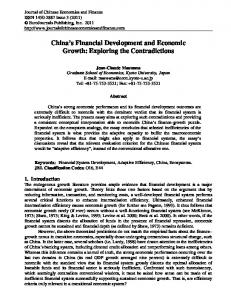
KEY: - GYP is Real per capita GDP Growth rate; GK is Real per capita Fixed Capital Formation Growth rate; EFF is defined as GYP – (0.3)GK. P-value in parenthesis () Furthermore, we examine the correlation of the growth proxies and the result presented in table 2 above shows that the variables are highly correlated at 1% with each other. An inclusion of all the variables in the regression together will result in multi-collinearity hence a justification for our approach to include the each of the proxies in separate regression. When we chart these variables as shown in figures 1 and 2 below for 1985 and 2005, the high level of correlation amongst them is readily visible.
Figure 1. Growth Proxies for African Countries in 1985 Source: The World Bank Development Indicator (2007)
Figure 2. Growth Proxies for African Countries in 1985 Source: The World Bank Development Indicator (2007) 58
www.macrothink.org/ber
Business and Economic Research ISSN 2162-4860 2012, Vol. 2, No. 2
Few countries such as Egypt, Rwanda mostly with EFF do not have the same relationship as seen with other countries. The models that we test are: -
where: Yit represents the proxy for growth (Gyp, Gk and Eff introduced separately) of the i-thcountry at time t; Fit represents the proxy for financial development (Lly, Private and Privy introduced separately) of the i-thcountry at time t; Git represents Government Expenditure of the i-th country at time t; Tit represents Trade of the i-th country at time t Iit represents Inflation of the i-th country at time t Table 3. Gmm2step Regression Result For African Countries (Growth) 1985 – 2005 Variables
Gyp
Gyp
Gyp
Gk
Gk
Gk
Eff
Eff
Eff
Lly
Private
Privy
Lly
Private
Privy
Lly
Private
Privy
Constant
0.000
0.103
0.000
0.307
0.647
0.982
0.000
0.110
.0000
Govt
0.008
0.082
0.001
0.001
0.426
0.002
0.000
0.084
0.004
Trade
0.000
0.083
0.007
0.020
0.019
0.011
0.000
0.051
0.005
Inf
0.324
0.958
0.002
0.012
0.208
0.000
0.001
0.955
0.318
Schenr
0.000
Agedep
0.000
st
1 stage Variables
Exrt
0.000
Private t-1
0.000
Depint
0.070
0.000
0.000
0.000
0.000 0.000
0.000 0.069
Govt t-1
0.030
llyo t-1
0.061
0.066
Privy t-1
0.000
lly t-1
0.000
Shea Partial
0.000
0.000 0.000
0.000
0.588
0.239
0.661
0.414
0.243
0.381
0.244
0.236
0.684
0.588
0.239
0.661
0.414
0.243
0.381
0.244
0.236
0.684
1.124**
3.175**
1.861**
0.970
3.480**
1.295
2.024**
2.258**
1.649**
(0.004)
(0.000)
(0.000)
(0.201)
(0.000)
(0.063)
(0.000)
(0.000)
(0.000)
2
R
Partial R2
2 Step GMM
Cons
Lly
Private
2.989**
4.567**
0.307
(0.000)
(0.000)
(0.331)
0.364**
0.323*
0.352**
(0.000)
(0.043)
(0.000)
59
www.macrothink.org/ber
Business and Economic Research ISSN 2162-4860 2012, Vol. 2, No. 2 Privy
Govt
2.648**
5.281**
1.153**
(0.000)
(0.000)
(0.000)
-0.064
0.538**
0.039
-0.226
0.412*
-0.202
0.267**
0.477**
0.176*
(0.690)
(0.000)
(0.653)
(0.431)
(0.020)
(0.461)
(0.005)
(0.000)
(0.022)
0.953**
1.382**
1.026**
0.765**
1.315**
0.806**
0.876**
1.056**
0.798**
(0.000)
(0.000)
(0.000)
(0.000)
(0.000)
(0.000)
(0.000)
(0.000)
(0.000)
-0.115**
-0.113**
-0.120**
-0.108*
-0.096*
-0.035
-0.132**
-0.100**
-0.112**
(0.001)
(0.000)
(0.000)
(0.052)
(0.050)
(0.534)
(0.000)
(0.000)
(0.000)
Centred R2
0.448
0.323
0.547
0.305
0.140
0.366
0.374
0.261
0.396
Reg
P.
0.000
0.000
0.000
0.000
0.000
0.000
0.000
0.000
0.000
of
534
445
496
484
495
500
483
432
503
Under ID
0.000
0.000
0.000
0.000
0.000
0.000
0.000
0.000
0.000
Weak ID
169.47
46.04
317.82
76.78
78.60
85.11
77.14
43.85
539.73
Over ID
0.648
0.113
0.663
0.411
0.627
0.178
0.735
0.207
0.509
Trade
Inf
Value No.
Observation
KEY: - GYP is Real per capita GDP; GK is Real per capita Fixed Capital Formation; EFF is defined as GYP – (0.3)GK; LLY is Liquid liabilities to GDP; PRIVATE is Private Sector Credit to Domestic Credit and PRIVY is Private Sector Credit to GDP; GOVT is the ratio of government spending to GDP and TRADE is the ratio of trade (exports plus imports) to GDP; INF is the Inflation rate. Note: Figures in parenthesis ( ) are the p-values of the variables. The symbols of ** and * depicts 1% and 5% level of significance for the coefficients and with the expected sign while ## and # also denotes significance at 1% and 5% level of significance but the sign of the coefficient does not tally with the literature. The symbol of * in the diagnostic section denotes significance at 5% or 10% level. The result above shows that all the proxies for financial development are significant with the proxies for growth. This is similar to the findings of King and Levine where the growth proxies were significant at 5% rather than 1% observed in this study. However, the coefficient for both lly and privy are very large while that of private is very tiny. This asserts that the quantity of credit allocated to the private sector is low and needs to improve. The same observation was made by Demetriades & James (2011). The coefficients observed in this study are significantly larger than what the main study of reference for this work obtained. Similarly, the regression intercept is very significant for the regressions except for combinations of gk and private; and gk and privy. Nonetheless, it is a bit of improvement over the findings of King and Levine where seven out of the eight regressions that includes privy were not significant. Furthermore, the explanatory variables comprising of government spending, trade (exports plus imports as a ratio of GDP) and inflation gave different variations of significance ranging between 1% and 5%. The coefficient for inflation is settled with a negative sign, but that of trade and government expenditure is not settled and this is 60
www.macrothink.org/ber
Business and Economic Research ISSN 2162-4860 2012, Vol. 2, No. 2
attributable to the resource curse argument amongst others (Gries et al, 2009). In Africa, it is very common to get projects for which funds have been disbursed, only to be executed on paper. This explains the huge amount expended by government, but eventually misses out in the growth process. In order to establish causation, we repeat the same regression discussed with the various proxies for financial development now used as the dependent variable. The result is in table 4 below. Table 4. Gmm2step Regression Result For African Countries (Finance) 1985 - 2005 Variables
Lly
Lly
Lly
Private
Private
Private
Privy
Privy
Privy
Gyp
Gk
Eff
Gyp
Gk
Eff
Gyp
Gk
Eff
Constant
0.243
0.505
0.808
0.055
0.021
0.006
0.243
0.505
0.808
Govt
0.001
0.309
0.062
0.008
0.037
0.305
0.001
0.309
0.062
Trade
0.110
0.226
0.628
0.028
0.541
0.716
0.110
0.226
0.628
Inf
0.991
0.107
0.098
0.762
0.543
0.591
0.991
0.107
0.098
Govtt-1
0.018
0.053
0.013
0.018
0.053
0.013
Gypt-1
0.000
0.000
0.000
0.000
0.000
0.000
1
st
stage
Variables
0.000
0.000
0.000
Savgdp
0.023
0.000
0.018
Exrt
0.084
0.000
0.000
0.003
0.005
Schenr Shea Partial R2 2
Partial R
0.967
0.336
0.673
0.967
0.415
0.736
0.967
0.336
0.673
0.967
0.336
0.673
0.967
0.415
0.736
0.967
0.336
0.673
0.255**
0.280**
0.278**
-0.701**
-0.691**
-0.696**
0.184**
0.186**
0.185**
(0.000)
(0.000)
(0.000)
(0.005)
(0.003)
(0.005)
(0.000)
(0.000)
(0.000)
2 step GMM Cons
Gyp
0.125**
0.239**
0.103**
(0.000)
(0.000)
(0.000)
Gk
0.115**
0.205**
0.097**
(0.000)
(0.000)
(0.000)
Eff1
Govt
Trade
Inf
Centred R2
0.180**
0.335**
0.152**
(0.000)
(0.000)
(0.000)
0.098**
0.123**
0.098**
-0.443**
-0.436**
-0.460**
0.095**
0.110**
0.089**
(0.000)
(0.000)
(0.000)
(0.000)
(0.000)
(0.000)
(0.000)
(0.000)
(0.000)
-0.043
-0.017
-0.042
-0.611##
-0.590##
-0.631##
-0.032
-0.017
-0.038
(0.077)
(0.455)
(0.153)
(.000)
(0.000)
(0.000)
(0.058)
(0.347)
(0.070)
0.020##
0.011
0.022##
-0.025
-0.040
-0.019
0.001
-0.004
0.004
(0.002)
(0.077)
(0.006)
(0.352)
(0.223)
(0.533)
(0.732)
(0.387)
(0.427)
0.261
0.320
0.008
0.094
0.032
0.081
0.355
0.237
0.125
61
www.macrothink.org/ber
Business and Economic Research ISSN 2162-4860 2012, Vol. 2, No. 2 Reg P Value
0.000
0.000
0.000
0.000
0.000
0.000
0.000
0.000
0.000
516
503
503
490
472
472
516
503
503
Under ID
0.000
0.000
0.000
0.000
0.000
0.000
0.000
0.000
0.000
Weak ID
7491.23
125.92
511.85
4833.79
82.28
323.88
7491.23
125.92
511.85
Over ID
0.946
0.406
0.240
0.996
0.159
0.386
0.268
0.470
0.126
No.
of
Observation
KEY: Same as table 3 above From the above result, all the growth proxies are significant with the financial development proxies. This aspect of the study does not form part of the King and Levine (1993) study hence difficult to make any comparison. However, it contrasts the findings of Demetriades & James (2011) who find that only liquid liabilities follow (but not lead) growth and Kumar (2011). However it lends support to the findings of Estrada et al (2010); Akinlo & Egbetunde (2010) and Johannes (2011). This study shows that all the finance proxies are important drivers of growth. The intercept for all the regressions are significant at 1%. Govt, which is one of the explanatory variables, is significant for all the regression at 1%, but the coefficient is negative when private is the dependent variable. Likewise, inflation is only significant at 1% and 10% respectively when lly is the dependent variable. For the other regressions, it is insignificant. The coefficient for trade is negative in all the regression; highly significant at 1% when private is the dependent variable, weakly significant at 10% when privy is the dependent variable (except when GK is the growth proxy) and not significant when lly is the dependent variable (except when Gyp is the growth proxy). This observation suggests that private captures better the relationship between financial development and trade than the other two proxies for finance hence supports the findings of Gries et al (2009) Based on the observation in this study about the effect of the growth variables on the financial development variables as presented in tables 3 and 4 above, the relationship is bi-directional causation. This finding is different from the finding of King and Levine as they observe that finance is important for growth, but fully supports the studies by Demetriades and Hussein (1996) and Odedokun (1998) and partly the findings of Gries et al (2009).but at variance with the observation of Demetriades & James (2011) As earlier mentioned, the Ordinary Least Square (OLS) method of estimation is to check the robustness of the result obtained above. The fixed effect approach is used to assess the relationship and the equations that we test are:
where: Yit represents the proxy for growth (Gyp, Gk and Eff introduced separately) of the i-thcountry at time t; Fit represents the proxy for financial development (Lly, Private and Privy introduced separately) of the i-thcountry at time t; Git represents Government Expenditure of the i-thcountry at time t; Tit represents Trade of the i-thcountry at time t Iit 62
www.macrothink.org/ber
Business and Economic Research ISSN 2162-4860 2012, Vol. 2, No. 2
represents Inflation of the i-thcountry at time t The results for the above equations are presented in tables 5 and 6 below. Table 5. Panel Estimation Regression Result For African Countries (Growth) 1985 – 2005 Variables
GYP
GYP
GYP
GK
GK
GK
EFF
EFF
EFF
Constant
1.329**
1.437**
1.347**
0.170
1.658**
1.689**
-0.140**
-0.054
-0.034
(0.000)
(0.000)
(0.000)
(0.082)
(0.000)
(0.000)
(0.001)
(0.259)
(0.472)
LLY
0.357**
0.023*
0.015*
(0.006)
(0.020)
(0.032)
PRIVATE
0.086**
0.062**
0.025**
(0.000)
(0.010)
(0.001)
PRIVY GOVT
0.385**
0.358
0.342**
(0.004)
(0.086)
(0.004)
-0.223**
-0.195**
-0.235**
0.061
-0.402**
-0.390**
-0.084**
-0.043
-0.033
(0.000)
(0.000)
(0.000)
(0.189)
(0.000)
(0.000)
(0.000)
(0.065)
(0.161)
0.215**
0.201**
0.237**
0.066
0.132
0.198*
0.049*
0.043
0.046
(0.000)
(0.001)
(0.643)
(0.250)
(0.139)
(0.030)
(0.047)
(0.141)
(0.104)
-0.011
-0.004
-0.005
-0.000
-0.051**
-0.063**
-0.000**
-0.001**
-0.000**
(0.364)
(0.746)
(0.012)
(0.379)
(0.005)
(0.001)
(0.000)
(0.000)
(0.000)
R
0.387
0.226
0.396
0.026
0.126
0.151
0.081
0.079
0.068
Reg P Value
0.000
0.000
0.000
0.054
0.000
0.000
0.000
0.000
0.000
No of Obs
539
533
539
569
503
509
598
511
517
TRADE INF 2
KEY: Same as table 3 above
Table 6. Panel Estimation Regression Result For African Countries (Finance) 1985 – 2005 Variables Constant GYP
LLY 0.012 (0.625) 0.053** (0.006)
GK
LLY 1.461** (0.004)
LLY
PRIVATE
PRIVATE
PRIVATE
-1.170**
-0.760** (0.010) 0.494** (0.00)
-1.005**
-0.876**
(0.004)
(0.002)
(0.000)
0.518* (0.025)
EFF GOVT TRADE INF R2 Reg P Value No of Obs
0.003 (0.753) -0.010 (0.442) -0.002 (0.407) 0.021 0.064 539
0.553* (0.022) -0.160 (0.593) -0.001 (0.542) 0.030 0.011 533
PRIVY 0.211** (0.000) 0.050** (0.001)
0.396** (0.000) 0.590** (0.000) -0.235 (0.079) -0.152 (0.346) -0.002* (0.001) 0.046 0.000 539
-0.253* (0.050) -0.416## (0.010) -0.002 (0.199) 0.062 0.000 569
-0.345* (0.028) -0.396# (0.031) -0.011 (0.764) 0.073 0.000 503
PRIVY 0.261** (0.000)
PRIVY 0.236** (0.000)
0.017 (0.086) 0.700** (0.000) -0.366** (0.005) -0.421## (0.007) -0.002 (0.068) 0.073 0.000 509
0.053** (0.001) -0.084## (0.000) -0.011** (0.006) 0.081 0.000 598
0.052** (0.002) -0.075## (0.000) -0.011** (0.008) 0.081 0.000 511
0.063** (0.002) 0.053** (0.001) -0.085## (0.000) -0.012** (0.003) 0.086 0.000 517
KEY: - Same as table 3 above 63
www.macrothink.org/ber
Business and Economic Research ISSN 2162-4860 2012, Vol. 2, No. 2
The result presented in tables 5 and 6 above supports the earlier submission of a bi-directional causation between financial development and economic growth in Africa. From table 5, all the financial development variables are significant against the proxies for growth and gives similar results with the IV/GMM method of estimation. Specifically, when GYP is the dependent variable, all the financial proxies are significant at 1% and with large coefficient except private, which is tiny. When GK is the dependent variable, the level of significance of the financial development proxies hovers between 1% and 10%. Models with EFF appear better than that with GK as two of the financial proxies significant at 1% while that of lly is significant at 5%. Government expenditure is relatively stable with a negative sign in these regressions except with the combination of GK and lly that is positive. This is attributable to the natural resource curse argument. Trade is positive and conforms to the literature. The same thing applies to inflation, which has negative and tiny coefficient in all the regressions. In essence, the result obtained with this methodology is similar to what we obtain from the IV/GMM estimation approach. From the result in table 5, all the variables have the expected sign, but gyp seems to be the best growth proxy because all the explanatory variables are significant except inflation and they all have the expected sign (government expenditure could have a negative coefficient because of the natural resource curse argument). Table 6 presents the result with the financial development proxies as the dependent variable. The growth proxies are significant at 1% and positive in all the regressions except with the pair of lly & GK and privy & GK which are significant at 5% and 10% respectively. Similar with other regressions reported in this study, the coefficient for inflation is negative and tiny. However, the coefficient for trade is negative and highly significant in most of the regressions. Government expenditure exhibits similar pattern as it gives an unstable result as obtained in the previous results. In most of the regression, the coefficient is significant. Private seems to be the best financial development proxy because all the growth proxies are significant at 1% whereas gk is significant at 5% for lly (as dependent variable) and not significant for privy (as dependent variable). This observation is contrary to the findings of Demetriades & James (2011) who observed that there is no long run relationship when credit is the proxy for financial development. From the foregoing, we observe that the regression results obtained with two different analytical approaches are not different from each other. Based on this, I postulate that the relationship between financial development and economic growth is bi-directional causation. Recent argument of broken link between finance and growth cannot be explained with this result. What can be explained is the poor ratio of private credit which is responsible for the tiny coefficient in the results. This result emphasises the important role of private credit which in this study is still significant, but leaves a lot of room for improvement. The financial institutions need to ensure efficient and effective allocation of resources that will support growth more that what is currently obtained within the continent. We also observe that the coefficient for trade is negative in all the regressions. This at best can be described that trade has an inverse relationship with the various proxies for financial 64
www.macrothink.org/ber
Business and Economic Research ISSN 2162-4860 2012, Vol. 2, No. 2
development. The ratio of government expenditure to GDP exhibits a statistically significant relationship with the financial variables, but the direction of the relationship is not stable as some regressions had positive coefficients while others have a negative sign. Inflation shows a clearer picture with negative coefficient. 4. Conclusion In this paper, we examine the relationship between the financial institutions and growth. The results suggest that the contribution of the financial sector through intermediation is important to growth. However, the contribution of the ratio of private sector credit to total domestic credit is very small when compared with the coefficient of the other two proxies for financial development namely liquid liabilities and ratio of private sector credit to GDP. This possibly implies that a sizeable percentage of the deposit money banks lending goes to other areas of the economy (apart from the private sector) or that the banks possibly engage in rent seeking activities. Despite the tiny contribution to the private sector, evidence from the study finds that private sector credit is important for growth, hence fails to agree that there is no long run relationship between private credit and growth. The above emphasises the important role of credit to the private sector hence the need to improve on the quantity of credit that is channelled to the sector. Secondly, the continent should de-emphasise natural resource which has made many countries to be public driven and target private driven economies which will allow the private sector to thrive appropriately. They should search for alternative sources of funding (other than natural resource) and eliminate corruption. The ratio of liquid liabilities is significant and exhibits positive relationship with two of the proxies for growth in the regression result. The study also finds that both the proxies for growth and financial development exert positive effect on each other. Summarily the financial institutions in Africa need to ensure a more efficient and effective allocation of resources that will further support growth mare than what currently obtains within the continent. List of Countries included are: Algeria, Republic of Benin, Burkina Faso, Burundi, Cameroon, Central African Republic, Congo Republic, Cote d’Ivoire, Egypt, Equitorial Guinea, Ethiopia, Gabon, Kenya, Libya, Madagascar, Malawi, Mali, Mauritius, Morocco, Mozambique, Niger, Nigeria, Rwanda, Senegal, Sierra Leone, South Africa, Togo, Tunisia, Uganda, Zambia and Zimbabwe. References Allen, D. S., & Ndikumana, L. (1998). Financial Intermediation and Economic Growth in Southern Africa; Working Paper Series 1998-004, The Federal Reserve Bank of ST. Louis, available On-line: http://ressearch.stlouifed.org/wp/1998/98-004.pdf Akinlo A. E., & Egbetunde, T. (2010). Financial Development and Economic Growth: The Experiences of 10 Sub-Saharan African Countries Revisited. The Review of Finance and Banking, 2(1). Barro, R. J. (1991). Economic Growth in a Cross Section of Countries, Quarterly Journal of Economics, 106(2), 407-443. http://dx.doi.org/10.2307/2937943 65
www.macrothink.org/ber
Business and Economic Research ISSN 2162-4860 2012, Vol. 2, No. 2
Calderon, C. & Liu, L. (2003). The direction of Causality between Financial Development and Economic Growth. Journal of Development Economics. http://dx.doi.org/10.1016/S0304-3878(03)00079-8 Davis, E. P. (2004). Financial Development, Institutional Investors and Economic Performance. Demetriades, O. P., & Hussein, A. K. (1996). Does Financial Development cause Economic Growth? Time Series evidence from 16 countries. Journal of Development Economics, 51(2), 387-411. http://dx.doi.org/10.1016/S0304-3878(96)00421-X Demetriades, P., & Andrianova, S. (2004). Finance and Growth: What We Know and What We Need to Know, University of Leicester. Demetriades, O. P., & James, G. A. (2011). Finance and Growth in Africa: The Broken Link, Economic Letters, 113. Estrada, G., Park, D. & Kamayandi, A. (2010). Financial Development and Economic Growth in Asia. ADB Working Paper 233. Fry, M. (1988). Money, Interest and Banking in Economic Development. John Hopkins University Press, London. Ghirmay, T. (2004). Financial Development and Economic Growth in Sub-Saharan African Countries: Evidence from Time Series Analysis. African Development Bank. Goldsmith, R. (1969). Financial Structure and Development, Yale University Press, New Haven, Ct. Gries, T., Kraft, M., & Rieks, M. (2009). Linkages Between Financial Deepening, Trade Openness and Economic Development: Causality Evidence from Sub-Saharan Africa. World Development, 37(12), 1849-1860. http://dx.doi.org/10.1016/j.worlddev.2009.05.008 Gurley, J., & Shaw, E. (1967). Financial Structure and Economic Development. Economic Development and Cultural Change, 15(3), 257-268. http://dx.doi.org/10.1086/450226 Johannes, T. A, Njong, A. M., & Cletus N. (2011). Financial Development and Economic Growth in Cameroon, 1970 – 2005. Journal of Economics & International Finance, 3(6), 367–375. Kasekende, L. (2008). Developing a Sound Banking System. Paper presented at IMF Seminar, Tunisia. King, R., & Levine, R. (1993). Finance and Growth: Schumpeter Might Be Right. Quarterly Journal of Economics, 108, 717-738. http://dx.doi.org/10.2307/2118406 Kumar, R. R. (2011). Do Remottances, Exports and Financial Development Matter for Economic Growth? A Case Study of Pakistan Using Bounds Approach. Journal of International Academic Research, 11(1). Levine, R. (2005). Finance and Growth: Theory and Evidence. NBER Working Paper No 66
www.macrothink.org/ber
Business and Economic Research ISSN 2162-4860 2012, Vol. 2, No. 2
10766. Levine, R., Loayza, N., & Beck, T. (2000). Financial Intermediation and Economic Growth: Causes and Causality. Journal of Monetary Economics, 46, 31-77. http://dx.doi.org/10.1016/S0304-3932(00)00017-9 Luintel, K., & Khan, M. (1999). A quantitative reassessment of the finance–growth nexus: Evidence from a multivariate VAR. Journal of Development Economics, 60, 381-405. http://dx.doi.org/10.1016/S0304-3878(99)00045-0 McCandles, G. T., & Weber, W. E. (1995). Some Monetary Facts. Federal Reserve Bank of Minneapolis Quarterly Review, 19(3), 2-11. McKinnon, R. (1973). Money and Capital in Economic Development. Washington, The Brookings Institute. Odedokun, M. (1998). Financial intermediation and economic growth in developing countries. Faculty of Commerce, University of Swaziland, Swaziland. Oura, H. (2008). Financial Development and Growth in India: A Growing Tiger in a Cage?. IMF Working paper 08/79. Patrick, H. (1966). Financial Development and Economic Growth in Underdeveloped Countries. Economic Development and Cultural Change, 14, 174-189. http://dx.doi.org/10.1086/450153 Robinson, J. (1952). The Generalization of the General Theory, In The Rate of Interest, and Other Essays. London: McMillan , 67–146. Schumpeter, J. (1934). The Theory of Economic Development. Translated by Redvers Opie, Cambridge MA: Harvard University Press. Stockman A. (1981). Anticipated Inflation and the Capital Stock in a Cash-in-Advance Economy. Journal of Monetary Economics 8, 387-393. http://dx.doi.org/10.1016/0304-3932(81)90018-0
Copyright Disclaimer Copyright reserved by the author(s). This article is an open-access article distributed under the terms and conditions of the Creative Commons Attribution license (http://creativecommons.org/licenses/by/3.0/).
67
www.macrothink.org/ber