Tree Physiology 28, 509–520 © 2008 Heron Publishing—Victoria, Canada
Flux partitioning in an old-growth forest: seasonal and interannual dynamics MATTHIAS FALK,1,2 SONIA WHARTON,3 MATT SCHROEDER,3,4 SUSAN USTIN1,5 and KYAW THA PAW U1,3 1
CSTARS, LAWR, University of California, Davis, CA 95616, USA
2
Corresponding author (
[email protected])
3
Atmospheric Science, University of California, Davis, CA 95616, USA
4
Present address: College of Forest Resources, University of Washington, Seattle, WA 98195, USA
5
Hydrological Science, LAWR, University of California, Davis, CA 95616, USA
Received March 1, 2007; accepted July 30, 2007; published online February 1, 2008
Summary Turbulent fluxes of carbon, water and energy were measured at the Wind River Canopy Crane, Washington, USA from 1999 to 2004 with eddy-covariance instrumentation above (67 m) and below (2.5 m) the forest canopy. Here we present the decomposition of net ecosystem exchange of carbon (NEE) into gross primary productivity (GPP), ecosystem respiration (Reco ) and tree canopy net CO2 exchange (ΔC) for an old-growth Douglas-fir (Pseudotsuga menziesii (Mirb.) Franco)–western hemlock (Tsuga heterophylla (Raf.) Sarg.) forest. Significant amounts of carbon were recycled within the canopy because carbon flux measured at the below-canopy level was always upward. Maximum fluxes reached 4–6 µmol m – 2 s –1 of CO2 into the canopy air space during the summer months, often equaling the net downward fluxes measured at the above-canopy level. Ecosystem respiration rates deviated from the expected exponential relationship with temperature during the summer months. An empirical ecosystem stress term was derived from soil water content and understory flux data and was added to the Reco model to account for attenuated respiration during the summer drought. This attenuation term was not needed in 1999, a wet La Niña year. Years in which climate approximated the historical mean, were within the normal range in both NEE and Reco, but enhanced or suppressed Reco had a significant influence on the carbon balance of the entire stand. In years with low respiration the forest acts as a strong carbon sink (–217 g C m – 2 year –1 ), whereas years in which respiration is high can turn the ecosystem into a weak to moderate carbon source (+100 g C m – 2 year –1 ). Keywords: AmeriFlux, carbon exchange, eddy-covariance, interannual variability, net ecosystem exchange, standardized precipitation index, Wind River.
Introduction A detailed understanding of the interactive relationships in atmosphere–biosphere exchange is relevant to ecosystem
scale analysis and needed to improve our knowledge of the global carbon cycle. Yet, little is known about the seasonal dynamics and interannual variability in old-growth forest carbon exchange. The Wind River AmeriFlux tower represents a unique measurement point within the global FLUXNET network. This old-growth forest is distinguished by its age (400–500 years old), structural complexity, the large amounts of biomass contained in the standing trees and aboveground dead matter, and belowground carbon allocation (Parker et al. 2002, 2004, Shaw et al. 2004). In this study, we employed the eddy covariance (EC) technique, which has advantages over biometric inventories in providing direct and continuous measurements of carbon, water and energy fluxes between the ecosystem and the atmosphere. Eddy covariance, which is well documented within the FLUXNET community, has been used to estimate carbon exchange and annual carbon sink or source strength for a wide variety of ecosystems (Aubinet et al. 2000, Baldocchi et al. 2001, Law et al. 2002, Valentini et al. 2003). One emerging pattern from FLUXNET is the surprising amount of interannual variability in net ecosystem exchange of carbon (NEE) observed in multi-year EC studies such as that conducted at Harvard Forest since 1992 (Barford et al. 2001, Urbanski et al. 2007). Variability in NEE of more than 350 Mg C ha – 1 year – 1 has been measured at the Harvard deciduous forest over the last 13 years, largely driven by successional change in forest composition, disturbance events and increases in tree biomass (Urbanski et al. 2007). In contrast, changes in land-use and forest maturation cannot explain observed interannual NEE differences in an old-growth forest. There has been some debate whether interannual variability is caused by change in ecosystem response or by inherent problems with the EC method such as non-homogeneous fetch, noise and nighttime flux estimates; however, intensive studies including error analysis of EC data (Goulden et al. 1996a, Morgenstern et al. 2004, Ciais et al. 2005, Richardson et al. 2006), side-by-side comparisons of flux towers (Holl-
510
FALK, WHARTON, SCHROEDER, USTIN AND PAW U
inger and Richardson 2005) and efforts in network wide cross-calibration of EC systems (AmeriFlux, FluxnetCanada) give confidence in the reality of the observed variability. In addition, because systematic errors are of similar magnitude from year to year, many of the uncertainties inherent in the EC technique may cancel out in a study of interannual variability in carbon fluxes (Baldocchi et al. 2000, Massman and Lee 2002, Baldocchi 2003). Multi-year records enable us to understand the sources of interannual variation in NEE, which often arise from subtle imbalances in canopy photosynthesis and ecosystem respiration (Reco) (Goulden et al. 1996b, Barford et al. 2001, Flanagan et al. 2002, Hui et al. 2003, Xu and Baldocchi 2004); thus, long-term EC data provide a valuable tool for studying interannual variability in carbon fluxes. An advantage of the EC technique is that, in addition to measuring NEE on various time scales, the sources and sinks of carbon within the canopy can be identified with more than one instrument system (Baldocchi and Meyers 1991, Black et al. 1996, Lavigne et al. 1997). By using an EC system in the lowest layer of the forest canopy, in addition to the above-canopy instrumentation, we were able to investigate how carbon fluxes are partitioned (Misson et al. 2007) and recycled within the old-growth canopy. This multi-level study is analogous to previous multi-level turbulent studies, including scalar exchange measurements within canopies, in other forests (e.g., Gao et al. 1989). The dual-level system allowed us to decompose eddy flux measurements of NEE into gross primary productivity (GPP) and Reco as well as the difference in net CO2 fluxes attributable to the overstory (ΔC), enabling close examination of which environmentally controlled switches and lags drive the temporal dynamics of the ecosystem component fluxes. For example, an accurate estimation of Reco is particularly important in carbon flux studies because respiration is the driving force behind interannual variability in NEE at many forest ecosystems (Valentini et al. 2000). Our study objectives were to: (1) identify the temporal dynamics of NEE and its associate fluxes Reco and GPP; (2) examine the time lags between the major environmental driving variables and NEE, Reco and GPP; and (3) compare the magnitude and seasonal pattern of understory fluxes to overstory carbon exchange.
Materials and methods The analysis is based on six complete years (1999–2004) of ecosystem exchange data from the Wind River Canopy Crane AmeriFlux research station (45°49′14″ N, 121°57′7″ W, 371 m a.s.l.), located in the Gifford Pinchot National Forest in southern Washington State. Trees at the site are up to 500 years old and up to 65 m tall, and the two dominant tree species are Douglas-fir (Pseudotsuga menziesii (Mirb.) Franco) and western hemlock (Tsuga heterophylla (Raf.) Sarg.). The distribution of leaf area index (LAI) is bottom heavy with the maximum LAI between 10 and 30 m. For a temperate conifer, the forest structure at the site is complex with seven gymnosperm and two angiosperm tree species in the 2.3-ha crane circle, a high standing biomass and large amounts of coarse woody de-
bris on the forest floor. However, complexity depends on the spatial scale, and although the forest is complex in vertical structure and on the single-tree scale, it is highly homogeneous at the stand level. More detailed descriptions of the forest structure and environmental setting of the site as well as the canopy crane itself can be found in Parker et al. (2004) and Shaw et al. (2004). Daily, monthly and annual precipitation, air temperature (mean, maximum, minimum), snow depth and total snowfall data were available from 1999 through 2004, as well as historically from 1919 to 2004, at the nearby Carson Fish Hatchery NOAA station (45°31′12″ N, 121°34′48″ W, 345.6 m a.s.l). The NOAA station is 5 km north of the old-growth flux tower within the Wind River Valley at a similar elevation. The climate in the region is characterized by wet mild winters interspersed with a strong seasonal summer drought (Shaw et al. 2004, Falk et al. 2005). At the site, mean annual air temperature is 8.7 °C and mean water-year (defined as July–June) precipitation is 2467 mm year – 1, of which on average only 322 mm falls from July through October. Carbon dioxide flux above and below the canopy A detailed description of the EC method is presented by Paw U et al. (2004) and Falk et al. (2005). For a list of symbols, definitions and units, see Table 1. The two EC systems were placed in the old-growth forest to obtain the net CO2 exchange of both the entire ecosystem and from the forest floor. The above-canopy system (EC70 ) was mounted 67 m above ground level on the Wind River Canopy Crane. The understory tower (EC03 ) was located 35 m to the west of the canopy crane (Paw U et al. 2004, Falk et al. 2005) and EC instrumentation were mounted at a height of 2.5 m above the forest floor. Each EC system consisted of a 3D sonic anemometer/thermometer (Solent HS, Gill Instruments, Lymington, U.K.) and a fast-response nondispersive infrared gas analyzer (IRGA) (LI-6262, Li-Cor, Lincoln, NE) that measured the CO2 and H2O mixing ratios. Half-hourly carbon exchange above the canopy (Fe70; µmol CO2 m – 2 s – 1 ) and below the canopy (Fe03; µmol CO2 m – 2 s – 1 ) were calculated from 10-Hz turbulence data, screened for outliers, gap-filled (using a running-mean approach; Reichstein et al. 2005) and the EC70 data were corrected using a friction velocity (u*)-threshold triggered respiration model for nighttime data above the canopy with a critical u* value of 0.3 m s – 1. The classical assumption is that the EC technique captures all of the ecosystem exchange. However, in forest ecosystems, conditions for valid data acquisition are frequently not fulfilled and storage and advection can play important roles in the scalar fluxes between forests and the atmosphere. This is especially true at night when stable conditions frequently suppress turbulence and invalidate EC measurements, but they can be important at any time of day (Goulden et al. 1996b, Grace et al. 1996, Lee 1998, Paw U et al. 2000). Carbon dioxide storage within the canopy can be a significant component of the ecosystem carbon budget, particularly at night, when turbulence is limited or during early morning hours when stored nighttime CO2 is released from the canopy as the stability regime weakens. The first condition results in
TREE PHYSIOLOGY VOLUME 28, 2008
FLUX PARTITIONING IN AN OLD-GROWTH FOREST
511
Table 1. Symbols, definitions, units and sign conventions. Symbol
Definition
Units
Sign convention
NEE
Net ecosystem exchange
g C m – 2 month – 1 or g C m – 2 year – 1
GPP1 Reco Rsoil Fe03
Gross primary productivity Ecosystem respiration Soil respiration Below-canopy CO2 flux
g C m – 2 month – 1 or g C m – 2 year – 1 g C m – 2 month – 1 or g C m – 2 year – 1 g C m – 2 month – 1 or g C m – 2 year – 1 µmol CO2 m – 2 s – 1
Fe70
Above-canopy CO2 flux
µmol CO2 m – 2 s – 1
Negative: net C uptake by the ecosystem Positive: net C loss by the ecosystem Always positive Always positive Always positive Negative: net C uptake by the understory/soil Positive: net C loss by the understory/soil Negative: C uptake by the ecosystem Positive: C loss by the ecosystem
u* S Ta02 Ts θv NUE ΔC2
Friction velocity Storage carbon flux Air temperature at 2 m Soil temperature Soil water content Net understory exchange Tree canopy net CO2 exchange
m s –1 µmol CO2 m – 2 s – 1 °C °C m3 m – 3 g C m – 2 month – 1 or g C m – 2 year – 1 g C m – 2 month – 1 or g C m – 2 year – 1
1 2
Positive: C flux into the canopy space from below 2.5 m Positive: net C uptake by the tree canopy Negative: net C loss by the tree canopy
GPP = Reco – NEE ΔC = NEE – NUE
an underestimate of the half-hour NEE because CO2 may leave the ecosystem undetected by the IRGA, and the second condition results in an overestimate because the flux includes “a build-up” of nighttime canopy CO2. Storage of CO2 within the canopy was estimated with a time derivative of the CO2 mixing ratio from the above-canopy (67 m) LI-6262. We chose this method over the vertical CO2 profile system on the crane because of data gaps in the latter system. Use of a time derivative to estimate carbon storage assumes that the above-canopy IRGA measurement is representative of the entire canopy air column (Hollinger et al. 1994), but Falk (2005) has shown that there are no significant differences in the storage flux (S) estimated by this method or from the CO2 vertical profile system measurements at the site. Half-hourly NEE is then calculated as the sum of Fe70 and S, although we found that on monthly and annual time scales the storage term integrates to zero and can be ignored in a long-term study. Even daily NEE estimates may be relatively insensitive to storage because the mean CO2 concentration is relatively constant from day-to-day (although greatly varying within a day). A vertical and horizontal advection system for CO2 and water was implemented at the Wind River site as described by Paw U et al. (2004). Advection is estimated to contribute between 10 and 20% of the above-canopy flux at night (Paw U et al. 2004). The percentage from advective divergence terms is predicted to vary depending on mean wind speed, canopy height and effective transfer coefficients (Park and Paw U 2004, Park 2006). The large degree of random scatter made the hourly advection difficult to measure; therefore, because the contribution was small, direct corrections for an advective component were omitted in this study. A further analysis of the direct advection data for extended periods of time is being continued, and preliminary results are compatible with the original measured and modeled estimates of Paw U et al.
(2004), Park and Paw U (2004) and Park (2006). Understory EC measurements were generally made under turbulent conditions, related to the nocturnal radiative balance and modest understory wind speeds at night (Falk 2005, Falk et al. 2005). Although a formal footprint analysis was not carried out for the understory measurements, partly because a proven accurate model is lacking for understory footprints, a study involving several understory EC systems revealed that the EC system used in this study provided an adequate characterization of a larger footprint (Falk et al. 2005). Full details of the methods and corrections have been given by Paw U et al. (2004) and Falk et al. (2005). Analysis periods and micrometeorological data The dataset includes half-hour records for 6 years starting in 1999 through 2004, with all CO2 exchange components integrated to daily, weekly and monthly sums (Paw U et al. 2004, Falk et al. 2005). For each half-hour period, micrometeorological data were taken at heights of 2, 10, 20, 40, 60 and 70 m on the crane tower and included air temperature, relative humidity, net radiation, wind speed and direction. Measurements of soil temperature (Ts; 5, 15 and 30 cm) and soil water content (θv; 0–30 cm) were taken every half-hour near the understory station. We used these data to examine the environmental controls of NEE over half-hourly to daily time scales. Further information about the micrometeorological data can be found in Pyles et al. (2000) and Shaw et al. (2004). All of the micrometeorological data are available at http://depts.washington. edu/wrccrf/. Ecosystem carbon exchange components The objective of our analysis was to detect and quantify seasonal variability in the most significant carbon exchange components using EC data. Daily NEE (g C m – 2 day – 1 ) was calcu-
TREE PHYSIOLOGY ONLINE at http://heronpublishing.com
512
FALK, WHARTON, SCHROEDER, USTIN AND PAW U
lated as the sum of the half-hourly ecosystem CO2 fluxes: NEE =
∑( Fe 70 + S )
(1)
Daily Reco (g C m – 2 day –1 ) was estimated based on an empirically derived exponential fit between half-hourly nighttime Fe70 measured when there was sufficient turbulent mixing (u* > 0.3 m s –1 ) and the 2-m air temperature (Ta02; Paw U et al. 2004): Reco =
∑ a exp( b Ta 02)
(2)
We found that this simple exponential expression for Reco based on temperature overestimated the daily respiration flux observed during the dry season. To correct for this, we added a water-induced respiration-attenuation function triggered by θv to Equation 2: Reco =
∑( y o + c exp(d θv )) a exp( b Ta 02 )
(3)
where the first term on the right-hand side of Equation 3 is the respiration attenuation function and the fit parameters, yo and a–d, are empirically derived from high nighttime turbulent fluxes. The attenuation factor is less than one when θv drops below a critical threshold of 0.2 m3 m – 3 and equals one for θv above the threshold. For further details on the derivation of the expression see Falk et al. (2005). Monthly NEE (g C m – 2 month –1 ) and monthly Reco (g C m – 2 month –1 ) were calculated as the sum of daily NEE and daily Reco, respectively. The NEE and Reco were used to estimate GPP over half-hourly to annual time periods. The sign convention for NEE is negative for net carbon uptake, i.e., the atmosphere is losing CO2 to the biosphere, and positive for net carbon loss by the ecosystem. Under this notation, Reco and GPP are always positive: GPP = Reco − NEE
(4)
In addition, we can estimate the amount of carbon entering the canopy at the bottom based on the below-canopy EC data (Fe03). For details on the understory flux methodology and Fe03 measurements see Falk et al. (2005). The Fe03 data can be integrated to yield a daily and monthly net understory exchange (NUE). Positive NUE indicates carbon moving upward from the soil and understory below the instrument height (2.5 m) into the upper-canopy airspace. At Wind River, NUE is always positive, independent of the integrated time scale because respiration from the soil, woody debris and other forest floor sources is greater than photosynthesis of the understory species (Falk et al. 2005): NUE =
∑ Fe 03
(5)
Canopy carbon exchange (ΔC) is calculated as the difference between NEE and NUE: ΔC = NEE − NUE
(6)
The ΔC term represents both canopy photosynthesis and maintenance respiration by the canopy trees and other plants contained in the canopy space from a height of 2.5 to 67 m. Following atmospheric eddy flux notation, ΔC is negative when the canopy takes up carbon, and positive when Reco exceeds canopy photosynthesis. Standard precipitation index To compare precipitation amounts during flux measurement years to the long-term meteorological record (1919–2004) at Wind River, we used the Standardized Precipitation Index (SPI) created by McKee et al. (1993), a universal statistic for defining and monitoring drought. To calculate the SPI for any site, a long-term precipitation record is fitted to a probability distribution, and transformed to a normal distribution so that the mean SPI (or mean precipitation) for the averaging time period is zero (McKee et al. 1993, Edwards and McKee 1997). Positive SPI values indicate greater than mean precipitation and negative values indicate below average precipitation. The SPI ranges from –3.0 (extremely dry) to +3.0 (extremely wet) and a drought event is defined by the National Drought Mitigation Center as a period when the SPI is continuously negative at a value of –1.0 or less over the time scale of interest. At Wind River, we calculated the SPI over a 6-month and a 3-month period, to identify anomalies in precipitation over different time scales. Here, we used the 3-month SPI to determine seasonal drought and the 6-month SPI to identify precipitation perturbations over the main growing season (March–November).
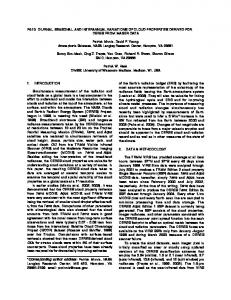
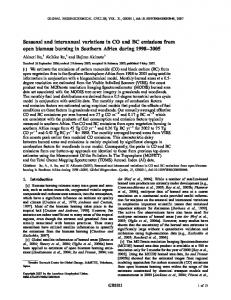
Results Climate variability Without exception, mean minimum temperature (3.1 °C) during the 6-year flux measurement period was higher than the long-term mean (2.5 °C, 1931–1997). The interannual and seasonal variability in mean daily mean temperature has also been high the last 6 years. Dry season (the period when daily maximum θv was consistently below 0.2 m3 m – 3 ) mean temperature ranged from 14.3 °C (2000) to 16.4 °C (2003), whereas the peak growing season (March–June) mean temperature ranged from 8.4 °C (1999) to 10.9 °C (2004) over our measurement period (Table 2). Water-year (July–June) precipitation varied widely across the historical range (Figure 1b), representing years of above normal (July 1998–June 1999), below normal (July 2000–June 2001, July 2003–June 2004) and near normal (July–June 1999–2000, 2001–2002, 2002–2003) precipitation, although all summers except that of 2004 tended to be drier than the historical mean (Figure 1a). The flux measurement period included the driest water-year in the climatological record (1119 mm below normal, July 2000–June 2001). The 6-month SPI for Wind River during the interval 1998–2004 is shown in Figure 2. Table 3 shows 6-month SPI values during the peak growing season, 3-month SPI values during the dry season and annual NEE estimates for
TREE PHYSIOLOGY VOLUME 28, 2008
FLUX PARTITIONING IN AN OLD-GROWTH FOREST
513
Table 2. Climate statistics for Wind River from 1999 to 2004. Dry season precipitation and temperature are measured from June to October and March to June, respectively. Dry season length is the number of days when daily maximum soil water content was consistently below 0.20 m3 m – 3. Year
1999 2000 2001 2002 2003 2004
Dry season length (days) 119 140 112 130 105 44
Percipitation (mm)
Temperature (°C)
Water year
Dry season
Mean annual
Mean annual minimum
Peak growing season
Dry season
2858 2345 1247 2446 2130 1857
218 195 282 55 180 492
8.85 8.30 8.72 8.68 9.74 9.55
3.02 2.57 2.96 2.53 3.71 3.85
8.48 9.67 9.30 9.04 10.25 10.90
14.75 14.26 14.72 14.65 16.40 15.88
1999–2004. The 6-month SPI values indicate that water availability during the peak growing months was near normal during each of these years, with the exception of 2001; although summer precipitation during most years was unusually low. The 3-month SPI values show significant perturbations in summer precipitation in 2002 (very dry, 3-month SPI = –1, cumulative probability = 0.16), 2003 (extremely dry, 3-month SPI = –3, cumulative probability = 0.001) and 2004 (very wet, 3-month SPI = +1.6, cumulative probability = 0.93). Seasonality of carbon fluxes When all years were categorized and averaged by month, maximum carbon uptake was limited to March through May when Reco and water stress were low (Figure 3). Typically, GPP peaked earlier in the year (May) than Reco (July), as observed
Figure 1. (a) Cumulative probability of dry season (July–October) precipitation from 1919 to 2004 at Wind River. (b) Cumulative probability of total water-year precipitation from 1919 to 2004 at Wind River. The long-term mean, 2366 mm, is indicated by the dotted line.
during the normal climate years 2000 and 2002. Ecosystem respiration showed a seasonal pattern but lagged NEE by about 2–3 months. Net ecosystem exchange was most negative in April when photosynthetic fluxes were typically twice as large as respiratory fluxes. Stand-level light response functions show that optimal photosynthetic rates at this site coincided with periods of low temperature and diffuse light, as occurred during the spring (Falk 2005). Interseasonal variability in Reco was high over the 6 years. The spring and summer of 1999 were characterized by reduced respiration of more than 50 g C m – 2 month – 1, whereas the spring of 2003 showed a much earlier rise in respiration approaching peaks of 75 g C m – 2 month – 1 above normal (Figure 4). The seasonal course of soil/understory exchange showed reduced respiration during 1999 and marked increases in 2001 and 2003. This is evident in both the width and height of the respiration peaks during the year. From 1999 to 2004, mean annual Reco and GPP were 1328 and 1378 g C m – 2 year – 1, respectively. Annual deviations in GPP (ΔGPP) and Reco (ΔReco ) from the 6-year means show that 2003 was a source year (ΔReco = +437, ΔGPP = +278 g C m – 2 year – 1 ), whereas suppressed respiration (ΔReco = –212 g C m – 2 year – 1, ΔGPP = –40 g C m – 2 year – 1 ) made 1999 a strong sink year (Figure 5). Highest monthly respiration rates were observed in 2003 and 2004, whereas respiration was lowest in 1999. In 2000, GPP and Reco fluxes were consistently near the
Figure 2. Six-month standardized precipitation indices (SPI) for Wind River for 1998–2004.
TREE PHYSIOLOGY ONLINE at http://heronpublishing.com
514
FALK, WHARTON, SCHROEDER, USTIN AND PAW U
Table 3. Values of standardized precipitation indices (SPI) for 3-month and 6-month SPI compared with annual net ecosystem exchange (NEE). Year
Dry season 3-month SPI
Peak growing season 6-month SPI
NEE
1999 2000 2001 2002 2003 2004
Near normal Near normal Near normal Very dry Extremely dry Very wet
Wet Normal Extremely Dry Normal Normal (wet) Normal (dry)
–217 –42 –30 –98 +100 –9
long-term mean (Figure 6). The two outliers in Figure 6 represent measurements made in summer months. The 1999 summer was unusual with no soil water stress to limit dry-season Reco. In this old-growth forest, there is an inverse correlation between Reco and carbon uptake. The largest reductions in monthly Reco were observed during the 1999 summer and correspond to the greatest anomalies in carbon uptake (Figure 7). The GPP to Reco flux partitioning ratios showed a pattern of net carbon uptake (GPP/Reco > 1) lasting from March through July and peaking in April. The ratios decreased after April until late summer or fall (August through October, depending on year). Interannual variability in seasonal GPP/Reco ratios was high: unusually low spring ratios (corresponding to low carbon uptake rates) were observed in 2003, whereas higher than normal ratios were observed in late spring/early summer 1999 and fall 2002 months (Figure 8). Table 4 shows that net carbon uptake (daily GPP/Reco > 1) occurred more often in 1999 than in any other year, and that the daily ratio was consistently greater than one during the peak growing season. At the other extreme, 2003 had the fewest days of net carbon uptake both annually and during the peak growing season. The largest differences between understory and overstory
Figure 3. Six-year mean monthly gross primary productivity (GPP; 䊊), ecosystem respiration (Reco; 䊏) and net ecosystem exchange (NEE; 䉲) fluxes showing the seasonality differences in peak respiratory, photosynthetic and net ecosystem exchange fluxes. Error bars represent one standard deviation.
Figure 4. (a) Monthly integrated gross primary production (GPP; 䊊), ecosystem respiration (Reco; 䊏) and net ecosystem exchange (NEE; 䉭) fluxes at Wind River from 1999 to 2004. (b) Monthly deviations in GPP, Reco and NEE from the 1999–2004 mean. Both GPP and Reco are represented as positive fluxes and negative NEE represents a net carbon sink or conditions when GPP is greater than Reco.
fluxes were observed during the spring and summer months and approached 150 g C m – 2 month – 1 (Figure 9). The mean CO2 exchange difference between the overstory and understory fluxes (canopy exchange DC) was near zero during the winter, strongly negative (overstory fluxes less than under-
Figure 5. Deviations in annual gross primary productivity (GPP) and ecosystem respiration (Reco) fluxes from the 1999–2004 mean. Linear fit (excluding 1999) shown as the dashed line where ΔReco = 31.0 + 1.41ΔGPP with an r 2 of 0.99.
TREE PHYSIOLOGY VOLUME 28, 2008
FLUX PARTITIONING IN AN OLD-GROWTH FOREST
515
Table 4. Number of days during the year and during the peak growing season (March–June, day of year 60–200) when daily gross primary productivity to ecosystem respiration ratio was greater than 1. Net daily carbon uptake occurred more often in 1999 than in any other year and almost every day during the peak growing season the ratio was greater than one.
Figure 6. Monthly deviations in gross primary productivity (GPP) and ecosystem respiration (Reco) fluxes from the 1999–2004 mean, plotted by year. Outliers are indicated by circles. Linear fit (excluding outliers) shown as the dashed line where ΔReco = –0.74 + 0.64ΔGPP with an r 2 of 0.77.
Year
Annual (365 max)
Peak growing season
1999 2000 2001 2002 2003 2004
227 196 180 206 155 167
129 109 101 101 89 105
story fluxes) in the spring, and positive when overstory fluxes dominate in the summer (Figure 9). Large differences between understory CO2 flux and overstory NEE can generally be attributed to strong photosynthetic uptake of recycled carbon in the canopy above the 3-m EC station (Figure 10). Evidence of water stress on ecosystem carbon exchange The EC70, EC03 and meteorological datasets indicated that dry-season decreases in respiration fluxes can be attributed to seasonal soil drying. We determined that water availability was the driving factor behind the observed decreases in Reco when the following conditions were met: (1) θv fell below 0.20 m3 m – 3 and stayed below this threshold on a continual basis (Falk 2005, Falk et al. 2005), (2) the 3-month SPI was below –1 for three or more continuous months and (3) there was a decrease in midday latent energy flux, indicative of midday stomatal closure (Unsworth et al. 2004). Summer water stress on average attenuated annual Reco by 13% and ranged widely from year to year: 1999 (0%), 2000 (22%), 2001 (20%), 2002 (15%), 2003 (16%) and 2004 (7%) based on the best-fit nonlinear equations (Equations 2 and 3). Figure 11 shows the dif-
Figure 7. Monthly deviations in net ecosystem exchange (NEE) and ecosystem respiration (Reco) fluxes from the 1999–2004 mean, plotted by year. Linear fit shown as the dashed line where ΔNEE = 0.69 + 0.41ΔReco with an r 2 of 0.55.
Figure 8. Monthly gross primary productivity to ecosystem respiration (GPP/Reco) ratio for 1999–2004 and the 6-year mean.
Figure 9. Monthly canopy CO2 fluxes at the 3-m (䊏) and 70-m (䊊) eddy covariance stations showing how CO2 is partitioned within the tall forest canopy. Tree canopy net CO2 exchange (ΔC, 䉱) is also plotted.
TREE PHYSIOLOGY ONLINE at http://heronpublishing.com
516
FALK, WHARTON, SCHROEDER, USTIN AND PAW U
Figure 10. Monthly gross primary productivity (GPP) versus tree canopy net CO2 exchange (ΔC). Linear fit shown as the dashed line where ΔC = −15.06 − 0.51GPP with an r 2 of 0.62.
ference between respiration based on the temperature model (Equation 2) and respiration based on the temperature + respiration attenuation function model (Equation 3) for 2001. During the 2001 dry season, water stress decreased Reco by 30%. Figure 12 compares annual ΔGPP and ΔReco against the water-year precipitation deviations as well as fall ΔGPP and ΔReco against summertime SPI values. As is evident in the right panel, fall respiration was reduced during years following a dry summer (r 2 = 0.96, P < 0.025).
Discussion Effects of seasonal changes in temperature and water availability The results demonstrate that maximum NEE occurred when
temperature and respiration were low, i.e., during the spring (Figure 3). Cross correlation analysis of NEE and precipitation at Wind River showed that net carbon exchange was most significantly correlated with precipitation that fell 100–105 days (~3.5 months) earlier (ρ = –0.52, P < 0.05). April is typically the time when GPP approaches twice the magnitude of Reco. In contrast, when respiration is at a yearly maximum during the warm summer months and photosynthetic rates in the overstory trees are attenuated by high vapor pressure deficit (Chen et al. 2004), reduced NEE was observed. The spring of 2003, however, shows a much earlier rise in respiration approaching above-average values of 75 g C m – 2 month – 1, due to higher temperatures and adequate soil water during the 2002–2003 El Niño event (Figure 4), whereas cooler than normal temperatures in the spring of 1999 during a La Niña phase reduced respiration by more than 50 g C m – 2 month – 1. Enhanced or suppressed respiration had a significant influence on the annual carbon balance of the stand. In years with low overall respiration the stand acts as a strong carbon sink (1999), whereas increased respiratory fluxes in other years can turn the ecosystem into a weak to moderate carbon source (Figure 7). The flux residuals in Figure 4 suggest that Reco is the driving force behind monthly NEE anomalies. The significance of respiration on annual NEE along the North American west coast has been observed previously for an 80-year-old temperate Douglas-fir forest on Vancouver Island, British Columbia (Morgenstern et al. 2004). Similar to our study, Morgenstern et al. (2004) found that interannual variability in NEE was in part caused by differences in Reco among the 4 years. Annual deviations in GPP and Reco in Figure 5 show that 2003 stands out as a source year (ΔReco = + 437, ΔGPP = +278 g C m – 2 year – 1 ), whereas suppressed respiration (ΔReco = –182 g C m – 2 year – 1, ΔGPP = –40 g C m – 2 year – 1 ) made 1999 a strong sink year. The monthly deviations in GPP and Reco (Figure 6) illustrate that respiratory fluxes are coupled to photo-
Figure 11. Time series of ecosystem respiration (Reco; with (䉲) and without (䊊) attenuation factor), soil water content (0–30 cm, θv, 䊐) and soil temperature (5 cm, Ts, 䊏) in 2001 showing the period of water stress (dark vertical lines) and the subsequent attenuated Reco derived from our model.
TREE PHYSIOLOGY VOLUME 28, 2008
FLUX PARTITIONING IN AN OLD-GROWTH FOREST
Figure 12. Scatter plot showing the sensitivity of ecosystem respiration (Reco; 䊊) and gross primary productivity (GPP; 䊏) anomalies to deviations in water-year precipitation (left panel) and fall Reco and GPP anomalies to the 3-month summer standardized precipitation index (SPI; right panel).
synthetic fluxes so that the flux components typically decrease or increase together over a monthly integrated time step, although this is not true for all months (see the outliers in 1999). Carbon fluxes within the understory were always positive, indicating that respiration at the bottom of the canopy was greater than the photosynthetic fluxes from understory vegetation. In contrast, the overstory data show that overall the ecosystem is a net carbon sink throughout the spring and early summer, but becomes a net carbon source during the late summer and fall. At all times of year, the canopy is always a carbon sink, as shown by ΔC (Figure 9). The phase difference between the maximum canopy ΔC photosynthesis, which occurs between May and October, and the understory respiration peak, which occurs between June and August, results in the shift of NEE from sink to source. Canopy ΔC is generally reduced to zero during the winter months when NEE is near equilibrium and NUE is small but positive, and indicates that Fe03 is being recycled within the canopy. Strong canopy sink activity in the spring is indicated by the negative values of ΔC. Effects of weather and climate Short-term (e.g., weekly) effects of water availability on the component carbon fluxes could not be detected with the SPIs as chosen, but a closer examination of the data, as shown in Figure 11, revealed that the old-growth ecosystem responds to changes over shorter time scales. For example, respiration rates were attenuated less by water availability in late August 2001 during a week of rain and lower temperatures than during the weeks before or after. Thus, SPIs were useful for determining seasonal anomalies in precipitation and for linking them to the observed seasonal flux perturbations. Ecosystem respiration was attenuated by both water availability and temperature (lower temperatures occurred during the high precipitation years), whereas GPP was less sensitive to soil water availability, probably because this forest ecosystem maximizes photosynthesis in diffuse light. The left-hand panel in Figure 12 shows what we would expect: GPP and Reco are maximized during normal precipitation years but decrease in unusually dry or wet years for different reasons. In dry
517
years, respiration and photosynthetic rates are both lowered by water limitations, whereas during the wettest year, it is mostly a decrease in Reco (from decreased temperatures) that drives the annual carbon balance. In 2002, 2003 and 2004, the forest switched from moderate sink (–98 g C m – 2 year – 1 ) to moderate source (+100 g C m – 2 year – 1 ) to equilibrium (– 9 g C m – 2 year – 1 ), although precipitation during the peak growing seasons did not deviate significantly from normal during these years. Instead, the high interannual variability during 2002–2004 can be attributed to a combination of extreme perturbations in dry-season precipitation in 2002, 2003 and 2004 and above-average temperatures in 2003 and 2004. Higher than normal GPP/Reco ratios immediately following the intensely dry summer in 2002 indicate that water stress continued to attenuate Reco throughout the fall, whereas irradiance and temperatures enhanced GPP. This provides evidence that the effects of drought on ecosystem carbon exchange in this old-growth forest can last beyond the ~100 day dry season. The dependency of carbon flux terms on climate anomalies is complex and nonlinear because both temperature and precipitation/soil water anomalies are not independent of one another (Figure 12, left panel). Wetter climatic conditions tend to be cooler (spring 1999) whereas drier conditions often accompany warm periods (spring 2004). Uptake of CO2 in northern hemisphere temperate conifer forests typically peaks during June or July (Falge et al. 2002, Valentini et al. 2003), whereas we observed a GPP peak occurring in May at Wind River. Fluxes of GPP at the old-growth forest are limited by water supply during the summer, although during wetter years (1999) we observed that photosynthetic fluxes peaked much later in the year (August) coinciding with peak respiration (Figure 4). Anomalies in respiration and photosynthetic fluxes were mostly positively correlated, i.e., they both increased or both decreased depending on climate perturbations in a manner similar to observations made at EuroFlux sites (Ciais et al. 2005). Even so, anomalies to this trend occurred (see Figure 6 for outliers in 1999) and apparently caused Reco to have a greater impact on NEE variability at this site. Data for two years of flux measurements at the Sylvania Wilderness mixed old-growth forest in the upper Midwest show that overall NEE (–147 g C m – 2 year – 1 in 2002 and –72 g C m – 2 year – 1 in 2003) were significantly lower than at a nearby mature forest site (Desai et al. 2005), most likely because of higher Reco (965 g C m – 2 year – 1 and 883 g C m – 2 year – 1, respectively) at the old-growth site. Desai et al. (2005) state that growing-season Reco had greater interannual variability at the old-growth site compared with the mature forest. In comparison, initial data from the Hainich deciduous oldgrowth forest in central Germany show large but relatively constant Reco (1075 ± 21 g C m – 2 year – 1 ) and large negative NEE (–522 ± 52 g C m – 2 year – 1 ) for 2000–2002 (Knohl et al. 2003, Granier et al. 2007). However, during the extremely dry year of 2003, Reco was significantly reduced (851 g C m – 2 year – 1 ) at the Hainich site but NEE was still large (–475 g C m – 2 year – 1 ) (Granier et al. 2007). Differences in carbon flux
TREE PHYSIOLOGY ONLINE at http://heronpublishing.com
518
FALK, WHARTON, SCHROEDER, USTIN AND PAW U
magnitudes and variability among the old-growth stands may be the result of a combination of site-specific parameters including regional climate regime, biomass, dominant vegetation type (conifer or deciduous or mixed), tree age distribution and growing season length. It is evident that it is difficult to accurately assess the dynamics of the carbon budget of oldgrowth forests based on short (1–2 years) time series of flux measurements because of the observed variability over longer time scales. Limitations of the eddy-covariance method The EC based annual NEE measurements (mean = –50 g C m – 2 year –1, NEE range = +100 g C m – 2 year –1 to –217 g C m – 2 year –1 ) are well within the long-term biometric estimates (mean NEE = –20 g C m – 2 year –1, NEE range = +116 to –156 g C m – 2 year –1 ) shown by Harmon et al. (2004), with the exception of 1999. Net ecosystem exchange of carbon in 1999 (–217 g C m – 2 year –1 ) most likely represents the near-maximum carbon uptake potential of this forest which cannot be detected through biometric inventory estimates that have longer measurement times (5–10 years) at this site. Ecosystem respiration is a major factor in the calculation of GPP, but Reco is the ecosystem partitioning component with the greatest uncertainty because it is a modeled term and hard to measure directly. The assumption that even the modified exponential fit respiration model (Equation 3) holds true during the daytime may not always be valid, as is the case in any EC study. Our estimates of Reco derived from EC data were lower than estimates from long-term biometric data given by Harmon et al. (2004) and Parker et al. (2004). However, earlier work showed that annual estimates of Rsoil derived from understory EC data (1110 ± 150 g C m –1 year –1; Falk et al. 2005) agree well with inventory estimates (914 g C m –1 year – 1; Harmon et al. 2004, Parker et al. 2004) and scaled periodic chamber measurements (1194 g C m –1 year –1; Klopatek 2002). Our GPP estimates were not independently derived from Reco and were lower than the annual value of 2200–2460 g C m – 2 year –1 given by Winner et al. (2004) using a SVAT-model and the 1906 g C m – 2 year –1 given by Harmon et al. (2004) using inventory estimates, but higher than the 1300 g C m – 2 year –1 modeled by Field and Kaduk (2004). Biometric inventories cannot capture seasonal or interannual variability in Reco and GPP because they represent measurements taken over longer time periods. Our EC data show that carbon fluxes are highly sensitive to climate anomalies and are thus higher or lower from year to year. Although an accurate estimate of respiration on the time scales represented in this paper is still difficult, we hope that future measurements and modeling activities can help improve our understanding of the processes involved and constrain our respiration estimates. In conclusion, over the 6 years, we observed high variability in seasonal temperature and precipitation, induced in part, by El Niño (2003) and La Niña (1999) phases. This cycle allowed us to observe the sensitivity of GPP and Reco to seasonal weather perturbations and assess how these component fluxes have an overall impact on NEE. Seasonal to interannual variability in precipitation and the consequent water balance ap-
pears to influence the timing of the switch from photosynthesis-dominance to respiration-dominance, ultimately determining whether the forest is an annual net carbon sink (switches in late summer) or source (switches in early summer). While any global warming and rising soil and biomass temperatures will lead to increased respiration (Raich and Schlesinger 1992, Lloyd and Taylor 1994), drought limitations on summer respiration might be the more important factor in ecosystems such as the one we studied (Anthoni et al. 2002, Reichstein et al. 2002) if droughts increase in length and severity across the Pacific Northwest (Leung et al. 2004). Climate change could result in increased CO2 emissions to the atmosphere by such ancient forests, a particular concern because old-growth forest ecosystems in the Pacific Northwest represent a regional upper limit on carbon storage (Smithwick et al. 2002), and consequently represent a large source of carbon that could be released to the atmosphere. Furthermore, interannual variability in terrestrial ecosystem carbon exchange is a significant factor in the variation in annual global atmospheric CO2 concentration (Houghton 2000). Our results show that the interannual variability in NEE, GPP and Reco at the old-growth conifer Wind River site can be attributed to variation in environmental drivers, especially precipitation and temperature. However, because GPP and Reco respond differentially to climate perturbations depending on the time of year, the resulting variability in NEE is large (317 g C m – 2 year – 1 ) and complex. Recent modeling work suggests that capturing interannual variability in forest NEE with current generation models remains a major challenge (Hanson et al. 2004, Siqueira et al. 2006). Better predictions of future ecosystem carbon exchange will require an improved understanding of the causes of interannual variability in ecosystem response to environmental drivers. Acknowledgments We thank Mark Creighton and Drs. Ken Bible, Dave Shaw and Jerry Franklin for their help in carrying out this research. The authors extend their appreciation to Drs. Dave Hollinger and David Fitzjarrald for their careful critiques and comments. SW gives special thanks to Dr. Nathan Phillips and the entire IUFRO Canopy Processes Working Group Organizing Committee for hosting an amazing workshop. Gratitude also to the Northeastern Ecological Research Consortium for SW’s financial support to attend. This research was supported by the Office of Science (BER), US Department of Energy, through the Western Regional Center of the National Institute for Global Environmental Change (Cooperative Agreement no. DE-FC03-90ER61010). The Wind River Canopy Crane Research Facility is operated under joint sponsorship of the University of Washington and the USDA Forest Service/PNW Station and we acknowledge both for significant support. Any opinions, findings and conclusions or recommendations expressed herein are those of the authors and do not necessarily reflect the view of the DOE.
References Anthoni, P.M., M.H. Unsworth, B.E. Law, J. Irvine, D.D. Baldocchi, S. Van Tuyl and D. Moore. 2002. Seasonal differences in carbon and water vapor exchange in young and old-growth ponderosa pine ecosystems. Agric. For. Meteorol. 111:203–222.
TREE PHYSIOLOGY VOLUME 28, 2008
FLUX PARTITIONING IN AN OLD-GROWTH FOREST Aubinet, M., A. Grelle, A. Ibrom et al. 2000. Estimates of the annual net carbon and water exchange of forests: the EUROFLUX methodology. Adv. Ecol. Res. 30:113–175. Baldocchi, D.D. 2003. Assessing the eddy covariance technique for evaluating carbon dioxide exchange rates of ecosystems: past, present and future. Global Change Biol. 9:479–492. Baldocchi, D.D. and T.P. Meyers. 1991. Trace gas-exchange above the floor of a deciduous forest. 1. Evaporation and CO2 efflux. J. Geophys. Res. 96:7271–7285. Baldocchi, D.D., J. Finnigan, K. Wilson, K.T. Paw U and E. Falge. 2000. On measuring net ecosystem carbon exchange over tall vegetation on complex terrain. Boundary-Layer Meteorol. 96:257–291. Baldocchi, D.D., E. Falge, L.H. Gu et al. 2001. FLUXNET: a new tool to study the temporal and spatial variability of ecosystem-scale carbon dioxide, water vapor, and energy flux densities. Bull. Am. Meteorol. Soc. 82:2415–2434. Barford, C.C, S.C. Wofsy, M.L. Goulden et al. 2001. Factors controlling long and short term sequestration of atmospheric CO2 in a mid-latitude forest. Science 294:1688–1691. Black, T.A., G. DenHartog, H.H. Neumann et al. 1996. Annual cycles of water vapour and carbon dioxide fluxes in and above a boreal aspen forest. Global Change Biol. 2:219–229. Chen, J.Q., K.T. Paw U, S.L. Ustin, T.H. Suchanek, B.J. Bond, K.D. Brosofske and M. Falk. 2004. Net ecosystem exchanges of carbon, water, and energy in young and old-growth Douglas-fir forests. Ecosystems 7:534–544. Ciais, P., M. Reichstein, N. Viovy et al. 2005. Europe-wide reduction in primary productivity caused by the heat and drought in 2003. Nature 437:529–533. Desai, A.R., P.V. Bolstad, B.D. Cook, K.J. Davis and E.V. Carey. 2005. Comparing net ecosystem exchange of carbon dioxide between an old-growth and mature forest in the upper Midwest, USA. Agric. For. Meteorol. 128:33–55. Edwards, D.C. and T.B. McKee. 1997. Characteristics of 20th century drought in the United States at multiple time scales. Climatology Report Number 97–2, Colorado State University, Fort Collins, 155 p. Falge, E., D.D. Baldocchi, J. Tenhunen et al. 2002. Seasonality of ecosystem respiration and gross primary production as derived from FLUXNET measurements. Agric. For. Meteorol. 113:53–74. Falk, M. 2005. Carbon and energy exchange between an old-growth forest and the atmosphere. Ph.D. Diss., University of California, Davis, 216 p. Falk, M., K.T. Paw U, S. Wharton and M. Schroeder. 2005. Is soil respiration a major contributor to the carbon budget within a Pacific Northwest old-growth forest? Agric. For. Meteorol. 135:269–283. Field, C.B. and J. Kaduk. 2004. The carbon balance of an old-growth forest: building across approaches. Ecosystems 7:525–533. Flanagan, L.B., L.A. Wever and P.J. Carlson. 2002. Seasonal and interannual variation in carbon dioxide exchange and carbon balance in a northern temperate grassland. Global Change Biol. 8: 599–615. Gao, W., R.H. Shaw and K.T. Paw U. 1989. Observation of organized structure in turbulent-flow within and above a forest canopy. Boundary-Layer Meteorol. 47:349–377. Goulden, M.L., J.W. Munger, S.M. Fan, B.C. Daube and S.C. Wofsy. 1996a. Measurements of carbon sequestration by long-term eddy covariance: methods and a critical evaluation of accuracy. Global Change Biol. 2:169–182. Goulden, M.L., J.W. Munger, S.M. Fan, B.C. Daube and S.C. Wofsy. 1996b. Exchange of carbon dioxide by a deciduous forest: response to interannual climate variability. Science 271:1576–1578.
519
Grace, J., Y. Malhi, J. Lloyd, J. McIntyre, A.C. Miranda, P. Meir and H.S. Miranda. 1996. The use of eddy covariance to infer the net carbon dioxide uptake of Brazilian rain forest. Global Change Biol. 2:209–217. Granier, A., M. Reichstein, N. Bréda et al. 2007. Evidence for soil water control on carbon and water dynamics in European forests during the extremely dry year: 2003. Agric. For. Meteorol. 143: 123–145. Hanson, P.J., J.S. Amthor, S.D. Wullschleger et al. 2004. Oak forest carbon and water simulations: model intercomparisons and evaluations against independent data. Ecol. Monogr. 74:443–489. Harmon, M.E., K. Bible, M.G. Ryan, D.C. Shaw, H. Chen, J. Klopate and X. Li. 2004. Production, respiration, and overall carbon balance in an old-growth Pseudotsuga-tsuga forest ecosystem. Ecosystems 7:498–512. Hollinger, D.Y. and A.D. Richardson. 2005. Uncertainty in eddy covariance measurements and its application to physiological models. Tree Physiol. 25:873–885. Hollinger, D.Y., F.M. Kelliher, J.N. Byers, J.E. Hunt, T.M. McSeveny and P.L. Weir. 1994. Carbon dioxide exchange between an undisturbed old-growth temperate forest and the atmosphere. Ecology 75:134–150. Houghton, R.A. 2000. Interannual variability in the global carbon cycle. J. Geophys. Res. 105:20,121–20,130. Hui, D.F., Y.Q. Luo and G. Katul. 2003. Partitioning interannual variability in net ecosystem exchange between climatic variability and functional change. Tree Physiol. 23:433–442. Klopatek, J.M. 2002. Belowground carbon pools and processes in different age stands of Douglas-fir. Tree Physiol. 22:197–204. Knohl, A., E.D. Schulze, O. Kolle and N. Buchmann. 2003. Large carbon uptake by an unmanaged 250-year-old deciduous forest in Central Germany. Agric. For. Meteorol. 118:151–167. Lavigne, M.B., M.G. Ryan, D.E. Anderson et al. 1997. Comparing nocturnal eddy covariance measurements to estimates of ecosystem respiration made by scaling chamber measurements at six coniferous boreal sites. J. Geophys. Res. 102:28,977–28,985. Law, B.E., E. Falge, L. Gu et al. 2002. Environmental controls over carbon dioxide and water vapor exchange of terrestrial vegetation. Agric. For. Meteorol. 113:97–120. Lee, X.H. 1998. On micrometeorological observations of surface–air exchange over tall vegetation. Agric. For. Meterol. 91:39–49. Leung, L.R., Y. Qian, X.D. Bian, W.M. Washington, J.G. Han and J.O. Roads. 2004. Mid-century ensemble regional climate change scenarios for the western United States. Climate Change 62: 75–113. Lloyd, J. and J.A. Taylor. 1994. On the temperature-dependence of soil respiration. Funct. Ecol. 8:315–323. Massman, W.J. and X. Lee. 2002. Eddy covariance flux corrections and uncertainties in long-term studies of carbon and energy exchanges. Agric. For. Meteorol. 113:121–144. McKee, T.B., N.J. Doesken and J. Kleist. 1993. The relationship of drought frequency and duration to time scales. Eighth Conf. Appl. Climatol., Anaheim, CA, pp 179–184. Misson, L., D.D. Baldocchi, T.A. Black et al. 2007. Partitioning forest carbon fluxes with overstory and understory eddy-covariance measurements: a synthesis based on FLUXNET data. Agric. For. Meteorol. 144:14–31. Morgenstern, K., T.A. Black, E.R. Humphreys et al. 2004. Sensitivity and uncertainty of the carbon balance of a Pacific Northwest Douglas-fir forest during an El Niño La Niña cycle. Agric. For. Meteorol. 123:201–219. Park, Y.-S. 2006. Numerical study of scalar advection in canopies using a higher-order closure model. Ph.D. Diss., Univ. California, Davis, 123 p.
TREE PHYSIOLOGY ONLINE at http://heronpublishing.com
520
FALK, WHARTON, SCHROEDER, USTIN AND PAW U
Park, Y.-S. and K.T. Paw U. 2004. Numerical estimations of horizontal advection inside canopies. J. Appl. Meteorol. 43:1530–1538. Parker, G.G., M.M. Davis and S.M. Chapotin. 2002. Canopy light transmittance in Douglas-fir-western hemlock stands. Tree Physiol. 22:147–157. Parker, G.G., M.E. Harmon, M.A. Lefsky et al. 2004. Three-dimensional structure of an old-growth Pseudotsuga-Tsuga canopy and its implications for radiation balance, microclimate and gas exchange. Ecosystems 7:440–453. Paw U, K.T., D.D. Baldocchi, T.P. Meyers and K. Wilson. 2000. Correction of eddy-covariance measurements incorporating both advective effects and density fluxes. Boundary-Layer Meteorol. 97: 487–511. Paw U, K.T., M. Falk, T.H. Suchanek et al. 2004. Carbon dioxide exchange between an old-growth forest and the atmosphere. Ecosystems 7:513–524. Pyles, R.D., B.C. Weare and K.T. Paw U. 2000. The UCD advanced canopy-atmosphere-soil algorithm: comparisons with observations from different climate and vegetation regimes. Quart. J. Roy. Meteorol. Soc. 126:2951–2980. Raich, J.W. and W.H. Schlesinger. 1992. The global carbon dioxide flux in soil respiration and its relationship to vegetation and climate. Tellus Ser. B Chem. Phys. Meteorol. 44:81–99. Reichstein, M., J.D. Tenhunen, O. Roupsard, J.M. Ourcival, S. Rambal, S. Dore and R. Valentini. 2002. Ecosystem respiration in two Mediterranean evergreen holm oak forests: drought effects and decomposition dynamics. Funct. Ecol. 16:27–39. Reichstein, M., E. Falge, D. Baldocchi et al. 2005. On the separation of net ecosystem exchange into assimilation and ecosystem respiration: review and improved algorithm. Global Change Biol. 11: 1424–1439.
Richardson, A.D., D.Y. Hollinger, G.G. Burba et al. 2006. A multisite analysis of random error in tower-based measurements of carbon and energy fluxes. Agric. For. Meteorol. 136:1–18. Shaw, D.C., J.F. Franklin, K. Bible, J. Klopatek, E. Freeman, S. Greene and G.G. Parker. 2004. Ecological setting of the Wind River old-growth forest. Ecosystems 7:427–439. Siqueira, M.B., G.G. Katul, D.A. Sampson, P.C. Stoy, J.Y. Juang, H.R. McCarthy and R. Oren. 2006. Multiscale model intercomparisons of CO2 and H2O exchange rates in a maturing southeastern U.S. pine forest. Global Change Biol. 12:1189–1207. Smithwick, E.A.H., M.E. Harmon, S.M. Remillard, S.A. Acker and J.F. Franklin. 2002. Potential upper bounds of carbon stores in forests of the Pacific Northwest. Ecol. Appl. 12:1303–1317. Unsworth, M.H., N. Phillips, T. Link, B.J. Bond, M. Falk, M.E. Harmon, T.M. Hinckley, D. Marks and K.T. Paw U. 2004. Components and controls of water flux in an old-growth Douglas fir-western hemlock ecosystem. Ecosystems 7:468–481. Urbanski, S., C. Barford, S. Wofsy et al. 2007. Factors controlling CO2 exchange on timescales from hourly to decadal at Harvard Forest. J. Geophys. Res. 112:G02020. Valentini, R., G. Matteucci, A.J. Dolman et al. 2000. Respiration as the main determinant of carbon balance in European forests. Nature 404:861–865. Valentini, R., G. Matteucci, A.J. Dolman, E.-D. Schulze and P.G. Jarvis. 2003. The carbon sink strength of forests in Europe: a synthesis of results. In Fluxes of Carbon, Water and Energy of European forests. Ed. R. Valentini. Ecol. Stud. 163:225–232. Winner, W.E., S.C. Thomas, J.A. Berry et al. 2004. Canopy carbon gain and water use: analysis of old-growth conifers in the Pacific Northwest. Ecosystems 7:482–497. Xu, L.K. and D.D. Baldocchi. 2004. Seasonal variation in carbon dioxide exchange over a Mediterranean annual grassland in California. Agric. For. Meteorol. 123:79–96.
TREE PHYSIOLOGY VOLUME 28, 2008