nutrients Article
Food Matrix Effects of Polyphenol Bioaccessibility from Almond Skin during Simulated Human Digestion Giuseppina Mandalari 1,2, *, Maria Vardakou 2 , Richard Faulks 2 , Carlo Bisignano 1 , Maria Martorana 1 , Antonella Smeriglio 1 and Domenico Trombetta 1 1
2
*
Dipartimento di Scienze Chimiche, Biologiche, Farmaceutiche ed Ambientali, University of Messina, Sal. Sperone 31, 98166 Messina, Italy;
[email protected] (C.B.);
[email protected] (M.M.);
[email protected] (A.S.);
[email protected] (D.T.) The Model Gut, Institute of Food Research, Norwich Research Park, Colney Lane, Norwich NR4 7UA, UK;
[email protected] (M.V.);
[email protected] (R.F.) Correspondence:
[email protected]; Tel.: +39-90-676-6593
Received: 11 July 2016; Accepted: 18 August 2016; Published: 15 September 2016
Abstract: The goal of the present study was to quantify the rate and extent of polyphenols released in the gastrointestinal tract (GIT) from natural (NS) and blanched (BS) almond skins. A dynamic gastric model of digestion which provides a realistic simulation of the human stomach was used. In order to establish the effect of a food matrix on polyphenols bioaccessibility, NS and BS were either digested in water (WT) or incorporated into home-made biscuits (HB), crisp-bread (CB) and full-fat milk (FM). Phenolic acids were the most bioaccessible class (68.5% release from NS and 64.7% from BS). WT increased the release of flavan-3-ols (p < 0.05) and flavonols (p < 0.05) from NS after gastric plus duodenal digestion, whereas CB and HB were better vehicles for BS. FM lowered the % recovery of polyphenols, the free total phenols and the antioxidant status in the digestion medium, indicating that phenolic compounds could bind protein present in the food matrix. The release of bioactives from almond skins could explain the beneficial effects associated with almond consumption. Keywords: almond skin; food matrix; simulated human digestion; polyphenols; bioaccessibility
1. Introduction The presence of polyphenols in almond skin has been related to several health benefits associated with almond (Prunus dulcis Miller D.A. Webb) consumption [1–3]. The antioxidant and free-radical scavenging activity of almond skin polyphenols has been reported [4]. It has been shown that flavonoids and phenolic acids, including flavonols, flavanols, flavanones and simple phenolic acids identified in almond skins may play a role in reducing risk factors against chronic inflammatory diseases and ageing disorders [5,6]. A range of biological effects of flavonoids, including anticancer, antiviral, antimutagenic and anti-inflammatory activities, have been reported [7,8]. Nevertheless, one of the major limiting factors affecting the beneficial effects of polyphenols is their bioaccessibility and subsequent absorption in the gastrointestinal tract (GIT), together with their bio-transformation by the gut microbiota enzymes [9]. This process depends on the physico-chemical properties of the food matrix and its changes during digestion. We refer to bioaccessibility as the proportion of a nutrient or phytochemical compound ‘released’ from a complex food matrix during digestion and therefore becoming potentially available for absorption in the GIT. A number of studies have reported that food matrix affects polyphenol release in the gut as well as the efficacy by which they are transported across the mucosal epithelium [10,11]. The presence of a food matrix (muffin) decreased the bioaccessibility of certain bioactive compounds, such as protocatechuic acid and luteolin, from raw shelled and roasted salted pistachios during Nutrients 2016, 8, 568; doi:10.3390/nu8090568
www.mdpi.com/journal/nutrients
Nutrients 2016, 8, 568
2 of 17
simulated human digestion [12]. Interaction with other food nutrients and the formation of complexes mainly with protein and fat is also known to affect bioaccessibility of phenolic acids [13]. The influence of digestion conditions, such as pH, temperature, bile salts, gastric and pancreatic enzymes on the bioaccessibility of certain polyphenols has been reported [14,15]. Milk has been found to affect bioaccessibility of epicatechin metabolites [16]. We have previously identified a combination of flavonols, flavan-3-ols, hydroxybenzoic acids and flavanones present in almond skin [1]: the major flavonoids were (+)-catechin, (−)-epicatechin, kaempferol and isorhamnetin, both as aglycones or conjugated with rhamnose (Rha) and glucose (Glc). The total phenolic content, expressed as mg gallic acid equivalents (GAE) per 100 g of fresh skin, was higher in natural almond skin (NS, 3474.1 ± 239.8) than blanched almond skin (BS, 278.9 ± 12.0). The blanching process is known to remove most of the water-soluble flavonoids and other polyphenols [1]. BS, obtained by industrial blanching, currently represents a commercially available product. Our previous investigation on the release of almond skin polyphenols during simulated human digestion using a static model demonstrated higher percentages of polyphenols released from NS compared to BS [17]. The aim of the present study was to assess the effect of a range of food matrices on the rate and extent of polyphenol bioaccessibility from NS and BS during simulated human digestion. A dynamic gastric model (DGM) was used to simulate the human stomach [12,18]. Gastric digesta were then subjected to a duodenal phase in order to simulate the full human upper GIT. 2. Materials and Methods 2.1. Production of Test Meals Natural almonds with intact skin were kindly provided by the Almond Board of California and stored in the dark. NS was removed using liquid-nitrogen as previously reported and milled [17]. BS, provided by ABCO laboratories, was obtained by hot water blanching, dried and powdered. Home-made biscuits (HB) containing NS or BS were prepared using the following ingredients: white flour (200 g), butter at room temperature (100 g), sugar (sucrose, 100 g), eggs (one standard egg) and baked at 180 ◦ C for 12 min. For the digestion experiments, 25 g of HB containing 2 g of either NS or BS were used. Home-made crisp-bread (CB) containing NS or BS was prepared using the following ingredients: baking soda (5 g), hot water (400 mL), salt (1.2 g), fennel seed (1 g), white flour (250 g) and baked at 230 ◦ C for 2–4 min. For the digestion experiments, 34 g of CB containing 2 g of either NS or BS were used. 2.2. Chemicals and Enzymes Egg L-α-phosphatidylcholine (PC, lecithin grade 1, 99% purity) was obtained from Lipid Products (South Nutfield, Surrey, UK). Porcine gastric mucosa pepsin, bovine α-chymotrypsin, pancreatic α-amylase, porcine colipase, porcine pancreatic lipase and bile salts were obtained from Sigma (Poole, Dorset, UK). Lipase for the gastric phase of digestion was a gastric lipase analogue of fungal origin (F-AP15) from Amano Enzyme Inc. (Nagoya, Japan). All flavonoid and other phytochemical standards were obtained from either Sigma-Aldrich (Poole, UK) or Extrasynthese (Genay, France). All solvents were HPLC grade, water was ultra-pure grade, and other chemicals were of AR quality. 2.3. Simulated Human Digestion Eight meals were prepared as follows and subjected to in vitro gastric and gastric plus duodenal digestion: WT (200 mL) containing either NS (2 g) or BS (2 g), HB (25 g) containing either NS (2 g) or BS (2 g) added to water (240 mL), CB (34 g) containing either NS (2 g) or BS (2 g) added to water (240 mL), FM (200 mL) containing either NS (2 g) or BS (2 g).
Nutrients 2016, 8, 568
3 of 17
2.4. Gastric Digestion Individual meals were fed onto the DGM in the presence of priming acid (20 mL), as previously reported [18]. In order to replicate the conditions found in the human stomach, samples were processed in two zones: within the fundus/main body of the DGM, where the meals were subjected to inhomogeneous mixing while gastric acid and enzyme secretions were added; in the antrum, where physiological shear and grinding forces were applied in order to mimic the antral shearing and rate of delivery to the duodenum. The composition of the simulated gastric acid solution has also been previously reported [12]. The simulated gastric enzyme solution was prepared by dissolving porcine gastric mucosa pepsin and a gastric lipase analogue from Rhizopus oryzae in the above described salt mixture (no acid) at a final concentration of 9000 U/mL and 60 U/mL for pepsin and lipase, respectively. A suspension of single-shelled lecithin liposomes was added to the gastric enzyme solution at a final concentration of 0.127 mM. A total of six samples (G1–G6) were ejected from the antrum of the DGM at regular intervals during each run (see Table 1 for sampling details) in order to replicate the predicted gastric emptying regimes under physiological conditions. Samples digested in WT were ejected from the antrum of the DGM every 4 min: the amount of gastric acid secretion was 1.5 ± 0.1 mL and 1.6 ± 0.1 mL for NS and BS respectively; the amount of gastric enzyme secretion was 2.8 ± 0.1 mL and 2.7 ± 0.1 mL for NS and BS respectively. Samples digested in HB were ejected from the antrum of the DGM every 4 min: the amount of gastric acid secretion was 6.4 ± 0.1 mL and 6.3 ± 0.1 mL for NS and BS respectively; the amount of gastric enzyme secretion was 11.2 ± 0.2 mL and 11.4 ± 0.1 mL for NS and BS respectively. Samples digested in CB were ejected from the antrum of the DGM every 5 min: the amount of gastric acid secretion was 17.6 ± 0.2 mL and 18.2 ± 0.2 mL for NS and BS respectively; the amount of gastric enzyme secretion was 13.8 ± 0.1 mL and 14.2 ± 0.2 mL for NS and BS respectively. Samples digested in FM were ejected from the antrum of the DGM every 6 min: the amount of gastric acid secretion was 4.4 ± 0.2 mL and 4.6 ± 0.2 mL for NS and BS respectively; the amount of gastric enzyme secretion was 13.1 ± 0.3 mL and 13.8 ± 0.2 mL for NS and BS respectively. A control digestion without addition of gastric enzymes was performed for each meal. Each gastric sample was weighed, its pH recorded and adjusted to 7.0 with NaOH (1 M) in order to inhibit gastric enzyme activity. Table 1. Simulated human digestion parameters.
Matrix Water Home-made biscuit Crisp bread Full-fat milk
DGM 1
DGM 2
DGM 3
DGM 4
DGM 5
DGM 6
DD
TDT
Sampling Time (min) 4
8
12
16
20
24
120
144
4
8
12
16
20
24
120
144
5 6
10 12
15 18
20 24
25 30
30 36
120 120
150 156
DGM = Gastric sample; DD = Duodenal digestion; TDT = Total digestion time.
2.5. Duodenal Digestion Individual gastric samples (23 g, G1 to G6) were transferred upon ejection, to a Sterilin plastic tube for duodenal digestion with the addition of simulated bile solution (2.5 mL) and pancreatic enzyme solution (7.0 mL) and incubated at 37 ◦ C under shaking conditions (170 rpm) for 2 h. Simulated bile was prepared fresh daily. It contained lecithin (6.5 mM), cholesterol (4 mM), sodium taurocholate (12.5 mM), and sodium glycodeoxycholate (12.5 mM) in a solution containing NaCl (146.0 mM), CaCl2 (2.6 mM) and KCl (4.8 mM). Pancreatic enzyme solution contained NaCl (125.0 mM), CaCl2 (0.6 mM), MgCl2 (0.3 mM), and ZnSO4 ·7H2 O (4.1 µM). Porcine pancreatic lipase (590 U/mL), porcine colipase (3.2 µg/mL),
Nutrients 2016, 8, 568
4 of 17
porcine trypsin (11 U/mL), bovine α-chymotrypsin (24 U/mL) and porcine α-amylase (300 U/mL) were added to the pancreatic solution. 2.6. Poliphenols Extraction from Samples before and after Dynamic in Vitro Digestion All original samples (WT, HB, CB and FM containing NS or BS) and aliquotes obtained from each sample subjected to a dynamic in vitro gastric digestion (NSWT G, NSHB G, NSCB G, NSFM G, BSWT G, BSHB G, BSCB G, BSFM G) and gastric plus duodenal digestion (NSWT G + D, NSHB G + D, NSCB G + D, NSFM G + D, BSWT G + D, BSHB G + D, BSCB G + D, BSFM G + D), were harvested and centrifuged to separate the residual material from the supernatant. The volume of each supernatant was measured; the residues were dried in a forced air heated oven (T ◦ C < 40 ◦ C) and brought to constant weight. Each residue was extracted with hexane (1:5, w/v) to remove the lipid fraction. The procedure was repeated 3 times. Afterwards it was extracted with a methanol/water mixture (70:30) (1:10, w/v) by shaking for 5 min and sonicating for 10 min. After centrifugation at 12,074 rcf for 10 min, the supernatant was collected. The procedure was repeated 3 times. The supernatants were pooled. In order to precipitate proteins, MeOH (8 mL) and 2M NaOH (600 µL) were added in 10 mL extract. Samples were stirred vigorously and after centrifugation at 5916 rcf for 5 min the supernatant was brought to dryness in a rotavapor. Finally, the residue was resuspended with 10 mL of 1% HCl in MeOH and extracted, using a separatory funnel, with the same volume of ethyl acetate. The extraction was repeated 4 times. The ethyl acetate fractions were combined and evaporated to dryness in a rotavapor. The residue was weighed, solubilised in MeOH, filtered through a Nalgene 0.22 µM nylon filter and subjected to total phenol, radical scavenging activity and HPLC analysis. For NS and BS digested in water no protein precipitation step was perfermed, given that they were not incorporated into any food matrix. 2.7. Polyphenols Release and Radical Scavenging Activity Total phenol content was determined colorimetrically by the Folin-Ciocalteu method as modified by Singleton, Orthofer and Lamuela-Raventos [19] using gallic acid as a reference compound. Total phenol content was expressed as mg of gallic acid equivalents (GAE) per 100 g of sample. The anti-radical activity was determined using the stable 2,2-diphenyl-1-picrylhydrazyl radical (DPPH) and the procedure previously described [20]. Results were expressed as mg of extract needed to scavenge 50 µmol of the initial DPPH concentration (SE50). The determination of phenolics and flavonoids was carried out using a Shimadzu high performance liquid chromatography system equipped with an UV–Vis photodiode-array detector (DAD) (SPD-M10AVP, Shimadzu, Kyoto, Japan) and a fluorescence detector (1046A Hewlett Packard, Palo Alto, CA, USA), as previously reported [17]. 2.8. Statistical Analysis All assays were performed in triplicate and expressed as means ± standard deviation (SD). Data analysis was performed using ANOVA tests using SigmaPlot software version 12.0 for Windows (SPSS Inc., Hong Kong, China). To isolate the group or groups that differ from the others, a multiple comparison procedure (Tukey Test) was used. Results were considered statistically significant at p < 0.05. 3. Results 3.1. Polyphenols Release during Simulated Digestion The polyphenolic content of the baseline meals (NS WT, NS HB, NS CB and NS FM, BS WT, BS HB, BS CB and BS FM) is reported in Table 2. As expected, the NS meals had a total phenol content nearly ten times higher than the BS meals.
Nutrients 2016, 8, 568
5 of 17
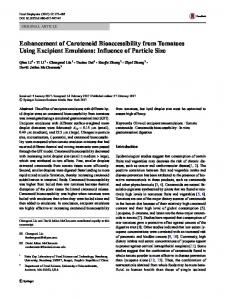
The release of polyphenols as a percentage of the original amount present in each meal (Table 2) after simulated gastric plus duodenal digestion is reported in Figure 1. No polyphenols were detected in blank samples of each meal not containing almond skin. As expected, a high release of bioactive compounds was observed from both NS and BS in WT (Figure 1A). Table 2. Baseline polyphenols content of natural skins and blanched skins in water (W); home-made biscuits (HB); crisp-bread (CB) and full-fat milk (FM). Values were given as µg/g and represent averages (±SD) of triplicate measurements. Natural Skin Sample W HB CB FM
Phenolic acids 2.15 ± 0.11 17.85 ± 1.02 12.53 ± 0.89 2.07 ± 0.12
Flavonols 14.31 ± 1.05 115.30 ± 8.32 83.89 ± 4.22 13.95 ± 1.22
Sample W HB CB FM
Phenolic acids 0.31 ± 0.02 2.25 ± 0.14 1.78 ± 0.12 0.29 ± 0.01
Flavonols 1.28 ± 0.05 9.82 ± 0.59 7.24 ± 0.35 1.19 ± 0.08
Flavan-3-ols 2.37 ± 0.18 20.82 ± 1.65 14.72 ± 1.12 2.15 ± 0.12
Flavanones 3.43 ± 0.22 30.44 ± 2.21 21.78 ± 1.44 3.22 ± 0.17
Total phenols 22.26 184.41 132.92 21.39
Flavanones 0.22 ± 0.02 1.73 ± 0.102 1.31 ± 0.09 0.19 ± 0.01
Total phenols 2.43 18.98 13.98 2. 27
Blanched Skin Flavan-3-ols 0.62 ± 0.03 5.18 ± 0.21 3.65 ± 0.25 0.60 ± 0.02
The % release from NS and BS in WT during the gastric phase of digestion was higher for phenolic acids (47.1% from NS and 45.3% from BS) compared with the other classes of polyphenols, with a further increase in the duodenal phase of digestion (68.5% from NS and 64.7% from BS). Lower % release from BS in WT was observed with flavanones after both gastric (29.3%) and gastric plus duodenal incubation (48.2%). Higher release of flavonols (65.6%) and phenolic acids (59.4%) was observed after in vitro gastric plus duodenal digestion from NS (Figure 1A). The % of recovery, calculated from the amount of polyphenols present in the medium at the end of each step of digestion, confirmed the data obtained from the % of release (Figure 2). This data demonstrated a different bioaccessibility across the various classes of polyphenols in the absence of an interfering food matrix. In accordance with our previous investigation [1], high release of polyphenols was detected when NS and BS were incubated in WT. However, the static and dynamic digestion models used affected the rate and extent of bioactives potentially available for absorption in the gut. The % of release and recovery of polyphenols from NS and BS incorporated into HB are reported in Figures 1B and 2, respectively. Phenolic acids were the class of polyphenols mostly released from NS in the gastric phase, followed by flavonols and flavanones, with an average % release of 40.72 in the gastric compartment. Flavonols had the highest % release from BS in the gastric phase (48.5), followed by flavanones and phenolic acids. For both NS and BS, the gastric + duodenal digestion (G + D) produced only a slight increase in polyphenol release over that observed in the gastric compartment. In addition, higher percentages of phenolic acids and flavonols were released from NSHB G + D. Higher % of release of phenolic acids, flavonols, flavan-3-ols and flavanones were observed in BSCB G compared with NSCB G, whereas the opposite behaviour was detected in the duodenal phase (Figure 1C). A higher release of phenolic acids was observed in BSCB G (52.7%) compared with BSWT G (45.3%), as well as flavonols both in the gastric (51.4 in BSCB G vs. 33.9 in BSWT G) and in the duodenal phase (63.9 in BSCB G + D vs. 52.3 in BSWT G + D) and flavanones both in the gastric (47.6 in BSCB G vs. 29.3 in BSWT G) and in the duodenal phase (59.8 in BSCB G + D vs. 48.2 in BSWT G + D). The % release data were confirmed by % recovery values (Figure 2). The % of release and recovery of flavonoids and phenolic acids from NS and BS incorporated into FM are reported in Figures 1D and 2, respectively. The highest % release from NS was detected with flavonols after gastric plus duodenal digestion, followed by flavanones and phenolic acids. About 60% of phenolic acids and flavanones were released from BS in FM after simulated digestion.
Nutrients 2016, 8, 568 Nutrients 2016, 8, 568
6 of 17 6 of 17
Figure Release of of flavonoids flavonoids and and phenolic phenolic acids acids from from natural natural almond almond skin Figure 1. 1. Release skin (NS) (NS) and and blanched blanched almond skin (BS) in water (A); home-made biscuits (B); crisp-bread (C) and full-fat milk (D). Values are almond skin (BS) in water (A), home‐made biscuits (B), crisp‐bread (C) and full‐fat milk (D). Values given as % phenolic acids, flavanols, flavan-3-ols and flavanones released from the initial amounts are given as % phenolic acids, flavanols, flavan‐3‐ols and flavanones released from the initial amounts presents in the meals (Table 2) during in vitro gastric (G) and gastric + duodenal (G + D) digestion. presents in the meals (Table 2) during in vitro gastric (G) and gastric + duodenal (G + D) digestion. Values represent averages (±SD) of triplicate measurements. Matching symbols across the four panels Values represent averages (±SD) of triplicate measurements. Matching symbols across the four panels † Phenolic acid release in BS-G + D significantly indicate acid release in BS‐G + D significantly indicate significantly significantly different different (p (p