Biogeosciences, 14, 1403–1417, 2017 www.biogeosciences.net/14/1403/2017/ doi:10.5194/bg-14-1403-2017 © Author(s) 2017. CC Attribution 3.0 License.
Forage quality declines with rising temperatures, with implications for livestock production and methane emissions Mark A. Lee1 , Aaron P. Davis1 , Mizeck G. G. Chagunda2 , and Pete Manning3 1 Natural
Capital and Plant Health, Royal Botanic Gardens, Kew, Richmond, Surrey TW9 3AB, UK Farming Systems, Scotland’s Rural College, King’s Buildings, Edinburgh EH9 3JG, UK 3 Biodiversity and Climate Research Centre, Senckenberg, Senckenberganlage 25, 60325 Frankfurt am Main, Germany 2 Future
Correspondence to: Mark A. Lee (
[email protected]) Received: 13 September 2016 – Discussion started: 22 September 2016 Revised: 1 March 2017 – Accepted: 4 March 2017 – Published: 26 March 2017
Abstract. Livestock numbers are increasing to supply the growing demand for meat-rich diets. The sustainability of this trend has been questioned, and future environmental changes, such as climate change, may cause some regions to become less suitable for livestock. Livestock and wild herbivores are strongly dependent on the nutritional chemistry of forage plants. Nutrition is positively linked to weight gains, milk production and reproductive success, and nutrition is also a key determinant of enteric methane production. In this meta-analysis, we assessed the effects of growing conditions on forage quality by compiling published measurements of grass nutritive value and combining these data with climatic, edaphic and management information. We found that forage nutritive value was reduced at higher temperatures and increased by nitrogen fertiliser addition, likely driven by a combination of changes to species identity and changes to physiology and phenology. These relationships were combined with multiple published empirical models to estimate forage- and temperature-driven changes to cattle enteric methane production. This suggested a previously undescribed positive climate change feedback, where elevated temperatures reduce grass nutritive value and correspondingly may increase methane production by 0.9 % with a 1 ◦ C temperature rise and 4.5 % with a 5 ◦ C rise (model average), thus creating an additional climate forcing effect. Future methane production increases are expected to be largest in parts of North America, central and eastern Europe and Asia, with the geographical extent of hotspots increasing under a high emissions scenario. These estimates require refinement and a greater knowledge of the abundance, size, feeding regime and location of cattle, and the representation of heat
stress should be included in future modelling work. However, our results indicate that the cultivation of more nutritious forage plants and reduced livestock farming in warming regions may reduce this additional source of pastoral greenhouse gas emissions.
1
Introduction
Global meat production has increased rapidly in recent years, from 71 million tonnes in 1961 to 318 million tonnes in 2014 (FAOSTAT, 2016). This is due to population growth and a transition to meat-rich diets across many countries (Tilman and Clark, 2014). Grazing lands have expanded to support this production, particularly across Asia and South America, and now cover 35 million km2 of the Earth’s surface with an estimated 1.5 billion cattle, 1.2 billion sheep, 1 billion goats and 0.2 billion buffalo living in livestock production systems (FAOSTAT, 2016). The environmental footprint of supplying meat and dairy products has increased alongside these rises in human consumption. Livestock farming, including feed production, land use change, enteric sources and manure decomposition, produces approximately 7.1 gigatonnes of CO2 and CO2 equivalents annually (GT CO2 eq); this accounts for 15 % of anthropogenic greenhouse gas (GHG) emissions (FAO, 2013). Enteric fermentation by livestock produces 2.8 GT CO2 eq of methane each year, with 77 % being produced by cattle (FAO, 2013). The upward trend in livestock production and the associated GHG emissions are projected to continue in the future, and global stocks of cattle, goats and
Published by Copernicus Publications on behalf of the European Geosciences Union.
1404
M. A. Lee et al.: Forage quality declines with rising temperatures
sheep are expected to reach 6.3 billion by 2050 (Steinfeld et al., 2006). Ruminants (cattle and small ruminants such as sheep and goats) consume 80 % (3.7 GT) of the plant material grown to feed livestock (Herrero et al., 2013), and grasses continue to comprise the largest proportion of livestock diets. For example, in the year 2000, 48 % (2.3 billion tonnes) of the biomass consumed by livestock was grass, followed by grains (1.3 billion tonnes). The remainder of livestock feed (0.1 billion tonnes) was the leaves and stalks of field crops, such as corn (maize), sorghum and soybeans (Herrero et al., 2013). The chemical composition and morphology of forage grasses determines their palatability and nutritive value to livestock, thus influencing the amount of feed consumed, the efficiency of rumination, the rates of weight gain, the quality and volume of milk produced and reproductive success (Herrero et al., 2015). Forage grasses generally enhance nutritive value for livestock if they contain a greater proportion of readily fermentable components, such as sugars, organic acids and proteins, and a lower proportion of fibre (Waghorn and Clark, 2004). Furthermore, highly nutritious forage can reduce ruminant methane production, since feed moves through the digestive system more rapidly (Knapp et al., 2014). Accordingly, regional and inter-annual variability in forage nutritive value generates corresponding variability in the production of meat and dairy products and variability in the magnitude of ruminant methane emissions (Thornton and Herrero, 2010). Meat and dairy production in arid, equatorial and tropical regions is often lower than production in temperate regions due to the lower nutritional quality of forage grasses, lack of access to inorganic nitrogen (N) fertilisers, infertile soils and adverse climatic conditions (Thornton et al., 2011). Warmer regions are associated with taller, less nutritious and slow-growing grasses with low concentrations of protein, high concentrations of fibre and high plant dry matter content (DM; the proportion of plant dry mass to fresh mass) (Jégo et al., 2013; Waghorn and Clark, 2004). While extremely cold regions are also associated with grasses of low nutritive quality, cold regions are rarely suitable for ruminant livestock (Nielsen et al., 2013). The timing of grazing and forage harvesting are also important determinants of forage quality. For example, summer harvests frequently produce grasses of lower nutritive quality than spring harvests (Kering et al., 2011). Consequently, grasses of lower forage quality have low dry matter digestibility (DMD; the proportion of plant dry mass which is digestible; high DMD is positively associated with livestock productivity) (Lavorel and Grigulis, 2012; Pontes et al., 2007a). Greater grass nutritive value has been linked to cooler temperatures and N fertiliser addition due to phenological and physiological changes towards delayed flowering, modified stem : leaf ratios, thinner cell walls, reduced lignification and species turnover (Gardarin et al., 2014; Hirata, 1999; Kering et al., 2011).
Biogeosciences, 14, 1403–1417, 2017
Ruminant methane production is calculated using IPCC (2006) methodologies in GHG accounting (tiers 1, 2 and 3), and the more complex methods (tiers 2 and 3) incorporate the effects of nutritive value (Schils et al., 2007). However, few models have been developed to predict the effects of climate change on forage nutritive value (Kipling et al., 2016), and those which include climate or management have focussed on single plant species (Jégo et al., 2013) or regions (Graux et al., 2011). Quantifying the relationships between forage grass nutritive value, growing conditions and management more broadly and across many plant species provides an opportunity to make general projections of future changes to livestock and associated methane production. To our knowledge, such relationships have not been systematically assessed at the global scale. We tested the hypothesis that increasing temperatures are associated with grasses of lower nutritive value, delivering higher concentrations of fibre, lower protein and lower DMD with N fertiliser addition having opposite effects. To quantify the variation in the nutritive value of forage species growing across a range of bioclimatic zones and to understand the influence of climate and fertiliser application, data were gathered from published literature sources in which field-derived nutritive data were reported. Neutral detergent fibre (NDF; structural plant components; cellulose, lignin and hemicellulose) and crude protein (CP; approximate protein content) are presented as the most commonly reported measurements of forage nutritive value. NDF and CP are generally negatively and positively correlated with livestock productivity, respectively. These data were combined with a range of potentially modifying variables, including temperature, rainfall, rates of N fertiliser addition and the photosynthetic pathway. Statistical models were then used to generate projections of future climate-induced changes to forage grass nutritive value and cattle methane production. 2 2.1
Materials and methods Data acquisition
Data were obtained from peer-reviewed journal articles. These articles were identified by systematically searching the ISI Web of Knowledge (WoK; www.wok.mimas.ac.uk). To avoid researcher bias and to maintain a consistent approach, the search terms used to identify the articles listed in the WoK were identified a priori. Articles were included in the database if the nutritive measurements were related to a specific grass species or hybrid that had been grown in field conditions at a defined location (hereafter termed “site”) and harvested for nutritional analyses at a stated time. Data from experiments conducted in greenhouses or field experiments, i.e. those which manipulated climatic variables, were excluded because the prevailing growing conditions were not representative of the location.
www.biogeosciences.net/14/1403/2017/
M. A. Lee et al.: Forage quality declines with rising temperatures To ensure that the methods for measuring forage nutritive value were consistent across the articles, data were included if NDF and CP analyses were carried out on dried samples and presented in units of g kg−1 DM or % DM. DMD was also recorded when available to test for relationships between NDF, CP and digestibility. 2.2
Descriptive data
Descriptive data were included in the database for each data point. These potential explanatory data described the site (latitude, longitude and elevation), the experiment (degree of replication, experimental treatments and whether the grassland was a monoculture or polyculture), the management (fertiliser addition rate and grazing density), the soil (type and pH), the climate (mean annual temperature (MAT) and mean annual rainfall (MAR)), the weather during the month of sample collection (mean monthly temperature and total monthly rainfall) and data describing the plant photosynthetic pathway system (C3 and C4). Data were recorded from each article from text or tables. When this was not possible, data were obtained from graphs using the digitizing software DataThief (www.datathief.org). Sites were allocated to a bioclimatic zone as defined by the Köppen–Geiger climate classification system (Kottek et al., 2006) and recorded in the database as arid (≥ 70 % of precipitation falls in summer or winter), equatorial (mean temperature of the coldest month ≥ 18 ◦ C), temperate (mean temperature of the warmest month ≥ 10 ◦ C and the coldest month −3–18 ◦ C) or tundra (mean temperature of the warmest month ≥ 10 ◦ C and the coldest month ≤ −3 ◦ C). The database contained grass nutritive data collected from 32 sites in 16 countries (for detailed site descriptions, see the Supplement, Table S1) with NDF measurements taken from 35 grass species and CP measurements taken from 46 grass species. Overall, our dataset was comprised of 803 measurements of nutritive quality taken from 55 different grass species across Asia (11 % of the dataset), Australasia (6 %), central America (11 %), Europe (34 %), the Middle East (1 %), North America (36 %) and South America (1 %). Our dataset represented arid (19 % of the dataset; 6 sites), equatorial (1 %; 1 site), temperate (46 %; 16 sites) and tundra (35 %; 9 sites) bioclimatic zones. Across all sites, the temperatures at the time of sampling ranged from −5 to 36 ◦ C (MAT: −1–26 ◦ C) and the monthly rainfall at the time of sampling ranged from 0.6 to 702 mm (MAR: 38– 2378 mm yr−1 ). Data on the rate of N addition were available for 67 % of the dataset, and these rates of fertiliser application ranged from 0 to 357 kg N ha−1 yr−1 . Our dataset represented nutritive values collected from forage plants growing in regions currently suitable for ruminant livestock.
www.biogeosciences.net/14/1403/2017/
2.3
1405 Gap filling
In many cases, data were obtained from the articles analysed, but in some cases there were gaps in the information available. Data most commonly gathered from external sources were related to weather (sampling temperature and rainfall) and climate (MAT and MAR), which were obtained from the closest weather station to each site according to the National Centers for Environmental Prediction database (www.ncep.noaa.gov). Weather data for Waimate North was not added to the database because the nearest weather station was 150 km from the site. MAT and MAR were taken as the mean temperature and rainfall over the past 10 years. Google Earth (www.earth.google.com) was used to obtain the elevation of the site, if this was not stated in the article, based on a digital elevation model. 2.4
Statistics
Statistical analyses were carried out using weighted, restricted maximum-likelihood linear mixed-effects (LME) models (Pinheiro and Bates, 2000). Model selection was carried out by including NDF or CP as a response variable with multiple potential explanatory variables added as fixed effects to generate full (maximal) models. Fixed effects were mean temperature during the sampling month or MAT, total rainfall during the sampling month or MAR, elevation, rates of N addition and the photosynthetic pathway. Grazing density, soil pH and whether the plants were grown in monoculture or polyculture were shown not to significantly relate to CP or NDF in the LME models in preliminary analyses. To avoid over-fitting, these variables were not included in the initial full models (all P > 0.05). For the random effects structure, the identity of grass species was nested within the experimental treatment and treatments were nested within sites and represented within LME models, thus accounting for cases in which several measurements were taken for the same site, treatment or species. This accounted for the differences between the species and between the sites without making them the focus of our analysis. Any relationships identified therefore included the effects of changes to species identity and changes to physiology and phenology. However, a separate model was also fitted for the best represented plant species in the database (Lolium perenne) in order to gain an initial insight into the relative roles of physiological response and species turnover. The variation in the sample sizes used to generate the treatment means was accounted for by weighting by within-site replication, thus making the influence of a study proportional to its degree of replication (Adams et al., 1997). The non-significant explanatory variables were removed from the full models as all terms were found to reduce Akaike’s information criterion (AIC). The relative influence of each term on the model likelihood was assessed by comparing the AIC of the current model with that of a simplified Biogeosciences, 14, 1403–1417, 2017
1406
M. A. Lee et al.: Forage quality declines with rising temperatures
model with the terms deleted until the AIC ceased to decline (Crawley, 2013; Richards, 2005). Temperature and rainfall could not be included together in the LME models because these variables were shown to covary strongly (P < 0.001); either temperature or rainfall was included in the full models based on minimising the AIC. LME models were also used to test for relationships between CP, NDF, climate (MAT and MAR) and DMD, and also to test for differences in CP and NDF between bioclimatic zones. For comparison, separate analyses were therefore carried out for MAT or MAR and total rainfall or mean temperature during the month of sampling. All analyses were computed using R version 3.2.3 (The R Foundation for Statistical Computing, Vienna, Austria, 2016). 2.5
Enteric methane production modelling
Methane production projections were based on published, experimentally derived relationships between forage NDF content or daily NDF intake (NDFi) and enteric methane production, as measured in cattle. A suite of equations was acquired from published articles with all but one being the product of a meta-analysis (Table 1). These equations summarise many measurements of cattle enteric methane production across Africa, Asia, Australasia, Europe, North America and South America, and relate the magnitude of methane production to the nutritive quality of forage and, in some cases, total feed intake. In total, 303 studies were included across these meta-analyses with methane production measured by hood, mask and whole animal calorimetry, respiration chamber and sulfur hexafluoride (SF6 ) tracers. Where multiple options were available from a single article, equations were selected for inclusion in our study based on the lowest root mean square prediction error (RMSPE) when this was assessed within the article itself (Moraes et al., 2014; Patra, 2015) or based on the results of a study which compared the accuracy of multiple models in calculating methane production (Appuhamy et al., 2016). These equations, when combined with relationships between forage nutritive quality and temperature identified in this study, were used to model future changes to enteric methane production. NDF and NDFi were calculated using the parameters identified by our LME models, which describe the relationship between NDF and MAT (see “Results”) multiplied by the estimated daily feed intake or DMI (dry matter intake). The initial modelling based on equations A–E assumed that cattle DMI was 18.8 kg DMI d−1 , which represented the mean DMI across all cattle from North America, Europe and Australasia (Appuhamy et al., 2016). For model F, which represented smaller tropical cattle, a DMI of 7.7 kg d−1 was included, which was the mean value presented by Patra (2015). Some equations required values of forage nutritive quality which were not included in this analysis. In these cases, nutritive values were kept constant at 2.8 % dietary fatty acid, 2.8 % ether extract, 162 MJ d−1 metabolisable energy intake Biogeosciences, 14, 1403–1417, 2017
and 317 MJ d−1 gross energy intake. The values were consistent with a range of forage nutritive quality measurements presented elsewhere (e.g. Dalley et al., 1999; Ominski et al., 2006; Hegarty et al., 2007). These constant values had a lower influence on model outputs than NDF due to their lower absolute values or gradients. To present a range of possible scenarios, estimated changes to methane production were also calculated for a range of DMI values to represent small, medium and large cattle for the maximum projections (model A), minimum projections (model E) and most variable projections (model F). The modelled DMI ranged from 9.7 to 28.9 kg DMI d−1 for models A and E (Appuhamy et al., 2016) and from 1.4 to 10.0 kg DMI d−1 for model F (Patra, 2015). Projections of temperature-driven changes to cattle methane production used the HadGEM2 (Hadley Centre Global Environment Model version 2) family of climate models (IPCC, 2014) by applying low and high representative concentration pathways (low = RCP 2.6; high = RCP 8.5) to generate geographically explicit estimates of future climate and forage-driven changes to methane production. Projected temperature changes were converted to projected forage-driven changes to enteric methane production for mean sized cattle with the mean DMI (as defined above) using a weighted-average model (Table 1); the relative contribution of the outcomes of equations A–F was weighted according to the number of datasets included in each metaanalysis (Adams et al., 1997). The number of measurements used to generate each equation was larger than the number of datasets. For example, Patra (2015) included 142 mean enteric methane values collected from 830 cattle in 35 studies across Australia, Brazil, India and Zimbabwe (Table 1). HadGEM2 has been identified as a robust model which is valuable for predictions across climate change scenarios including biogeochemical feedback (Collins et al., 2011). The estimated increases in cattle methane production were calculated as ratios of methane production based on projected 2050 mean temperatures compared with production based on current temperatures (Hijmans et al., 2005). HadGEM2 models based on RCP 2.6 assumed that GHG mitigation policies are widely adopted and livestock numbers will decline, resulting in a reduction in GHG emissions after 2020. The models based on RCP 8.5 assume that GHG mitigation policies are not adopted, that livestock numbers will increase and that GHG emissions will continue to increase unabated. RCP 2.6 and RCP 8.5 therefore represented the lower and upper projections of future climate and forage-driven increases in cattle methane production. The regions which are unsuitable for ruminant livestock were excluded (Robinson et al., 2014), as were regions which are predicted to exceed 30 ◦ C since greater temperatures were outside the range of the dataset.
www.biogeosciences.net/14/1403/2017/
M. A. Lee et al.: Forage quality declines with rising temperatures
1407
Table 1. A summary of the published equations used to model changes driven by grass nutritive quality in methane production, giving the details for cattle type (D is dairy and B is beef), regions covered (AF is Africa, AS is Asia, AUNZ is Austalia and New Zealand, EU is Europe, NA is North America and SA is South America) and the number of studies included in each analysis. The values for root mean square prediction error (RMSPE) are also presented. Refa 1 2 3 4 5 6
Cattle D D D,B D,B D D,B
Regions
Studies
AS EU, NA, AUNZ NA NA EU AF, AS, AUNZ, SA
1 21 172 62 12 35
Equation (CH4 = )b
RMSPEc
5.1 × NDF2 − 39.3 × NDF + 360.0 −2.8 + 3.7 × NDFi 1.6 + 0.04 × MEi + 1.5 × NDFi 0.2 + 0.04 × GEi + 0.1 × NDF − 0.3 × EE 1.2 × DMI − 1.5 × FA + 0.1 × NDF −1.0+ 0.3 × DMI + 0.04 × DMI2 + 2.4 × NDFi − 0.3 × NDFi2
– 18.3 17.9 17.9 16.9 31.4
Model A B C D E F
a 1. Kasuya and Takahashi (2010), 2. Storlien et al. (2014), 3. Ellis et al. (2007), 4. Moraes et al. (2014), 5. Nielsen et al. (2013), 6. Patra (2015). b NDF is neutral detergent fibre (% DM), NDFi is neutral detergent fibre intake (kg d−1 ), MEi is metabolisable energy intake (MJ d−1 ), GEi is gross energy intake (MJ d−1 ), EE is dietary ether extract (% DM),
DMI is dry matter intake (kg d−1 ) and FA is dietary fatty acid (% DM). c As presented by Appuhamy et al. (2016), except references 4 and 6, which were presented within the referenced article.
3
Results
There was a large range in mean neutral detergent fibre (NDF) across the forage grass species (for a full list of species and a summary of the nutritive values for each species, see the Supplement, Table S2) from the lowest, Pennisetum clandestinum (46 %) and Lolium multiflorum (46 %), to the highest, Aristida longiseta (87 %). There was less variation between the forage grasses in crude protein (CP) (standard deviation of mean CP = 3) than in NDF (standard deviation of mean NDF = 10). The highest mean CP was recorded in Pennisetum clandestinum (23 %), and the lowest was recorded from another member of the same genus, Pennisetum purpureum (9 %). NDF was correlated strongly with forage dry matter digestibility (DMD), with each 1 % increase in NDF linked to a 0.6 % decline in DMD (t = −11.3, P < 0.001). CP was positively related to DMD; however, this significant relationship was dependent upon data from one site. When these outliers were removed, there was no significant relationship between CP and DMD (t = −0.2, P > 0.05). 3.1
Variation between bioclimatic zones
NDF varied between bioclimatic zones, and grasses growing in cooler temperate or tundra zones had a mean NDF 21 % lower than in warmer arid and equatorial zones (Fig. 1a), but there was no difference between NDF values recorded from arid and equatorial zones. CP also varied between bioclimatic zones, and grasses growing in cooler temperate or tundra zones had a mean CP 8 % greater than grasses growing in equatorial zones (Fig. 1b). However, there were no differences between the CP contents of grasses growing in arid zones when compared with the other bioclimatic zones. 3.2
Environmental determinants of nutritive value
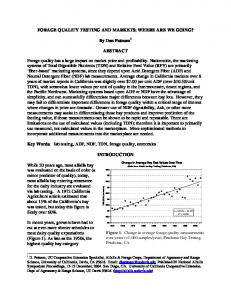
Higher temperatures during the sampling month were associated with increasing NDF across the grasses (Fig. 2), and www.biogeosciences.net/14/1403/2017/
NDF increased by 0.4 ± 0.06 % (mean ± standard error) for every 1 ◦ C rise in temperature. A small number of samples were collected at very low temperatures (< 0◦ C) and had low NDF values with a mean of 50 %, whilst at very high temperatures (> 25 ◦ C) NDF values were also high with a mean of 72 %. These extreme values were consistent with the general trends observed. MAT, which represented the prevailing climatic conditions rather than the sampling conditions, was also positively associated with NDF, but the rate of increase was moderately greater than for sampling temperatures, increasing by 0.9 ± 0.3 % for every 1 ◦ C increase in MAT (Table 2). The rates of N addition were linked to a decline in NDF with a 100 kg ha−1 yr−1 increase in the rate of N addition, a moderate rate typical for agricultural grasslands, reducing NDF by 3 ± 1 %. A very high application rate of 350 kg N ha−1 yr−1 was associated with a decline in NDF of 11 %. These relationships were also tested for Lolium perenne, the species best represented in the database. A positive linear relationship was found between NDF and sampling temperature (20 sites; t = 3.6, P < 0.001), increasing NDF by 13 ± 4 % for every 1 ◦ C increase (over the range 9–22 ◦ C), and between NDF and MAT (21 sites; t = 4.6, P < 0.001), increasing NDF by 23 ± 5 % for every 1 ◦ C increase (over the range 6–15 ◦ C). However, there was no relationship between NDF and N for this species. NDF was also influenced by the photosynthetic pathway, with the NDF content of C4 species a mean of 9 % greater than C3 species. These C4 grasses were more commonly recorded at warmer sites, and NDF content was recorded from C4 grasses growing in mean monthly temperatures greater than 15 ◦ C up to 28 ◦ C, whilst NDF was recorded in C3 species growing in temperatures between −5 and 25 ◦ C. CP was positively related to the rates of N addition, with a 100 kg ha−1 yr−1 increase in the rate of N addition associated with a 2 % increase in CP. A very high application rate of 350 kg N ha−1 yr−1 was associated with a 7 % increase in CP. The mean CP content was 3 % higher for C3 species than for C4 species, but this difference was not significant (P > 0.05). Biogeosciences, 14, 1403–1417, 2017
1408
M. A. Lee et al.: Forage quality declines with rising temperatures
Figure 1. Box plots of (a) the neutral detergent fibre (NDF) and (b) the crude protein (CP) content of grasses located in bioclimatic zones as described by the Köppen–Geiger climate classification system. Significant differences between zones, as identified by the LME models, are denoted by different letters (P < 0.05). Table 2. The minimum adequate linear mixed-effects models for forage-neutral detergent fibre (NDF) and crude protein (CP). The values represent slopes, except the C4 pathway values, which represent the absolute differences between the C3 pathway (intercept) and the C4 pathway. The site numbers differ between response types since temperature at the time of sampling and NDF and CP were not always available from all articles. Response
Sites
Factor
Value
SE
DF
T
P
49.4 0.4 −0.03 8.7
2.0 0.06 0.01 3.2
287 287 287 33
25.3 5.8 −3.4 2.7
< 0.001 < 0.001 < 0.001 < 0.05
43.4 0.9
3.7 0.3
300 19
11.6 3.8
< 0.001 < 0.01
NDF
20
Intercept Temperature at sampling (◦ C) N addition (kg N ha−1 yr−1 ) C4 pathway presence
NDF
32
Intercept MAT (◦ C)
CP
25
Intercept Rainfall (mm mth−1 ) N addition (kg N ha−1 yr−1 ) C4 pathway presence
14.2 −0.002 0.02 −2.9
1.0 0.002 0.006 1.7
484 484 484 46
14.8 −0.8 3.0 −1.7
< 0.001 0.43 < 0.01 0.1
CP
27
Intercept MAR (mm yr−1 )
15.9 −0.001
1.6 0.001
575 24
9.9 −0.5
< 0.001 0.65
None of the remaining variables were significantly related to CP (all P > 0.05). 3.3
Projected future changes to methane production
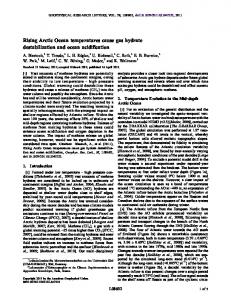
Applying models A to F to the positive relationship between NDF and MAT resulted in a range of projections for forage- and temperature-driven changes to methane production (Fig. 3). Models A to E projected increased methane production with rising temperatures, assuming a mean cattle size and DMI, with model A projecting the largest increase in methane production (2.9 % for a 1 ◦ C rise) and model E projecting the lowest increase in methane production for each unit of increased temperature (0.5 % for a 1 ◦ C rise). Models B, C and D produced intermediate values (1.9, 1.2 and 0.7 % for a 1 ◦ C rise, respectively). However, model F projected a reduction in methane production with increased temperaBiogeosciences, 14, 1403–1417, 2017
tures at a mean cattle size (−0.3 % for a 1 ◦ C rise). The models with intermediate predictions (B, C and D) were those based on the largest number of studies (particularly models C and D) and so contributed the most to the weighted mean. Correspondingly, the weighted mean model also projected an intermediate increase in methane production with rising temperatures; 0.9 % for a 1 ◦ C rise in temperature and 4.5 % for a larger 5 ◦ C rise in temperature. The effect of simulating changes to cattle size by modifying DMI had contrasting effects across the different models (Fig. 4). In the case of model A, increasing cattle size consistent with the current global trend towards larger cattle (Herrero et al., 2013) increased the rise in projected methane production with temperature (0.8–3.7 % for a 1 ◦ C rise; Fig. 4a). A larger cattle size decreased the rise in projected methane production for model E (0.3–0.8 % for a 1 ◦ C
www.biogeosciences.net/14/1403/2017/
M. A. Lee et al.: Forage quality declines with rising temperatures
Figure 2. The linear relationship between forage-neutral detergent fibre (NDF) content and temperature (◦ C) at the time of sampling. The filled circles are C3 species and the open circles are C4 species (P < 0.05). The dotted lines represent best fit lines for C3 (NDF = 0.4T + 49) and C4 species (NDF = 0.4T + 58). The continuous line represents the best fit line for all species excluding other factors included within the LME model (NDF = 1.1T + 36).
jected to increase with temperature for the smallest cattle (2.2 % for a 1 ◦ C rise) but decline with temperature for the largest cattle (−1.2 % for a 1 ◦ C rise; Fig. 4c). When the statistical models were combined with future temperature scenarios, potential hotspots of forage-driven increases in methane production were identified. The low emissions scenario predicted increases in methane production for mean sized cattle by 1–2 % across most regions, whilst hotspots in North America, central and eastern Europe and Asia saw predicted increases of approximately 3–4 % (Fig. 5a). The high emissions scenario resulted in a larger area experiencing high increases in cattle methane production with many regions across North and South America, Europe, central and southern Africa, Asia and Australasia increasing by 6–8 % (Fig. 5b). These projections represent the estimated change in methane production for each animal. Simulated decreases and increases in the global cattle inventory are included in climate projections; RCP 2.6 and 8.5, respectively (IPCC, 2014).
4
Figure 3. The estimated change in cattle methane production with temperature-derived declines in grass nutritive quality. The dotted lines represent the six model outputs as defined by equations A– F (defining the relationships between grass nutritive quality and methane production) when combined with the inverse relationship between temperature and grass nutritive quality presented in this article. The continuous line represents the mean weighted model, which is the mean methane production predicted by all six equations weighted by the number of contributing datasets.
rise; Fig. 4b). These values represented the largest range of increases in projected methane production with rising temperatures across models A to E. Again, model F behaved differently to the other models; methane production was prowww.biogeosciences.net/14/1403/2017/
1409
Discussion
Global food consumption patterns are shifting from traditional diets to diets rich in refined sugars, fats, oils and meats (Tilman and Clark, 2014). Assessments suggest that agricultural GHG emissions need to be reduced by ∼ 1 GT CO2 eq annually in order to limit warming to 2 ◦ C above pre-industrial levels by 2100 (Wollenberg et al., 2016). We present preliminary evidence of a previously undescribed positive climate feedback, which may affect our ability to meet these ambitious GHG emissions targets. Our models project that future temperature-driven reductions in the nutritive value of forage grasses could increase methane production (depending on the emissions scenario, locality and cattle size), thus creating an additional climate forcing effect. It should be noted, however, that our projections do not incorporate several important but complex factors (for a detailed discussion, see Sect. 4.4 “Limitations to modelling approach”), including the effects of climate change on economic growth, technological uptake and land availability, which have not been fully quantified (Audsley et al., 2014; Havlík et al., 2014). Nevertheless, the potential magnitude of future decreases in grass nutritive value and corresponding increases in methane production mean that these projections cannot be ignored and are identified here as a research area requiring careful future work and refinement. 4.1
Variation in nutritive and functional traits
Forage grass nutritive values varied substantially between and within species and across bioclimatic zones, with our data indicating that 34–90 % of the dry weight of the grass that livestock consume is fibre and 5–36 % is protein. These ranges are greater than those presented elseBiogeosciences, 14, 1403–1417, 2017
1410
M. A. Lee et al.: Forage quality declines with rising temperatures
Figure 4. The estimated change in enteric methane production with temperature change for (a) the model predicting the largest increases in methane production (maximum CH4 ), (b) the model predicting the lowest increases in methane production (minimum CH4 ) and (c) the model which predicts both increases and decreases in methane production (negative CH4 ). The dotted lines represent the predictions for minimum sized (small, S), mean sized (medium, M) and maximum sized (large, L) cattle. S, M and L cattle were defined as cattle consuming 9.7, 18.8 and 28.9 kg DMI d−1 , respectively, for models A and E. S, M and L cattle were defined as consuming 1.4, 7.7 and 10 kg DMI d−1 , respectively, for model F, which represents less productive tropical regions. Values do not include projected changes to the global cattle inventory. The continuous lines represents the mean weighted model.
where; for example, NDF has been shown to range from 35– 67 % (O’Donovan et al., 2011) and CP from 14–24 % across several European grass species and cultivars (Pontes et al., 2007b), but these greater ranges are to be expected given the wider biogeographic coverage of our study. NDF values were generally higher and CP values were generally lower in warmer bioclimatic zones than in cooler zones, and this is likely to be one reason why livestock productivity is lower across arid, equatorial and tropical regions. The reduced nutritive value in these zones may be driven by increased abundances of plants with adaptations to prevent heat stress and avoid water loss. These adaptations could include greater stem : leaf ratios, narrowly spaced veins, greater hair densities, thicker cell walls, a higher proportion of epidermis, bundle sheaths, sclerenchyma, vascular tissues and greater concentrations of lignin and silica (Kering et al., 2011). The C4 photosynthetic pathway is also an adaptation to heat and water stress, and C4 plants were more commonly recorded in warmer conditions than C3 plants. C4 plants were also associated with lower nutritive value. This is in line with studies that have measured elevated enteric methane production in cattle consuming high-fibre C4 grasses compared with those consuming C3 grasses (Ulyatt et al., 2002). Across warmer bioclimatic zones, reduced forage nutritive values may be driven by increased abundances
Biogeosciences, 14, 1403–1417, 2017
of C4 species and of taller, slow-growing species with a conservative growth strategy (Martin and Isaac, 2015; Wood et al., 2015). The large variation within and between species highlights the potential for the cultivation and breeding of grasses to enhance livestock nutrition, which may promote resistance to future environmental changes. 4.2
Relationships between nutritive value, environment and management
NDF was positively related to MAT and temperatures at the time of sampling. Links between higher temperatures and declining nutritive values and between declining nutritive values and increasing enteric methane production have been established under controlled conditions (Knapp et al., 2014). Our results indicate that the same mechanisms may operate at a global scale. MAT represents prevailing climatic conditions, and elevated NDF is likely driven by a shift towards grasses with heat- and drought-stress adaptations and conservative functional traits associated with slow growth (Gardarin et al., 2014). The positive relationship between the sampling temperature and NDF may also be linked with changes to phenology, such as advanced flowering dates and rapid tissue aging (Hirata, 1999). The timing of the measurements may have also played a role in increasing NDF, since later harvests generally produce grasses of lower nutritive www.biogeosciences.net/14/1403/2017/
M. A. Lee et al.: Forage quality declines with rising temperatures
1411
Figure 5. Predictions of climate- and forage-driven increases in cattle methane production (%) under temperatures predicted for 2050 using (a) a low estimate of future temperature changes (RCP 2.6) and (b) a high estimate of future temperature changes (RCP 8.5). The regions in light grey are currently unsuitable for ruminant livestock, and the regions with predicted temperatures greater than 30 ◦ C are shaded dark grey since they are beyond the range of the dataset. Values do not include projected increases in the global cattle inventory, which are simulated to decrease and increase in RCP 2.6 and 8.5, respectively. These estimates are based on HadGEM2 climate projections combined with the mean weighted model. Estimates are based on data collected from arid (19 %), equatorial (1 %), temperate (46 %) and tundra (35 %) bioclimatic zones, which are all currently suitable for ruminant livestock.
quality (Kering et al., 2011). Temperature-driven reductions in forage grass nutritive value are consistent with mechanistic and empirical models (Barrett et al., 2005; Kipling et al., 2016). However, our results contrast with a meta-analysis of temperature manipulation experiments, which did not reveal any relationships between warming and nutritive value, although this study was across a relatively small temperature gradient (Dumont et al., 2015). The relationships between forage nutritive value and both sampling temperatures and MAT imply that the compositional (i.e. turnover in species identity), phenological and physiological changes of species each play a role. The patterns generated by these different processes were not directly disentangled in our study. However, there were relationships between both MAT and sampling temperatures and NDF when measured from one species, Lolium perenne. This pattern will likely have been driven by changes to physiology, phenology and harvesting time, but not species turnover. The effect size when only L. perenne was included in our analysis was larger than for all plant species, though it was over a smaller temperature range of 6 to 15 ◦ C. This large response indicates that phenological and physiological changes may play a significant role in driving the reduction of NDF under warming and that changes may occur without species turnover. The positive relationships between NDF and both MAT and sampling tempera-
www.biogeosciences.net/14/1403/2017/
tures, both across species and within an individual species, provide additional evidence that our projections are robust. N fertiliser addition generally increases the productivity of grasslands, since the majority of these ecosystems are N limited (LeBauer and Treseder, 2008; Lee et al., 2010). We present data which suggest that N addition may also increase grass nutritive value, decreasing NDF by around 3– 11 % (low to high fertiliser application rates) with an associated increase in CP by 2–7 %. Increased rates of N addition have been previously linked to increased abundances of grass species with ‘fast’ functional traits, reduced fibre and increased protein content (Pontes et al., 2007a). N addition did not alter the nutritive quality of L. perenne, and therefore the relationship between N and NDF for all species could represent species turnover rather than changes to physiology or phenology. N addition could partially offset the negative effects of warmer temperatures on forage grass nutritive value in polyculture (where there is species turnover), although N enrichment may also have other, potentially unwanted, ecosystem impacts (Manning, 2012). Improved nutrition management by farmers may also partially offset the predicted gains in enteric methane production (Caro et al., 2016).
Biogeosciences, 14, 1403–1417, 2017
1412 4.3
M. A. Lee et al.: Forage quality declines with rising temperatures Explorations of future methane production
Our estimates suggest that future cattle enteric methane production may change by a mean weighted value of 0.9 % (−0.3–2.9 %) for an initial 1 ◦ C increase in temperature, assuming no change in mean cattle size, due to reduced forage nutritive quality. This increase would translate to an annual change in methane production across the global cattle inventory of approximately 0.02 GT CO2 eq (−0.01–0.06 GT CO2 eq). With a larger 5 ◦ C increase in temperature, the projected change in cattle methane production of 4.5 % (−2– 14 %) translates to a global change of approximately 0.09 GT CO2 eq (−0.02–0.3 GT CO2 eq). However, it may be the case that some areas fall outside the range of our models under greater warming (i.e. those with MAT > 30 ◦ C), increasing the uncertainty of these estimates. Since RCPs already include simulated changes in the global cattle inventory (IPCC, 2014), our results demonstrate that forage- and temperature-driven increases in methane production may offset some of the methane reductions assumed to come from fewer cattle (RCP 2.6) or further amplify methane increases from a greater number of cattle (RCP 8.5). Whether methane production will change towards the mean, upper or lower end of the projected ranges is clearly dependent on which model is correct. We postulate that the most likely models are model C, which represented North American cattle, and the mean weighted model; these two models included the largest number of studies (thus representing a large range of cattle sizes and breeds) and gave comparable and intermediate outputs. Five of the six models were consistent with studies linking increased forage fibre with greater enteric methane production (e.g. Moraes et al., 2014) and therefore estimated increased methane production under warmer temperatures. One model (model F) projected declines in future enteric methane production with temperature. However, care must be taken in this case, as the model was parameterised using data collected from smaller animals and across tropical regions. When the smallest animals were simulated with this model, as is consistent with smaller tropical breeds such as zebu, enteric methane was also projected to rise with temperatures. The trend towards larger cattle across many regions could also influence the magnitude of changes to enteric methane production because larger cattle have greater feed and fibre intakes (Knapp et al., 2014). Model predictions for larger animals were more variable, and therefore both the magnitude of emissions and the uncertainty surrounding these estimates increases with cattle size. The magnitude of projected change across the different models was also dependent on whether NDF or DMI was the dominant term. Furthermore, our projections are limited to cattle. However, there is emerging evidence that reductions in the nutritive value of forage also lead to increased enteric methane production from sheep (Ramin and Huhtanen, 2013) and buffalo (Patra, 2014). Together cattle, buffalo and sheep contribute > 95 % of global GHG emisBiogeosciences, 14, 1403–1417, 2017
sions from enteric fermentation (FAO, 2013). If our projections hold across the global ruminant inventory, then overall enteric methane production will increase to a greater magnitude than we predict. Our calculations are also limited to cattle that consume grass. We therefore do not account for the trend towards permanently housed cattle, particularly across Europe and North America. This may further increase emissions because the mixed diets of housed cattle increase enteric methane production by around 58 % (March et al., 2014; O’Neill et al., 2011). Hotspots of future increases in enteric methane production were identified across North America, central and eastern Europe and Asia using a low GHG emissions scenario combined with our weighted mean model. Hotspots became more widespread and of greater magnitude in a high GHG emissions scenario. At present, the greatest densities of cattle can be found in parts of Asia, North and South America, Europe and across Australasia (FAOSTAT, 2016). Many of these regions are projected to experience the greatest forage nutrition-driven increase in cattle methane production. Added to this, meat production has increased by 3.6 % across Africa and 3.4 % across Asia over the past decade compared with a 1 % increase across Europe (FAOSTAT, 2016), indicating greater future growth across these regions. Losses in forage quality could drive farmers into more extensive farming systems across many regions because larger land areas will be required for each animal. Therefore, it may be necessary to limit the growth of livestock production systems in warmer and drier regions, particularly those likely to experience future warming, if significant losses in livestock production efficiency and increases in methane emissions are to be avoided. Cattle methane production can be reduced by growing more nutritious forage plants, adding N fertiliser, adding feed supplements (e.g. macroalgae and fats), adjusting rumen pH, increasing concentrate feeding, practicing genetic selection and feeding methane inhibitors (Duin et al., 2016; Machado et al., 2014). However, implementing many of these measures is not feasible at a global scale and is unlikely to result in sufficient reductions in GHG emissions to meet ambitious GHG reduction targets. These measures may also promote other negative environmental effects such as biodiversity loss, nitrous oxide emissions and pollution in the air and water (Manning, 2012; Wollenberg et al., 2016). Ruminant meats (beef and lamb) produce around 250 times greater GHG emissions per gram of protein than legumes (crops from the family Leguminosae), and the production of eggs, seafood, poultry and pork as well as the practice of aquaculture all involve lower emissions than ruminant meats (Tilman and Clark, 2014). A global switch in human diets and a transition to more sustainable agricultural practices, as well as a greater prevalence of organic and silvopastoral farming, may reduce our reliance on intensively farmed cattle and other ruminants. In countries with high or increasing meat consumption, these measures could reduce the environmental impacts www.biogeosciences.net/14/1403/2017/
M. A. Lee et al.: Forage quality declines with rising temperatures of agriculture and contribute to GHG emissions cuts with an associated improvement in human health (Springmann et al., 2016). 4.4
Limitations to modelling approach
There are many uncertainties associated with modelling plant and livestock systems, and all of the relevant factors could not be considered in our analysis. Future attempts to refine our predictions therefore require additional processes to be represented mechanistically and data to parameterise these processes (Hill et al., 2016). Current livestock models require many inputs which are not universally available and do not account for variation across all individuals, breeds and regions. Furthermore, current mechanistic vegetation models do not quantitatively consider climate-driven changes to forage nutritive quality (Kipling et al., 2016). Recent work has addressed the knowledge gaps in empirical models, such as by quantifying the methane produced by cattle across Africa and other tropical regions, thus improving the coverage of these models (Jaurena et al., 2015; Patra, 2015). However, there continues to be low geographic coverage of forage quality data in equatorial and tropical regions, where the nutritive quality of forage is typically lower than in temperate regions (Nielsen et al., 2013). Furthermore, the effects of heat stress on enteric methane production have not been fully quantified (Kadzere et al., 2002), and the anticipated near-doubling of the global livestock inventory was also not included in our projections because future changes in the distribution of cattle and technological advances are currently unknown (Herrero et al., 2015). If livestock numbers increase in rapidly warming regions, then we predict that there will be an associated rise in enteric methane production. Increased grazing pressure may also alter plant species composition, thus changing the nutritive value and extent of grazing lands (Gardarin et al., 2014). Other global environmental changes, such as elevated CO2 (Barbehenn et al., 2004; Roumet et al., 1999) and the increased frequency of droughts, flooding and extreme weather events could also affect methane production (Hoover et al., 2014).
5
Conclusions
We present preliminary evidence of future temperaturedriven declines in forage nutritive quality and the corresponding increases in enteric methane production. Upscaling the GHG footprint of the current livestock inventory to the 2050 projected inventory increases annual GHG emissions from enteric sources from 2.8 to 4.7 GT CO2 eq. However, our projections reveal that the geographical distribution of livestock as well as changes to their size and diet and the interactions between nutritive values, climate and fertilisers may modify the GHG footprint of cattle. The incorporation of a greater number of factors which were not included in www.biogeosciences.net/14/1403/2017/
1413
our analysis, along with more detailed measures of how forage quality changes across environmental gradients, would help to refine our estimates. Nevertheless, our projections reveal robust general trends and highlight a potentially important and previously unrecognised climate change feedback with important implications for GHG emissions targets, future warming, agricultural policies and food security.
Data availability. Data can be obtained by contacting the lead author directly. Some of our data have been obtained from journals which are not open access and cannot be freely distributed.
The Supplement related to this article is available online at doi:10.5194/bg-14-1403-2017-supplement.
Author contributions. Mark A. Lee and Pete Manning designed the approach, and Mark A. Lee carried out data collection and analyses. Mark A. Lee developed the predictive models and maps and prepared the paper with contributions from all co-authors.
Competing interests. The authors declare that they have no conflict of interest.
Acknowledgements. This paper was produced following consultation with the members of the RBG Kew Plant Nutrition and Traits Database steering committee. Thanks to Gerhard Boenisch, Jens Kattge, Charlie Marsh and Alex Papadopulos for editorial advice and discussions on the presentation and analyses. The authors would like to thank two anonymous reviewers for comments which improved the paper. Edited by: P. Stoy Reviewed by: two anonymous referees
References Adams, D. C., Gurevitch, J., and Rosenberg, M. S.: Resampling tests for meta-analysis of ecological data, Ecology, 78, 1277–1283, doi:10.1890/00129658(1997)078[1277:RTFMAO]2.0.CO;2, 1997. Akgun, I., Tosun, M., and Sengul, S.: Comparison of agronomic characters of Festulolium, Festuca pratensis huds, and Lolium multiflorum lam, genotypes under high elevation conditions in Turkey, Bangladesh J. Bot., 37, 1–6, 2008. Al-Ghumaiz, N. S. and Motawei, M. I.: Productivity, forage quality and presence of dehydrin genes in some introduced pasture grass cultivars growing under heat stress in central region of Saudi Arabia, Aust. J. Crop Sci., 5, 1001–1006, 2011. Appuhamy, J. A. D. R. N., France, J., and Kebreab, E.: Models for predicting enteric methane emissions from dairy cows in North America, Europe, and Australia and New Zealand, Glob. Change Biol., 22, 3039–3056, doi:10.1111/gcb.13339, 2016.
Biogeosciences, 14, 1403–1417, 2017
1414
M. A. Lee et al.: Forage quality declines with rising temperatures
Audsley, E., Trnka, M., Sabat, S., Maspons, J., Sanchez, A., Sandars, D., Balek, J., and Pearn, K.: Interactively modelling land profitability to estimate European agricultural and forest land use under future scenarios of climate, socio-economics and adaptation, Climatic Change, 128, 215–227, doi:10.1007/s10584-0141164-6, 2014. Barbehenn, R. V., Chen, Z., Karowe, D. N., and Spickard, A.: C3 grasses have higher nutritional quality than C4 grasses under ambient and elevated atmospheric CO2 , Glob. Change Biol., 10, 1565–1575, doi:10.1111/j.1365-2486.2004.00833.x, 2004. Barrett, P. D., Laidlaw, A. S., and Mayne, C. S.: GrazeGro: A European herbage growth model to predict pasture production in perennial ryegrass swards for decision support, Eur. J. Agron., 23, 37–56, doi:10.1016/j.eja.2004.09.006, 2005. Beecher, M., Hennessy, D., Boland, T. M., Mcevoy, M., O’Donovan, M., and Lewis, E.: The variation in morphology of perennial ryegrass cultivars throughout the grazing season and effects on organic matter digestibility, Grass Forage Sci., 70, 19– 29, doi:10.1111/gfs.12081, 2015. Bélanger, G. and Mcqueen, R. E.: Leaf and stem nutritive value of timothy cultivars differing in maturity, Can. J. Plant Sci., 772, 237–249, 1997. Bryant, R. H., Gregorini, P., and Edwards, G. R.: Effects of N fertilisation, leaf appearance and time of day on N fractionation and chemical composition of Lolium perenne cultivars in spring, Anim. Feed Sci. Technol., 173, 210–219, doi:10.1016/j.anifeedsci.2012.02.003, 2012. Callow, M. N., Lowe, K. F., Bowdler, T. M., Lowe, S. A., and Gobius, N. R.: Dry matter yield, forage quality and persistence of tall fescue (Festuca arundinacea) cultivars compared with perennial ryegrass (Lolium perenne) in a subtropical environment, Aust. J. Exp. Agric., 43, 1093–1099, doi:10.1071/EA02001, 2003. Caro, D., Kebreab, E., and Mitloehner, F. M.: Mitigation of enteric methane emissions from global livestock systems through nutrition strategies, Climatic Change, 137, 467-480, doi:10.1007/s10584-016-1686-1, 2016. Catanese, F., Distel, R. A., and Arzadún, M.: Preferences of lambs offered Italian ryegrass (Lolium multiflorum L.) and barley (Hordeum vulgare L.) herbage as choices, Grass Forage Sci., 64, 304–309, doi:10.1111/j.1365-2494.2009.00698.x, 2009. Cherney, D. J. R. and Cherney, J. H.: Grass forage quality and digestion kinetics as influenced by nitrogen fertilization and maturity, J. Appl. Anim. Res., 11, 105–120, doi:10.1080/09712119.1997.9706170, 1997. Collins, W. J., Bellouin, N., Doutriaux-Boucher, M., Gedney, N., Halloran, P., Hinton, T., Hughes, J., Jones, C. D., Joshi, M., Liddicoat, S., Martin, G., O’Connor, F., Rae, J., Senior, C., Sitch, S., Totterdell, I., Wiltshire, A., and Woodward, S.: Development and evaluation of an Earth-System model – HadGEM2, Geosci. Model Dev., 4, 1051–1075, doi:10.5194/gmd-4-10512011, 2011. Conaghan, P., O’Kiely, P., Howard, H., O’Mara, F. P., and Hailing, M. A.: Evaluation of Lolium perenne L. cv. AberDart and AberDove for silage production, Irish J. Agric. Food Res., 47, 119–134, 2008. ˇ Cop, J., Lavrenˇciˇc, A., and Košmelj, K.: Morphological development and nutritive value of herbage in five temperate grass species during primary growth: Analysis of time dy-
Biogeosciences, 14, 1403–1417, 2017
namics, Grass Forage Sci., 64, 122–131, doi:10.1111/j.13652494.2008.00676.x, 2009. Crawley, M. J.: The R Book-Second Edition, Wiley, Oxford, 2013. Dalley, D. E., Roche, J. R., Grainger, C., and Moate, P. J.: Dry matter intake, nutrient selection and milk production of dairy cows grazing rainfed perennial pastures at different herbage allowances in spring, Aust. J. Exp. Agric., 39, 923–931, doi:10.1071/EA99022, 1999. Distel, R. A., Didoné, N. G., and Moretto, A. S.: Variations in chemical composition associated with tissue aging in palatable and unpalatable grasses native to central Argentina, J. Arid Environ., 62, 351–357, doi:10.1016/j.jaridenv.2004.12.001, 2005. Dong, S. K., Long, R. J., Hu, Z. Z., Kang, M. Y., and Pu, X. P.: Productivity and nutritive value of some cultivated perennial grasses and mixtures in the alpine region of the Tibetan Plateau, Grass Forage Sci., 58, 302–308, doi:10.1046/j.13652494.2003.00382.x, 2003. dos Santos, M., Junior, J., Silva, M., dos Santos, S., Ferreira, L., de Mello, A., Farias, I., and de Freitas, E.: Productivity and chemical composition of tropical grasses in the forest zone of Pernambuco, Rev. Bras. Zootec., 32, 821–827, 2003. Duin, E. C., Wagner, T., Shima, S., Prakash, D., Cronin, B., YáñezRuiz, D. R., Duval, S., Rümbeli, R., Stemmler, R. T., Thauer, R. K., and Kindermann, M.: Mode of action uncovered for the specific reduction of methane emissions from ruminants by the small molecule 3-nitrooxypropanol, P. Natl. Acad. Sci. USA, 113, 6172–6177, doi:10.1073/pnas.1600298113, 2016. Dumont, B., Andueza, D., Niderkorn, V., Luscher, A., Porqueddu, C., and Picon-Cochard, C.: A meta-analysis of climate change effects on forage quality in grasslands: specificities of mountain and mediterranean areas, Grass Forage Sci., 70, 239–254, doi:10.1111/gfs.12169, 2015. Ellis, J. L., Kebreab, E., Odongo, N. E., McBride, B. W., Okine, E. K., and France, J.: Prediction of methane production from dairy and beef cattle, J. Dairy Sci., 90, 3456–3466, doi:10.3168/jds.2006-675, 2007. FAO: Tackling Climate through Livestock: A Global Assessment of Emissions and Mitigation Opportunities, Food and Agriculture Organisation, Rome, 2013. FAOSTAT: FAOSTAT Emissions database, available at: http:// faostat3.fao.org (last access: 1 March 2016), 2016. Gardarin, A., Garnier, E., Carrere, P., Cruz, P., Andueza, D., Bonis, A., Colace, M., Dumont, B., Duru, M., Farruggia, A., Gaucherand, S., Grigulis, K., Kernies, E., Lavorel, S., Louault, F., Loucougaray, G., Mesleard, F., Yavercovski, N., and Kazakou, E.: Plant trait-digestibility relationships across management and climate gradients in permanent grasslands, J. Appl. Ecol., 51, 1207–1217, doi:10.1111/1365-2664.12293, 2014. Graux, A. I., Gaurut, M., Agabriel, J., Baumont, R., Delagarde, R., Delaby, L., and Soussana, J. F.: Development of the pasture simulation model for assessing livestock production under climate change, Agric. Ecosyst. Environ., 144, 69–91, doi:10.1016/j.agee.2011.07.001, 2011. Griggs, T. C., MacAdam, J. W., Mayland, H. F., and Burns, J. C.: Temporal and vertical distribution of nonstructural carbohydrate, fiber, protein, and digestibility levels in orchardgrass swards, Agron. J., 99, 755–763, doi:10.2134/agronj2006.0036, 2007. Haferkamp, M. and Grings, E.: Quality and persistence of forages in the Northern Great Plains, J. Range Manag., 55, 482–487, 2002.
www.biogeosciences.net/14/1403/2017/
M. A. Lee et al.: Forage quality declines with rising temperatures Havlík, P., Valin, H., Herrero, M., Obersteiner, M., Schmid, E., Rufino, M. C., Mosnier, A., Thornton, P. K., Böttcher, H., Conant, R. T., Frank, S., Fritz, S., Fuss, S., Kraxner, F., and Notenbaert, A.: Climate change mitigation through livestock system transitions, P. Natl. Acad. Sci. USA, 111, 3709–14, doi:10.1073/pnas.1308044111, 2014. Hegarty, R. S., Goopy, J. P., Herd, R. M., and McCorkell, B.: Cattle selected for lower residual feed intake have reduced daily methane production, J. Anim. Sci., 85, 1479–1486, doi:10.2527/jas.2006-236, 2007. Herrero, M., Havlík, P., Valin, H., Notenbaert, A., Rufino, M. C., Thornton, P. K., Blümmel, M., Weiss, F., Grace, D., and Obersteiner, M.: Biomass use, production, feed efficiencies, and greenhouse gas emissions from global livestock systems, P. Natl. Acad. Sci. USA, 110, 20888–93, doi:10.1073/pnas.1308149110, 2013. Herrero, M., Wirsenius, S., Henderson, B., Rigolot, C., Thornton, P., Havlik, P., and de Boer, I.: Livestock and the Environment: What Have We Learned in the Last Decade?, Annu. Rev. Environ. Resour., 40, 177–202, doi:10.1146/annurev-environ031113-093503, 2015. Hijmans, R. J., Cameron, S. E., Parra, J. L., Jones, P. G., and Jarvis, A.: Very high resolution interpolated climate surfaces for global land areas, Int. J. Climatol., 25, 1965–1978, doi:10.1002/joc.1276, 2005. Hill, J., McSweeney, C., Wright, A. D. G., Bishop-Hurley, G., and Kalantar-zadeh, K.: Measuring Methane Production from Ruminants, Trends Biotechnol., 34, 26–35, doi:10.1016/j.tibtech.2015.10.004, 2016. Hirata, M.: Modeling digestibility dynamics in leaf segments in a grass: A new approach to forage quality changes in a growing plant, Agric. Syst., 60, 169–174, doi:10.1016/S0308521X(99)00026-8, 1999. Hirata, M., Islam, M., Harada, E., Furuyu, M., and Sakou, A.: Sward structure and herbage quality, production and utilisation of adjacent monocultures of centipede grass and bahia grass grazed by cattle, Trop. Grasslands, 48, 202–213, 2008. Hoover, D. L., Knapp, A. K., and Smith, M. D.: Resistance and resilience of a grassland ecosystem to climate extremes, Ecology, 95, 2646–2656, doi:10.1890/13-2186.1, 2014. IPCC: Agriculture, forestry and other land uses, in: IPCC Guidelines for National Greenhouse Gas Inventories, Prepared by the National Greenhouse Gas Inventories Programme, edited by: Eggleston, H. S., Buendia, L., Miwa, K., Ngara, T., and Tanabe, K., 1.1–1.21, IGES, Hayama, 2006. IPCC: Summary for Policymakers, in: Climate Change 2014: Synthesis Report. Contribution of Working Groups I, II and III to the Fifth Assessment Report of the Intergovernmental Panel on Climate Change, edited by: Pachauri, R. K. and Meyer, L. A., IPCC, Geneva, 1–31, 2014. Jaurena, G., Cantet, J. M. M., Arroquy, J. I., Colombatto, D., Palladino, R. A., Wawrzkiewicz, M., and Colombatto, D.: Prediction of the Ym factor for livestock from on-farm accessible data, Animal, 177, 52–62, doi:10.1016/j.livsci.2015.04.009, 2015. Jégo, G., Bélanger, G., Tremblay, G. F., Jing, Q., and Baron, V. S.: Calibration and performance evaluation of the STICS crop model for simulating timothy growth and nutritive value, F. Crop. Res., 151, 65–77, doi:10.1016/j.fcr.2013.07.003, 2013.
www.biogeosciences.net/14/1403/2017/
1415
Kadzere, C. T., Murphy, M. R., Silanikove, N., and Maltz, E.: Heat stress in lactating dairy cows: A review, Livest. Prod. Sci., 77, 59–91, doi:10.1016/S0301-6226(01)00330-X, 2002. Kasuya, H. and Takahashi, J.: Methane emissions from dry cows fed grass or legume silage, Asian-Australasian J. Anim. Sci., 23, 563–566, doi:10.5713/ajas.2010.90488, 2010. Keating, T. and O’Kiely, P.: Comparison of old permanent grassland, Lolium perenne and Lolium multiflorum swards grown for silage 4. Effects of varying harvesting date, Irish J. Agric. Food Res., 39, 55–71, 2000. Kering, M. K., Guretzky, J., Funderburg, E., and Mosali, J.: Effect of Nitrogen Fertilizer Rate and Harvest Season on Forage Yield, Quality, and Macronutrient Concentrations in Midland Bermuda Grass, Commun. Soil Sci. Plant Anal., 42, 1958–1971, doi:10.1080/00103624.2011.591470, 2011. King, C., McEniry, J., Richardson, M., and O’Kiely, P.: Yield and chemical composition of five common grassland species in response to nitrogen fertiliser application and phenological growth stage, Acta Agric. Scand. B, 62, 644–658, doi:10.1080/09064710.2012.687055, 2012. Kipling, R. P., Bannink, A., Bellocchi, G., Dalgaard, T., Fox, N. J., Hutchings, N. J., Kjeldsen, C., Lacetera, N., Sinabell, F., Topp, C. F. E., van Oijen, M., Virkajärvi, P., and Scollan, N. D.: Modeling European ruminant production systems: Facing the challenges of climate change, Agric. Syst., 147, 24–37, doi:10.1016/j.agsy.2016.05.007, 2016. Knapp, J. R., Laur, G. L., Vadas, P. A., Weiss, W. P., and Tricarico, J. M.: Invited review: Enteric methane in dairy cattle production: quantifying the opportunities and impact of reducing emissions, J. Dairy Sci., 97, 3231–3261, doi:10.3168/jds.2013-7234, 2014. Kobayashi, H., Takahashi, Y., Matsumoto, K., and Nishiguchi, Y.: Changes in nutritive value of italian ryegrass (Lolium multiflorum Lam.) during overwintering period, Plant Prod. Sci., 11, 228–231, 2008. Kottek, M., Grieser, J., Beck, C., Rudolf, B., and Rubel, F.: World map of the Köppen-Geiger climate classification updated, Meteorol. Zeitschrift, 15, 259–263, doi:10.1127/09412948/2006/0130, 2006. Lavorel, S. and Grigulis, K.: How fundamental plant functional trait relationships scale-up to trade-offs and synergies in ecosystem services, J. Ecol., 100, 128–140, doi:10.1111/j.13652745.2011.01914.x, 2012. LeBauer, D. and Treseder, K.: Nitrogen limitation of net primary productivity in terrestrial ecosystems is globally distributed, Ecology, 89, 371–379, 2008. Lee, M., Jones, E., Moorby, J., Humphreys, M., Theodorou, M., and Scollan, N.: Production responses from lambs grazed on Lolium perenne selected for an elevated water-soluble carbohydrate concentration, Anim. Res. EDP Sci., 50, 441–449, doi:10.1051/animres:2001106, 2001. Lee, M., Manning, P., Rist, J., Power, S. A., and Marsh, C.: A global comparison of grassland biomass responses to CO2 and nitrogen enrichment., Philos. Trans. R. Soc. Lond. B, 365, 2047–2056, doi:10.1098/rstb.2010.0028, 2010. Machado, L., Magnusson, M., Paul, N.A., De Nys, R., and Tomkins, N.: Effects of marine and freshwater macroalgae on in vitro total gas and methane production, PLoS One, 9, 1–11, doi:10.1371/journal.pone.0085289, 2014.
Biogeosciences, 14, 1403–1417, 2017
1416
M. A. Lee et al.: Forage quality declines with rising temperatures
Manning, P.: The impact of nitrogen enrichment on ecosystems and their services, Soil Ecology and Ecosystem Services, edited by: Wall, D. H., Bardgett, R. D., Behan-Pelletier, V., Herrick, J. E., Jones, H., Ritz, K., Six, J., Strong, D. R., and Van Der Putten, W. H., 256–269, 2012. March, M. D., Haskell, M. J., Chagunda, M. G. G., Langford, F. M., and Roberts, D. J.: Current trends in British dairy management regimens, J. Dairy Sci., 97, 7985–7994, doi:10.3168/jds.20148265, 2014. Martin, A. R. and Isaac, M. E.: Plant functional traits in agroecosystems: A blueprint for research, J. Appl. Ecol., 52, 1425–1435, doi:10.1111/1365-2664.12526, 2015. McCartney, D. H., Lardner, H. A., and Stevenson, F. C.: Economics of backgrounding calves on Italian ryegrass (Lolium multiflorum) pastures in the Aspen Parkland, Can. J. Anim. Sci., 88, 19– 28, doi:10.4141/CJAS07064, 2008. Mceniry, J., King, C., and O’Kiely, P.: Silage fermentation characteristics of three common grassland species in response to advancing stage of maturity and additive application, Grass Forage Sci., 69, 393–404, doi:10.1111/gfs.12038, 2014. Moraes, L. E., Strathe, A. B., Fadel, J. G., Casper, D. P., and Kebreab, E.: Prediction of enteric methane emissions from cattle, Glob. Change Biol., 20, 2140–2148, doi:10.1111/gcb.12471, 2014. Nashiki, M., Narita, H., and Higashiyama, Y.: Herbage mass, nutritive value and palatability of five grass weeds for cattle in the northern Tohoku region in Japan, Weed Biol. Manag., 5, 110– 117, doi:10.1111/j.1445-6664.2005.00171.x, 2005. Nielsen, N. I., Volden, H., Åkerlind, M., Brask, M., Hellwing, A. L. F., Storlien, T., and Bertilsson, J.: A prediction equation for enteric methane emission from dairy cows for use in NorFor, Acta Agric. Scand. Sect. A, 63, 126–130, doi:10.1080/09064702.2013.851275, 2013. O’Donovan, M., Lewis, E., and Kiely, P.: Requirements of future grass-based ruminant production systems in Ireland, Irish J. Agric. Food Res., 50, 1–21, 2011. O’Neill, B. F., Deighton, M. H., O’Loughlin, B. M., Mulligan, F. J., Boland, T. M., O’Donovan, M., and Lewis, E.: Effects of a perennial ryegrass diet or total mixed ration diet offered to springcalving Holstein-Friesian dairy cows on methane emissions, dry matter intake, and milk production, J. Dairy Sci., 94, 1941–1951, doi:10.3168/jds.2010-3361, 2011. Ominski, K. H., Boadi, D. A., and Wittenberg, K. M.: Enteric methane emissions from backgrounded cattle consuming allforage diets, Can. J. Anim. Sci., 86, 393–400, doi:10.4141/A05051, 2006. Patra, A. K.: Prediction of enteric methane emission from cattle using linear and non-linear statistical models in tropical production systems, Mitig. Adapt. Strateg. Glob. Chang., 1–22, doi:10.1007/s11027-015-9691-7, 2015. Patra, A. K.: Prediction of enteric methane emission from buffaloes using statistical models, Agric. Ecosyst. Environ., 195, 139–148, doi:10.1016/j.agee.2014.06.006, 2014. Pinheiro, J. C. and Bates, D. M.: Mixed effects models in S and S-Plus, Springer Verlag, New York, 2000. Pontes, L. D. S., Soussana, J. F., Louault, F., Andueza, D., and Carrère, P.: Leaf traits affect the above-ground productivity and quality of pasture grasses, Funct. Ecol., 21, 844–853, doi:10.1111/j.1365-2435.2007.01316.x, 2007a.
Biogeosciences, 14, 1403–1417, 2017
Pontes, L. S., Carrère, P., Andueza, D., Louault, F., and Soussana, J. F.: Seasonal productivity and nutritive value of temperate grasses found in semi-natural pastures in Europe: Responses to cutting frequency and N supply, Grass Forage Sci., 62, 485–496, doi:10.1111/j.1365-2494.2007.00604.x, 2007b. R Development Core Team: R: A Language and Environment for Statistical Computing, R Found. Stat. Comput., Vienna, Austria, 2016. Ramin, M. and Huhtanen, P.: Development of equations for predicting methane emissions from ruminants, J. Dairy Sci. 96, 2476– 2493, doi:10.3168/jds.2012-6095, 2013. Ramirez, R. G.: In situ Digestibility of Neutral Detergent Fiber of Introduced Cenchrus ciliaris and Six Native Mexican Grasses Consumed by Small Ruminants, J. Appl. Anim. Res., 31, 53–57, doi:10.1080/09712119.2007.9706629, 2007. Richards, S. A.: Testing ecological theory using the informationtheoretic approach: Examples and cautionary results, Ecology, 86, 2805–2814, doi:10.1890/05-0074, 2005. Robinson, T. P., William Wint, G. R., Conchedda, G., Van Boeckel, T. P., Ercoli, V., Palamara, E., Cinardi, G., D’Aietti, L., Hay, S. I., and Gilbert, M.: Mapping the global distribution of livestock, PLoS One, 9, 1–13, doi:10.1371/journal.pone.0096084, 2014. Roumet, C., Laurent, G., and Roy, J.: Leaf structure and chemical composition as affected by elevated CO2 : Genotypic responses of two perennial grasses, New Phytol., 143, 73–81, doi:10.1046/j.1469-8137.1999.00437.x, 1999. Sahin, E., Tosun, M., and Haliloglu, K.: Some agricultural and quality properties of ulubag ecotype lines of wild orchardgrass (Dactylis glomerata L.), Turkish J. F. Crop., 17, 191–197, 2012. Schils, R. L. M., Olesen, J. E., del Prado, A., and Soussana, J. F.: A review of farm level modelling approaches for mitigating greenhouse gas emissions from ruminant livestock systems, Livest. Sci., 112, 240–251, doi:10.1016/j.livsci.2007.09.005, 2007. Skladanka, J., Adam, V., Ryant, P., Doleal, P., and Havlek, Z.: Can Festulolium, Dactylis glomerata and Arrhenatherum elatius be used for extension of the autumn grazing season in central Europe?, Plant Soil Environ., 56, 488–498, 2010. Smit, H. J., Tas, B. M., Taweel, H. Z., Tamminga, S., and Elgersma, A.: Effects of perennial ryegrass (Lolium perenne L.) cultivars on herbage production, nutritiional quality and herbage intake of grazing dairy cows, Grass Forage Sci., 297–309, 2005. Springmann, M., Godfray, H. C. J., Rayner, M., and Scarborough, P.: Analysis and valuation of the health and climate change cobenefits of dietary change, P. Natl. Acad. Sci. USA, 113, 4146– 4151, doi:10.1073/pnas.1523119113, 2016. Steinfeld, H., Gerber, P., Wassenaar, T., Castel, V., Rosales, M., and De Haan, C.: Livestock’s Long Shadow: Environmental Issues and Options, Food and Agriculture Organisation, Rome, 2006. Storlien, T. M., Volden, H., Almøy, T., Beauchemin, K. A., McAllister, T. A., and Harstad, O. M.: Prediction of enteric methane production from dairy cows, Acta Agric. Scand. Sect. A, 64, 98– 109, doi:10.1080/09064702.2014.959553, 2014. Suleiman, A., Okine, E. K., Goonewardene, L. A., Day, P. A., Yaremcio, B., and Recinos-Diaz, G.: Yield and feeding of prairie grasses in east-central Alberta, J. Range Manag., 52, 75–82, 1999. Surmen, M., Yavuz, T., Albayrak, S., and Cankaya, N.: Forage yield and quality of perennial ryegrass (Lolium perenne L.) lines in the
www.biogeosciences.net/14/1403/2017/
M. A. Lee et al.: Forage quality declines with rising temperatures black sea coastal area of Turkey, Turkish J. F. Crop., 18, 40–45, 2013. Thornton, P. K. and Herrero, M.: Potential for reduced methane and carbon dioxide emissions from livestock and pasture management in the tropics, P. Natl. Acad. Sci. USA, 107, 19667–19672, doi:10.1073/pnas.0912890107, 2010. Thornton, P. K., Jones, P. G., Ericksen, P. J., and Challinor, A. J.: Agriculture and food systems in sub-Saharan Africa in a 4 ◦ C world, Philos. T. R. Soc. A, 369, 117–36, doi:10.1098/rsta.2010.0246, 2011. Tilman, D. and Clark, M.: Global diets link environmental sustainability and human health, Nature, 515, 518–522, 2014. Ulyatt, M. J., Lassey, K. R., Shelton, I. D., and Walker, C. F.: Methane emission from dairy cows and wether sheep fed subtropical grass-dominant pastures in midsummer in New Zealand, New Zeal. J. Agric. Res., 45, 227–234, doi:10.1080/00288233.2002.9513513, 2002. Waghorn, G. and Clark, D.: Feeding value of pastures for ruminants, N. Z. Vet. J., 52, 332–341, doi:10.1080/00480169.2004.36449, 2004. Weller, R. F. and Cooper, A.: Seasonal changes in the crude protein concentration of mixed swards of white clover/perennial ryegrass grown without fertilizer N in an organic farming system in the United Kingdom, Grass Forage Sci., 56, 92–95, doi:10.1046/j.1365-2494.2001.00248.x, 2001.
www.biogeosciences.net/14/1403/2017/
1417
Wollenberg, E., Richards, M., Smith, P., Havlík, P., Obersteiner, M., Tubiello, F. N., Herold, M., Gerber, P., Carter, S., Reisinger, A., van Vuuren, D., Dickie, A., Neufeldt, H., Sander, B. O., Wassmann, R., Sommer, R., Amonette, J. E., Falcucci, A., Herrero, M., Opio, C., Roman-Cuesta, R., Stehfest, E., Westhoek, H., Ortiz-Monasterio, I., Sapkota, T., Rufino, M. C., Thornton, P. K., Verchot, L., West, P. C., Soussana, J.-F., Baedeker, T., Sadler, M., Vermeulen, S., and Campbell, B. M.: Reducing emissions from agriculture to meet the 2 ◦ C target, Glob. Change Biol., 22, 3859–3864, doi:10.1111/gcb.13340, 2016. Wood, S. A., Karp, D. S., Declerck, F., Kremen, C., Naeem, S., and Palm, C. A.: Functional traits in agriculture?: agrobiodiversity and ecosystem services, Trends Ecol. Evol., 30, 531–539, doi:10.1016/j.tree.2015.06.013, 2015. Zhao, Y., Ma, M., and Li, X.: Nutritional value and amino acid content of four grasses in Eastern Inner Mongolia, J. Anim. Vet. Adv., 11, 3928–3936, 2012.
Biogeosciences, 14, 1403–1417, 2017