FOREIGN DIRECT INVESTMENT STOCK CONTRIBUTES TO ECONOMIC GROWTH IN THE U.S. ECONOMY
Lucyna Kornecki, Vladislav Borodulin Department of Economics, Finance, and Information System College of Business Embry-Riddle Aeronautical University (ERAU) 600 S. Clyde Morris Blvd. Daytona Beach, FL 32114
[email protected], phone: (386) 226-4963, fax: (383) 226-6696
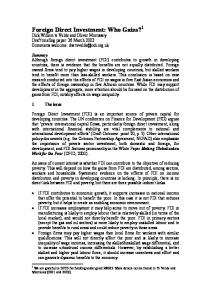
ABSTRACT The first part of this paper describes the foreign direct investment (FDI) as a factor facilitating globalization process in the world economy and describes the long run economic growth in the U.S. economy indicating the cyclical character of FDI. It includes analyzes related to inward and outward FDI inflows and inward and outward FDI stock as a percentage of GDP. The second part of this research has empirical character and focuses on the impact of inward FDI stock on economic growth in the U.S. economy. The analyzed model of economic growth proved the strong impact of FDI stock on output growth and verified the hypothesis that FDI stock, as compared with domestic capital and labor constitutes an essential factor of economic growth in the U.S. economy. INTRODUCTION The continuing growth of foreign direct investment in the United States (U.S.) brought a growing interest in examining its impact on the rate of economic growth. The immense literature on economic growth in the United States is composed of studies that concentrate on measuring the domestic variables that affect U.S. economic growth. However, the impact of foreign direct investment on the economic growth of the United States has not received the attention that it deserves (Asheghian, 2004). The period between 1978 and 1997 was characterized by a major influx of foreign direct investment to the United States. In 1997, foreign controlled foreign firms accounted for 6.3 percent of US GDP, 4.9 percent of non-bank employment, 20 percent of US exports of goods, 30 percent of US imports of goods (Ford and Champion, 2002). This research provided empirically tested evidence on the effect of FDI on economic growth in the U.S. It examined the link between inward FDI stock and economic growth and found that foreign direct investment has a significant impact on the United States economic growth.
LITERATURE REVIEW The inflow of FDI increased rapidly during the last two decades in almost every region of the world. A number of empirical studies on the role of FDI in host countries suggest that FDI is an important source of capital, complements domestic private investment, and is usually associated with new job opportunities and enhancement of technology transfer, and boosts overall economic growth in host countries (Chowdhury & Mavrotas, 2006). The relationship between growing FDI stock and economic growth has motivated a voluminous empirical literature in developed and developing countries. FDI has been acknowledged as most crucial factor in enhancing economic development and the standard of living for emerging economies. Based on references, the consensus seems to be that there is a positive correlation between FDI inflows and economic growth, provided that the receiving countries have reached a minimum level of educational, technological and/or infrastructure development (Hansen & Rand, 2006). South Korea, Singapore, and Taiwan are examples of nations outside the OECD countries that have greatly benefited from FDI and the integration in the global economy. In recent years, China and India have made remarkable progress in attracting FDI and realizing technological and economic success. A number of studies find that FDI inflows have a strong and positive effect on economic growth in China (Tian, Lin, & Lo, 2004). In Russia, FDI appears to have been an essential force in supporting the economy during the initial chaos of transition (Brock, 2005). The CEE countries increased their participation in the world economy since the fall of communism; particularly over the last few years. They accepted the challenge of trade openness and attracted significant foreign direct investment (Cernat & Vranceanu, 2002). The CEE countries acknowledge FDI as an essential tool in the development and modernization of their economies (Kornecki & Raghavan, 2008). Salehizadeh, Asheghian and others confirm the existence of a positive and significant relationship between FDI and the economic growth in the United States (Asheghian, 2004). He examines the determinants of economic growth in the United States over time uses a model based on the postulates of de Mello based on and found a causal relationships between FDI growth and economic growth is uni-directional, running from economic growth to FDI and a causal relationships between FDI growth and total factor productivity growth is uni-directional, running from FDI to total factor productivity According to the U.S. Bureau of Labor Statistics a rapid inflow of foreign investment paralleled the brisk productivity growth, suggesting a positive link between the growth of productivity and foreign capital. Applying a Cobb-Douglas production function to data from 1988 to 1999, it is found that foreign capital accounted for almost 16% of overall U.S. productivity growth (Goss, Wingender & Torau, 2007). Salehizadeh regression estimates confirm the existence of a positive and significant relationship between FDI and US economic growth rates (Salehizadeh, 2005).
RESEARCH METHODOLOGY The goal of this study is to investigative relationship between FDI and economic growth and determine the extent to which foreign capital contributes to U.S. productivity growth. Over the last two decades, the U.S. has attracted more inflows of foreign direct investment than any other country. This research analyzes the relationship between foreign capital inflow and U.S. economic growth including FDI stock, as one of the determinants influencing growth of the U.S. economy. In the past studies did not attempt to relate FDI to productivity growth. Instead, researchers focused on FDI impact on manufacturing sector and employment (Goss, Wingender & Torau, 2007). Research methodology related to FDI and economic growth relationship in the literature has been based mostly on the production function model (Brock, 2005). The production function model investigates the relationship between labor (L), capital (K) and the economic growth, with the GDP shown as a function of labor and capital (Sawyer, 2006). The theoretical framework of this study is based upon the economic growth model with output determined by the L (labor) and K (Gross Fixed Capital Formation) plus inward FDI stock and export (X) as an additional factors influencing output and productivity in the economy. A modified Cobb-Douglas Production function will be used based on a pooled cross section data for the U.S. for the period of 1981-2007 to study the impact of inputs such as labor, domestic capital plus inward U.S. FDI stock and export on economic growth. The model assumes that inward FDI helps to increase capital stock in the U.S. economy which in turn increases the rate of economic growth. It shows economic growth coupled with the growth in FDI stock. Applying a Cobb-Douglas production function to data from 1981 to 2007, it is found that foreign capital accounted for almost 23,28% of overall U.S. economic growth. Our data is obtained from the United Nations Conference on Trade and Development (UNCTAD), Bureau of Economic Analysis, Bureau of Labor Statistics, United Nations Economic Commission for Europe (UNECE), World Investment Reports, as well as other selected databases.
FDI FACILITATES GLOBALIZATION PROCESS The FDI constitutes an important factor facilitating the globalization process in the world. Globalization is a dynamic process of liberalization, openness, and international integration across a wide range of markets, from labor to goods and from services to capital and technology. Globalization is based upon the freedom to trade with the rest of the world and to capitalize on each country’s comparative advantage, the freedom to invest where returns on capital are greatest (Guillermo de la Dehesa, 2006, p.1).
Globalization signifies a process of intensification of economic, political, and cultural interconnectedness among the various actors in the global system. In the economic arena it represents a process of integration of national economies with the global economy (Kidane Mengisteab, 2005). Maler empirically examined globalization and considered FDI as one of three modes of globalization together with foreign trade, and international financial flows (Kahai and Simmons, 2005). Kearney’s index, ranks World inward FDI and includes opinions about the FDI of the World largest 1,000 firms and responses from participating executives of 68 countries ( table 1). It tracks the impact of likely political, economic and regulatory changes on the FDI. The index reveals FDI flows and the factors that drive corporate decisions to invest abroad. Companies included in the survey are responsible for about 70 percent of global FDI flows and generate more than $27 trillion in annual revenues (http://www.atkearney.com/main.taf?p=5,3,1,140,1). The major findings in A.T. Kearney's 2005 FDI report indicates that China and India, emerging market countries are the 1st and 2nd most attractive FDI locations in the world and have achieved unprecedented levels of investor confidence. The United States dropped to 3rd place on corporate investors' lists, but remains a strong FDI magnet. Western Europe, other than the United Kingdom, lost FDI confidence due to increasing Table 1. Kearney Foreign Direct Investment Confidence Index 2005 China 2.197 India 1.951 USA 1.421 UK 1.398 Poland 1.363 Russia 1.341 Brazil 1.336 Austria 1.276 Germany 1.267 Hong Kong 1.208 Hungary 1.157 Chech Republic 1.136 Turkey 1.133 France 1.097 Japan 1.082 Mexico 1.081 Spain 1.075 Singapore 1.072 Italy 1.055 Thailand 1.051 http://www.atkearney.com/main.taf?p=5,3,1,140,1
ECONOMIC GROWTH IN THE U.S. ECONOMY
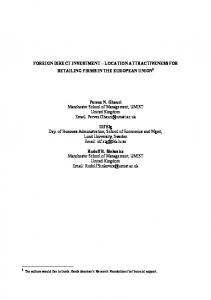
Over the last two decades, the U.S. has attracted more inflows of foreign direct investment (FDI) than any other country. General indications have pointed to FDI inflows as being a positive contributing factor to key US macroeconomic indicators. The U.S. economy have experienced alternating periods of expansion and contraction in economic activity. Economic fluctuations are the rise and fall of economic activity relative to the long-term growth trend of the economy. A long run economic growth rate in the U.S. economy and shows periods of rapid expansion, as well as slow economic growth and decline in output. The ups and downs in the level of economic activity represent the business cycle in the U.S. economy. The decline during the Great Depression of the early 1930’s last long period of time and reduced the nation’s total production by 30% accompanied by 26% of unemployment rate. Since then, there have been recessions but no depression. The national Bureau of Economic Research (NBER) have traced the U.S. economy back to 1854. The economy experienced 32 peak-to trough-to peak cycles. The longest contraction lasted five years from 1873 to 1879 and the longest expansion lasted nearly 10 years, beginning in 1991. Despite the ups and downs of the U.S. economy measured by real GDP has grown dramatically over the long run. Between 1976 and 2006 the output of the economy measured by real GDP increased more then 3 times (Figure #1). Figure 1. Real GDP in the U.S. Economy (in thousands, 1976 – 2006) 14,000,000 12,000,000 10,000,000 8,000,000 Series1 6,000,000 4,000,000 2,000,000 1970
1975
1980
1985
1990
1995
2000
2005
2010
UNCTAD Handbook of Statistics On-line / VII. Indicators of development / 7.1 Population, area and gross domestic product (1992-2006)
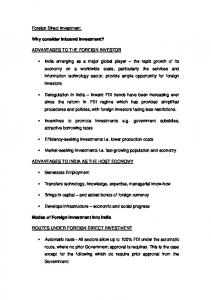
The figure #2 shows the rate of economic growth in the United States in the long run between 1977 and 2007. It shows a periods of economic expansion and contraction and includes three economic recessions: recession of 80’s, recession of 90’s and the recession of 2001. The current economic recession of 2008- 2009 in not included in the research as statistical data are not available yet. Current economic crises have been caused by a combination of several factors including the US mortgage lending policies and an insufficient financial policies and regulations. The financial crisis started in the US and spread quickly into the world banking sectors. Financial institution around the globe, investment and commercial banks suffered massive losses, and a number of well-established financial institutions faced bankruptcy (Lehman Brothers, Merrill Lynch etc.). During the 1980’s the U.S. entered in eight year of continuous economic growth. The key factor that sustained the economic expansion was the ability of the U.S. to attract capital inflows from abroad. The economic expansion in the United States has been sustained by the willingness of foreign investors to provide capital. If foreign investors had not provided the U.S. with the capital during the 1980, the economic expansion would have been brought to an end by rising interest rates (Henriks& Marc,1990). Figure #2
8.0% 6.0% 4.0% 2.0% 0.0% ‐2.0% ‐4.0% 1977 1978 1979 1980 1981 1982 1983 1984 1985 1986 1987 1988 1989 1990 1991 1992 1993 1994 1995 1996 1997 1998 1999 2000 2001 2002 2003 2004 2005
A n n u al R eal G D P G ro wth R ate
Annual U.S R eal GD P Growth R ate from 1977 to 2005
Ye a rs
UNCTAD Handbook of Statistics On-line / VII. Indicators of development / 7.1 Population, area and gross domestic product (1992-2004) During the second part of the 1990s, the U.S. experienced exceptional economic growth. The data in the next chapter shows the increasing importance of FDI to the U.S. economy in this period of time. Paralleling the growth in output was a rapid increase in the FDI inflow suggesting a positive link between the productivity and foreign capital inflow (Goss, Wingender & Torau, 2007).
INWARD FDI IN THE U.S.ECONOMY
FDI refers to an investment made to acquire lasting interest in enterprises operating outside of the economy of the investor. The investor’s purpose is to gain an effective voice in the management of the enterprise. Some degree of equity ownership is almost always considered to be associated with an effective voice in the management of an enterprise and a threshold of 10% equity ownership qualifies an investor as a foreign direct investor (the Balance of Payments Manual BPM5: Fifth Edition, International Monetary Fund, 1993) (www.unctad.org/Templates/Page.asp?intItemID=3146&lang=1). Starting from 1960s, the theories of FDI tried to find out the elements that stimulated a U.S. firm’s decision to invest abroad, as most of the FDI originated from the United States and were connected to the U.S. multinational corporation. Most empirical study has concentrated on assessing the factors that induce a U.S. firm to invest in a foreign country. In the early 1970s the direction of FDI changed and the United States became a significant recipient of FDI. The U.S. became a host for foreign affiliates as well as a home for multinational firms. (Hendriks & Mark,1990). The period between 1978 and 1997 was characterized by a major influx of foreign direct investment to the United States. The flow of international capital supported the U.S. economy in the 1980s and has been a key factor expanding economy. The importance of FDI into the U.S. has risen during the 1980’s. A number of developments in the 1980s encouraged the flow of capital to the U.S. from abroad. Foreign capital gravitated to the U.S. in the 1980s because of favorable factors, such as: institutionalization of savings, deregulation of capital control, the diversification of portfolios, shrinkage of the U.S. banks foreign operations, a rise in non -banking activities in the U.S.(especially Japan) and attractive investment returns in the U.S. for a European companies. In 1987, FDI from Japan has accelerated, as Japan set up production facilities in the U.S. The inward FDI in the U.S. economy originated from a developed European countries, such as: France, Germany, Switzerland, United Kingdom, Netherlands plus from Canada and Japan. Inflow of FDI from Europe in the 1980s took place as a result of stagnating European economy. Higher inflow of FDI from the U.K. reflected long-standing historical ties with the United States and a reluctance to move into the new developing European markets of Eastern Europe.
Figure #3
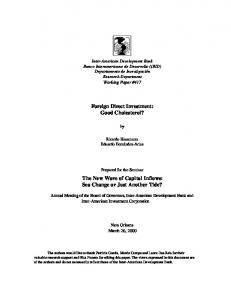
350.00 300.00 250.00 200.00 150.00 100.00 50.00 0.00 1976 1977 1978 1979 1980 1981 1982 1983 1984 1985 1986 1987 1988 1989 1990 1991 1992 1993 1994 1995 1996 1997 1998 1999 2000 2001 2002 2003 2004 2005
F DI Inflows , in billions of $
U.S F D I Inflows (billions of US dollars ) 1976 to 2005
Ye a rs
UNCTAD World Investment Report 2006 http://www.unctad.org/Templates/Page.asp?intItemID=3277&lang=1
Annex
Tables
Based on the data in Figure #3 the FDI inflows dropped during the recessionary economy: between 1981and 1984, 1990 and 1993 and between 2001 and 2004- indicating cyclical character of the foreign direct investment. Following the decline of the economic activities during the recessionary economy the FDI inflows had been declining. This implies that foreign capital was responsive to the U.S. business cycle over analyzed period of time.
INWARD FDI VERSUS OUTWARD FDI
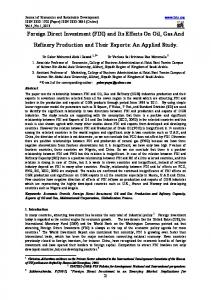
Based on Figure #4 inward FDI outperformed outward FDI in the U.S. economy during the 1980’s (1981-1990). The outward FDI exceeded inward FDI during the 1990’s recession and during the years following the recession (1991 to 1995). The outward FDI exceeded inward FDI in 2002, 2003 and 2004, the three years after 2001 recession. To summarize, during the economic recessions the inward FDI had been declining when outward FDI had been increasing indicating outflow of the capital from the U.S. The decline of the FDI inflows during economic recessions and increase of the FDI outflows during recessionary period indicate the cyclical character of inward and outward FDI.
Figure #4 C omparison of U.S F DI Outflows and Inflows (billions of US $) 1976 to 2005
F D I F l o w s b i l l i o n s o f $
350.00 300.00 250.00 200.00 150.00 100.00 50.00 ‐
19 7 19 6 7 19 7 7 19 8 79 19 8 19 0 8 19 1 8 19 2 8 19 3 84 19 8 19 5 8 19 6 8 19 7 88 19 8 19 9 9 19 0 9 19 1 92 19 9 19 3 9 19 4 9 19 5 96 19 9 19 7 9 19 8 9 20 9 00 20 0 20 1 0 20 2 0 20 3 0 20 4 05
‐50.00
Years InF lows
OutF lows
UNCTAD World Investment Report 2006 http://www.unctad.org/Templates/Page.asp?intItemID=3277&lang=1
Annex
Tables
INWARD FDI AS A PERCENTAGE OF GDP The figure below examines the FDI inflows as a percentage of GDP in the U.S. economy. Inward FDI as a percentage of GDP in the U.S increased sharply from 1% in 1996 to 3.25% in 2000 and reached the highest historical level. The figure #6 indicates that till 1991 outflows as a percentage of GDP were below 0.5% and in the 1990’s increased significantly reaching the pick in 2001(2.3%) and in 2004 (2.4%).
Figure #5 U.S F D I Inflows as a P erc entag e of R eal G D P , 1976 to 2005
F D I In flo w s A s % o f G D P
3.50% 3.00% 2.50% 2.00% 1.50% 1.00% 0.50% 19 76 19 77 19 78 19 79 19 80 19 81 19 82 19 83 19 84 19 85 19 86 19 87 19 88 19 89 19 90 19 91 19 92 19 93 19 94 19 95 19 96 19 97 19 98 19 99 20 00 20 01 20 02 20 03 20 04 20 05
0.00%
Yea rs
UNCTAD World Investment Report 2006 http://www.unctad.org/Templates/Page.asp?intItemID=3277&lang=1
Annex
Tables
Figure #6 U.S F DI Outflows as a P erc entag e of R eal GDP , 1976 to 2005 F D I O u tfl o w s A s % o f G D P
3.0% 2.5% 2.0% 1.5% 1.0% 0.5% 0.0% 1976 1977 1978 1979 1980 1981 1982 1983 1984 1985 1986 1987 1988 1989 1990 1991 1992 1993 1994 1995 1996 1997 1998 1999 2000 2001 2002 2003 2004 2005
‐0.5%
Years
UNCTAD World Investment Report 2006 http://www.unctad.org/Templates/Page.asp?intItemID=3277&lang=1
Annex
Tables
FDI STOCK AS A PERCENTAGE OF GDP This part of the paper focuses on the inward FDI stock as a percentage of GDP. Discussed previously inward FDI flow measures the amount of FDI entering a country during a one year period, while the FDI stock is the total amount of productive capacity owned by foreigners in the host country. FDI stock grows over time and includes all retained earnings of foreign-owned firms held in cash and investments (Kornecki, 2007). According to the data in Figure #7 the inward U.S.FDI stock as a percentage of GDP climbed from 2% to 6% during 1980,s and from 6% to 10% during 1990’s reaching a peak of almost 15% in 2005. The foreign capital as a percentage of GDP bottomed out in 1992 and 2002, the years following the recession of the early 1990s and 2001. The relatively high percentage of the FDI stock in GDP indicates important role of the FDI in the U.S. economy. Figure #7 16.0% 14.0% 12.0% 10.0% 8.0% 6.0% 4.0% 2.0% 2005
2004
2003
2002
2001
2000
1999
1998
1997
1996
1995
1994
1993
1992
1991
1990
1989
1988
1987
1986
1985
1984
1983
1982
1981
0.0% 1980
Inward F DI S tock As % of GDP
U .S Inward F D I S toc k As a P erc entag e of R eal G D P , 1980 to 2005
Y e a rs
UNCTAD World Investment Report 2006 http://www.unctad.org/Templates/Page.asp?intItemID=3277&lang=1
Annex
Tables
REGRESSION MODEL A modified Cobb-Douglas production function based on a pooled cross section data for the U.S. economy (1981-2007) was used to study the impact of inputs such as: labor, domestic capital, FDI stock and multifactor productivity (MFP) on economic growth. Multifactor productivity index reflects the joint effects of many factors including new technologies, economies of scale, managerial skill, and changes in the organization production. Our production-function model is explained below. (1) Where: Y = Real Gross Domestic Product (GDP) C = Scale parameter MFP = state of economic environment (factors of productivity other than export and direct investment) K = Gross Fixed Capital Formation (GFCF) L = Labor Force elogR = The rate of productivity change over time. Rewriting (1) in terms of the rate of change over time: (2) In our model, the productivity change (R) is assumed to be positively influenced by both the foreign direct investment stock (FDI) and the rate of export growth (X). The productivity change defined as X (export) growth plus FDI growth: −
−
−
R = c X + d FD I
(3)
Substituting equation (3) into equation (2) we have (4) Where: −
Y
= The average annual rate of growth of GDP = The average annual rate of growth of MFP
−
K
= The average annual rate of growth of capital (GFCF)
−
L
= The average annual rate of growth of labor force
−
X
= The average annual rate of growth of export
−
FDI
= The average annual rate of growth of inward FDI stock
Table 2. Results of Production Function Estimation (1981-2007) Constant
Capital
Labor
Export
Inward Stock
MFP
RA
2
0.1591* 0.4482 0.0172 0.0519* 0.601* 0.8668 (4.358) (1.303) (1.022) (2.63) (5.132) * Denotes that variables are significant at the 5 percent level. t-values are shown in brackets * RA denotes adjusted R2 adjusted for degrees of freedom.
0.0095
All the examined variables in Table 2 except export and labor growth are significant at the five percent level (* over the variables). From the estimated coefficients we constructed the sources of economic growth decomposition in Table 3. From Table 3 we can see that the FDI stock shows relatively high rate of growth (0.50) in comparison with domestic capital (0.42%). However growth rate of labor (0.56%) is higher then growth rate of capital in the U.S. economy. FDI stock contributes more to GDP growth (23.28 %) then domestic capital (19.68%) while labor contributes the most (26.05%). This illustrate that results the FDI as compared to domestic capital has a significant influence on GDP growth in the U.S. economy and constitutes crucial factor determining economic growth. This study tested the hypothesis that the FDI contributes significantly to the economic growth of the U.S. economy.
Table 3. Sources of Economic Growth in U.S. Economy (1981-2007) Growth Ratea
Share
Average Growth Rateb
Factors of Production Domestic Capital .42% 19.68% 2.66% Labor .56% 26.05% 1.25% Productivity Change Export 0.06% 2.77% 3.46% FDI 0.50% 23.28% 9.64% MFP 0.61% 28.22% 1.01% Total (GDP) 2.15% 100% a The numbers of this column is obtained by multiplying the estimated elasticity’s by the average rate of growth of the factors concerned. b Average values of various variables (Mean values)
CONCLUSIONS This study implies that foreign capital in the U.S. economy was responsive to the U.S. business cycle over analyzed period of time. Following the decline of the economic activities during the recessionary economy the FDI inflows had been declining but FDI outflows had been increasing indicating the cyclical character of inward and outward FDI. During analyzed periods of economic recessions FDI outflows outperformed FDI inflows. The recent recession in the U.S. economy (2007-2010) is not included in this study as statistical data is not available. Authors are planning on focusing on current recession and its impact on FDI inflows and outflows in the near future. This research indicates that FDI contributes greatly to the economic growth in U.S. economy and constitutes a crucial factor determining economic growth. The inward FDI has increased in the U.S. in the past twenty six years to become the common type of capital flow. It is important for the U.S. economy to continue to attract foreign investment. This calls on the U.S. policy makers to formulate policies that are conducive to increasing the amount of foreign direct investment in this country. The key factor that sustained the economic expansion during the 1980’s and the second part of 1990’s was the ability of the U.S. to attract capital inflows from abroad. The economic expansion in the United States has been sustained by the willingness of foreign investors to provide capital. The regression analyzes indicates that the FDI stock in the U.S. economy shows relatively higher rate of growth in comparison with domestic capital and contributes 23.28 % to the GDP growth in comparison with domestic capital contributing 19.68%. This results point out that the FDI as compared to domestic capital has a significant influence on GDP growth in the U.S. economy and constitutes crucial factor determining economic growth. This study tested the hypothesis that the FDI contributes significantly to the economic growth in the U.S. economy, however the future regression model will include more factors influencing output of the U.S. economy. The authors will incorporate the following factors in the regression model: business cycle factor, federal fund rates and the exchange rates.
REFERENCES
Parviz, A. (2004). Determinants of economic growth in the United States: The Role of Foreign Direct Investment. The International Trade Journal, 18(1), 63-83. Brock, G. (2005). Growth in Russia during the 1990s - What role did FDI play? Post-communist economies, 17, 3, 319-329. Cernat, L., & Vranceanu, R. (2002). Globalization and development: New evidence from Central and Eastern Europe. Comparative Economic Studies, 44(4), 119-136. Chowdhury A., & Mavrotas, G. (2006). FDI and growth: What causes what? The World Economy, 29(1), 9. De la Dehesa G.(2006). Winners and losers in Globalization. .Malden,MA: Blackwell Publishing.
Ford, T. C. (2002). Essays on foreign direct investment and growth in the United States. Retrieved from ProQuest Digital Dissertations database. (AAT 3070973). Gao, T. (2005). Foreign direct investment and growth under economic integration. Journal of international economics, 67(1), 157-17. Goss, E., Wingender Jr., J. R. & Torau, M. (2007). The contribution of foreign capital to U.S. productivity growth. Quarterly Review of Economics and Finance, 47(3), 383. Hansen H., & Rand, J. (2006). On the casual links between FDI and growth in developing countries. The World Economy, 29 (1), 21. Marcin, K. (2008). How does FDI inflow affect productivity of domestic firms? The role of horizontal and vertical spillovers, absorptive capacity and competition. The Journal of International Trade & Economic Development, 17(1), 155. Retrieved from ABI/INFORM Global database. (Document ID: 1402211671). Kornecki, L. & Rhoades, D. L. (2007). How FDI Facilitates the Globalization Process and Stimulates Economic Growth in CEE. Journal of International Business Research (JIBR), Allied Academies.vol.3, 29-30. Kornecki, L. & Raghawan, S. (2008). The Impact of Inward FDI Stock on GDP Growth: An Empirical Evidence from Central and Eastern Europe. American Journal of Business Research, 1(1). A.T. Kearney. (2005). [Kearney Foreign Direct Investment Confidence Index 2005]. Global Business Policy Council 2005, Volume. Retrieved from http://www.atkearney.com/images/global/pdf/FDICI_2005.pdf Kornecki,L and Raghavan, S. (2008). FDI and Economic Growth: an Empirical Analysis of Central and Eastern European Countries. European Journal of Management.,8(4). Kornecki, L. (2006). FDI in the Polish Economy: Comparison with Central and Eastern Europe (CEE). International Research Journal Problems & Perspectives in Management, 4(3), 5-14. Li & Liu (2005). Foreign direct investment and economic growth: An increasingly endogenous relationship. World Development, 33(3), 393-407. Mueller, S.L., & Goic, S. (2002). Entrepreneurial potential in transition economies: A view from tomorrow’s leaders. Journal of Developmental Entrepreneurship, 7(4), 17. Salehizadeh, M. (2005). Foreign Direct Investment Inflows and the US Economy: An Empirical Analysis. Economic Issues, 10(2), 29-50. Retrieved from ABI/INFORM Global database. Tian, X., Lin, S., & Lo, V. I. (2004). Foreign Direct Investment and economic performance in transition economies: Evidence from China. Post-Communist Economies, 16(4), 499-510. Torau M. A. & Goss, E. (2004). The Effects of Foreign Capital on State Economic Growth. Economic Development Quarterly, 18(3), 255-268. Retrieved from ABI/INFORM Global database. United Nations Conference on Trade and Development (UNCTAD). (2003). FDI Policies for development: National and international perspectives. World Investment Report. Retrieved from www.unctad.org United Nations Conference on Trade and Development (UNCTAD). (2006). [Real GDP in the US Economy, 1976-2006]. Handbook of Statistics Online. Retrieved from http://stats.unctad.org/handbook/ReportFolders/ReportFolders.aspx United Nations Conference on Trade and Development (UNCTAD). (2006). [Annual Real GDP growth rate, 1977-2005]. Handbook of Statistics Online. Retrieved from http://stats.unctad.org/handbook/ReportFolders/ReportFolders.aspx United Nations Conference on Trade and Development (UNCTAD). (2006). [U.S. FDI Inflows, 1976-2005]. World Investment Report Annex Tables. Retrieved from www.unctad.org/Templates/Page.asp?intItemID=3277&lang=1 United Nations Conference on Trade and Development (UNCTAD). (2006). [Comparison of US FDI Outflows and Inflows, 1976-2005]. World Investment Report Annex Tables. Retrieved from: www.unctad.org/Templates/Page.asp?intItemID=3277&lang=1
United Nations Conference on Trade and Development (UNCTAD). (2006). [U.S. FDI Inflows as percentage of real GDP, 1976-2005]. World Investment Report Annex Tables. Retrieved from www.unctad.org/Templates/Page.asp?intItemID=3277&lang=1 United Nations Conference on Trade and Development (UNCTAD). (2006). [U.S. FDI Outflows as percentage of real GDP, 1976-2005]. World Investment Report Annex Tables. Retrieved from www.unctad.org/Templates/Page.asp?intItemID=3277&lang=1 United Nations Conference on Trade and Development (UNCTAD). (2006). [U.S. Inward FDI Stock as percentage of real GDP, 1980-2005]. World Investment Report Annex Tables. Retrieved from www.unctad.org/Templates/Page.asp?intItemID=3277&lang=1 Yang, B. (2008). FDI and growth: a varying relationship across regions and over time. Applied Economics Letters, 15(2), 105. Retrieved from ABI/IN FORM Global database. (Document ID: 1392843081).