Forest Management and the Dead Wood Resource in Ponderosa Pine Forests: Effects on Small Mammals1 Carol L. Chambers2 Abstract Changes in vegetation structure and composition affect habitat for wildlife. Species such as small mammals that are restricted to small home ranges and are relatively immobile may be most affected since it is more difficult to find and move to new habitat. In the southwestern United States, forest management treatments (thinning and prescribed burning) are being implemented to alter structure and function of ponderosa pine (Pinus ponderosa) ecosystems and recreate pre-settlement (ca. 1870) tree species composition and size class distribution. These forest restoration treatments will affect the availability of dead wood to wildlife (e.g., prescribed fires may consume dead wood, forest operations may create snags and logs). I livetrapped small mammals in a northern Arizona ponderosa pine forest prior to restoration treatment and found that mouse species (Peromyscus species) were associated with some dead wood elements (e.g., Gambel oak [Quercus gambelii] snags, ponderosa pine snags, ponderosa pine stumps).
Introduction Standing dead trees and logs are important components of wildlife habitat. They provide nesting, roosting, feeding, loafing, and storage sites for over 75 species of birds, mammals, reptiles, and amphibians in the Southwest (Degenhardt and others 1996, Rabe 1998, Scott 1979, Scott and Patton 1989). Many of these animals have important ecological roles, such as dispersing seeds and mychorrhizal fungi, helping to control insect populations, and serving as prey for other species (Bergvinson and Borden 1992, Maser and others 1988, Peterson 1980, Ward and Block 1995). Vertebrate population densities may change in response to change in vegetation structure and composition (see for example, Chambers and others 1999, Scott 1979, Szaro and Balda 1986). Although some wildlife species (birds, large ungulates) are highly mobile and can move to more favorable habitat (assuming it is unoccupied), many species (small mammals, reptiles, amphibians) are often restricted to relatively small areas (i.e., 2 to 20 ha per individual or population) (e.g., Hall and Morrison 1997). Forest management practices may have differential effects on vertebrate populations depending on the scale at which the treatments are applied and the size of habitat used by an organism. Ponderosa pine forests cover about 3.2 million ha in Arizona and New Mexico (Klemmedson and Smith 1979). These forests appear to be at increasing risk of 1
An abbreviated version of this paper was presented at the Symposium on the Ecology and Management of Dead Wood in Western Forests, November 2-4, 1999, Reno, Nevada. 2 Associate Professor, School of Forestry, Northern Arizona University, Flagstaff, AZ 86011 (e-mail:
[email protected])
USDA Forest Service Gen. Tech. Rep. PSW-GTR-181. 2002.
679
Dead Wood Resources and Small Mammals—Chambers
catastrophic fire as a result of 130 years of Euro-American influence. A combination of fire suppression, logging practices, insect infestations, livestock grazing, and a shift towards a warmer and wetter climate has altered the composition of ponderosa pine forests (Cochran and Hopkins 1991, Cooper 1960, Covington and Moore 1994, Grissino-Mayer and Swetnam 2000, Touchan and others 1996). Livestock grazing reduced native grasses and other fine fuels that spread low intensity fires. Grazing also exposed bare mineral soil, which allowed establishment of ponderosa pine seedlings in years following high cone production (Klemmedson and Smith 1979, Touchan and others 1996). Fire suppression has resulted in greater survival of young trees, contributing to forest densities of >3,000 trees/ha in the 1990s compared to 60 trees/ha in 1876 (Mast and others 1999). Ecological restoration, using silvicultural tools such as thinning and prescribed burning, may help reestablish structure and function of indigenous ecosystems by recreating pre-settlement (ca. 1870) tree species composition and size class distribution and reestablishing a frequent, low intensity fire regime (Covington and others 1997). However, restoration treatments will affect the availability of dead wood to wildlife. Thinning and pruning may increase log and slash densities. Slash treatments that leave piles or windrows increase habitat for some vertebrates (e.g., small mammals, Goodwin and Hungerford 1979). Prescribed fire may increase or decrease the dead wood resource. Boucher and others (1999), Gaines and others (1958), and Gordon (1996) found that prescribed fire created dead wood; however, live trees killed by fire were predominantly small in diameter and therefore not effective replacements of large logs and snags. Prescribed fires will also incinerate existing snags and logs, removing up to 50 percent of ponderosa pine snags and 60 percent of logs (Gaines and others 1958, Gordon 1996, Horton and Mannan 1986, Randall-Parker and Miller 2002). In addition, Horton and Mannan (1988) found that large (>30 cm dbh) and more decayed ponderosa pine snags were more flammable, and therefore more likely to be lost. This loss of large dead wood may be particularly detrimental to wildlife, because cavity nesters (birds and bats) select larger snags (>46 cm diameter), large snags persist longer than small snags (Neitro and others 1985, Rabe and others 1998, Scott and Oldemeyer 1983), and replacement of large snags may take a long time (e.g., >200 years for a ponderosa pine to reach 46 cm dbh under normal stocking, site index 70 [Meyer 1961]). Large snags are often the origin of large logs, so fires may have both immediate and long-term impacts on both standing dead and down wood. If not incinerated, snags and logs may be altered by fire and their usefulness as wildlife habitat decreased (Gaines and others 1958, Gordon 1996). After a prescribed burn, Gordon (1996) suggested that the utility as habitat of >70 percent of logs in her study was decreased, because logs were charred and case-hardened, making them more difficult for animals to excavate. Most snags fell (50 percent, Gordon 1996), at which point they were considered useful as log habitat. Additional fires might further reduce available dead wood. What do we know specifically about use of dead wood in the Southwest? I found 41 articles (table 1) that described either dynamics of dead wood or use of dead wood as habitat for wildlife in the Southwest. The literature generally focused on ponderosa pine ecosystems (n = 32), although five papers described mixed conifer ecosystems and four papers described dead wood in both forest types. Snag dynamics or use was the most common topic discussed (n = 33). Of these, 11 papers described use of snags by primary or secondary cavity-nesting birds and 10 described other
680
USDA Forest Service Gen. Tech. Rep. PSW-GTR-181. 2002.
Dead Wood Resources and Small Mammals—Chambers
types of use by wildlife. The remaining 12 papers described snag recruitment and longevity, pre-settlement forest conditions in the Southwest, or effects of prescribed fire on dead wood. Fifteen papers discussed dynamics (n = 6) or wildlife use (n = 9) of logs. Of the 41 papers discussing dead wood in the Southwest, only 4 (Goodwin and Hungerford 1979, Kyle 2000, Smith and Mannan 1994, Ward and Block 1995) described small mammal use of down wood in ponderosa pine forests. I examined small mammal use of ponderosa pine stands in northern Arizona. My objective was to determine how the availability of standing and down wood and other habitat elements affected abundance of small mammals. The study was conducted in areas scheduled for forest restoration treatments (thinning, prescribed burning). From these data, I have speculated on how restoration may affect dead wood and impact small mammal communities. Following restoration treatments, stands will be resampled and pre- and post-treatment comparisons made. Table 1Dead wood (snags and logs) in the Southwest reference list. Author(s) Mixed conifer Vahle and Patton Conway and Martin Franzreb Franzreb and Ohmart Li and Martin Ponderosa pine Goodwin and Hungerford Smith and Mannan Ward and Block Smith Covington and Sackett Graham and others Balda and others Crocker-Bedford Cunningham and others Dwyer Hay and Guntert Horton and Mannan Keller Rabe and others Reynolds and others Scott Scott Szaro and Balda Brawn and Balda Ffolliot Mast and others Miller and Benedict Pearson Scott and Oldemeyer Wadsworth
Year
Snags
1983 1993 1978 1978 1991
X X X X
1979 1994 1995 1996 1984 1994 1983 1993 1980 2000 1983 1988 1992 1998 1992 1978 1979 1986 1988 1983 1999 1994 1937 1983 1943
X X X X X X X X X X X X X X X X X X X
USDA Forest Service Gen. Tech. Rep. PSW-GTR-181. 2002.
Logs
Wildlife
X
X X X X X
X X X X X X
X X X X X X X X X X X X X X X X X
681
Dead Wood Resources and Small Mammals—Chambers
(table 1 continued) Author(s) Block and Finch Germaine Kyle Covington and Moore Covington and others Gaines and others Gordon
Year 1997 1999 2000 1994 1997 1958 1996
Snags X X X X X X X
Mixed conifer and ponderosa pine Mollohan and others Balda Dahms and Geils Ganey
1989 1975 1997 1999
X X X
Logs X X X X X X X
Wildlife X X X
X
X X
Methods Study Area I live-trapped small mammals at Mt. Trumbull, in the Arizona Strip north of the Colorado River, in northern Arizona (latitude 36o 22’ 0”, longitude 113o 11’ 0”). The study area ranged from 2,055 to 2,277 m in elevation. Tree density averaged 1,642 trees per ha, with ponderosa pine dominating (ponderosa pine averaged 90 percent of stand basal area). Gambel oak, pinyon pine (Pinus edulis), Utah juniper (Juniperus osteosperma), and New Mexican locust (Robinia neomexicana) comprised the remaining 10 percent basal area. Log density averaged 6.4/ha, 51.0, 1.6, 107.6, respectively, for large (>50 cm diameter) and small (15 cm diameter) and small (80 percent) and checked daily. Traps were closed during the day to prevent capture of diurnal animals and reopened approximately 1 hour before dusk. Units 1, 2, and 3 were sampled July 11-15, 1998. Units 4 and 5 were sampled July 26-29, 1998. All animals were weighed, measured (total body length, lengths of tail, ear, and right hind foot), ear-tagged with a unique number, and released at the point of capture.
682
USDA Forest Service Gen. Tech. Rep. PSW-GTR-181. 2002.
Dead Wood Resources and Small Mammals—Chambers
I obtained vegetation and habitat data for each stand from the Northern Arizona University School of Forestry Ecological Restoration Institute. These data were collected June through August 1998 for a subset of trap stations (12 to 16 trap stations systematically distributed in each grid to equally sample throughout the trapping grid). Overstory data (tree density, basal area, canopy cover, snags, logs, stumps) were measured on a 0.04 ha plot and shrubs were measured on a 0.01 ha plot centered on each trap station location (table 2). Other understory habitat features (grasses, forbs, mosses, lichens) were measured by point intercept along a 50-m line transect (166 points per transect) and their frequency per trap station calculated (table 2).
Table 2Habitat variables used in developing habitat relationships models for small mammal species (deer mouse, pinyon mouse, brush mouse) at Mt. Trumbull, Arizona, June– August 1998. Variable Understory Lichen Litter Forb Grass Shrub Logs
Stumps
Overstory Basal area Live trees
Snags
Definition Percentage of lichen and moss cover Percentage of litter cover Percentage of forb cover Percentage of grass cover Percentage of woody plant (shrubs and trees 0.15 m long by species (ponderosa pine, Gambel oak, New Mexican locust, Utah juniper) and size class (for ponderosa pine: small 50 cm diameter; for Gambel oak, small 15 cm diameter; size classes were not created for New Mexican locust or Utah juniper) Number of stumps by species (ponderosa pine, Gambel oak, New Mexican locust, Utah juniper) and size class (for ponderosa pine: small 50 cm diameter; for Gambel oak, small 15 cm diameter; size classes were not created for New Mexican locust or Utah juniper) Basal area (m2/ha) for all live trees combined and for each tree species (ponderosa pine, Gambel oak, New Mexican locust, Utah juniper, pinyon pine) Number of live trees by species (ponderosa pine, Gambel oak, New Mexican locust, Utah juniper) and size class (for ponderosa pine: small 50 cm diameter; for Gambel oak, small 15 cm diameter; size classes were not created for New Mexican locust, or Utah juniper) and decay condition (1 = live tree, no sign of decay, 2 = live tree, declining, some evidence of decay (e.g., dead branches) Number of snags by species (ponderosa pine, Gambel oak, New Mexican locust, Utah juniper), size class (for ponderosa pine: small 50 cm diameter; for Gambel oak, small 15 cm diameter; size classes were not created for New Mexican locust, or Utah juniper), and decay condition (3 = recent snag, 4 = loose bark snag, 5 = snag without bark remaining, 6 = snag broken above 1.4 m)
USDA Forest Service Gen. Tech. Rep. PSW-GTR-181. 2002.
683
Dead Wood Resources and Small Mammals—Chambers
Live trees and snags or partial snags were classified into decay classes. Decay class 1 was a live tree with no evidence of dead branches. Decay class 2 was a live tree with dead branches (declining), decay class 3 was a recent snag, decay class 4 was a snag with loose bark, decay class 5 was a snag with no bark remaining.
Statistical Analyses Stand-Level Analyses I calculated capture rates per stand (number of animals per 100 trap nights [TN]) (table 3) for each Peromyscus species. I averaged overstory and understory variables for each stand. Habitat variables that were not normally distributed or with unequal variance were transformed by taking the square root of the variable or by using log10(variable + 1) (Sabin and Stafford 1990). I reduced the number of habitat variables for multiple linear regression to adjust for small sample sizes. For each mouse species, I developed models using subsets of 0.6, P < 0.05 for deer mouse, R > 0.5, P < 0.1 for brush mice, and R > 0.7, P < 0.03 for pinyon mice). I used stepwise linear regression analysis to identify habitat variables that, in combination, were associated with small mammal capture rates (Sokal and Rohlf 1981, SAS Institute Inc. 1985). I used Akaike’s Information Criterion (AIC) to select models with predictive power that used the fewest variables; low AIC values are associated with models that give the best fit of data. To select the best model, I compared AICd values (relative AIC value for each model, calculated by taking the difference between the model with lowest AIC value). If AICd values were < 4, models were assumed equally effective in predicting presence of the animal species and the most parsimonious model selected (Burnham and Anderson 1998:43-48).
Table 3Capture rates (number of animals per 100 trap nights [TN]) for deer mouse (Peromyscus maniculatus), brush mouse (P. boylii), and pinyon mouse (P. truei) at Mt. Trumbull, Arizona, July 1998. For stand, C represents the control unit (will not be thinned or burned) and T represents the treatment unit (untreated at the time of data collection). Stand 1C 1T 2C 2T 3C 3T 4C 4T 5C 5T
684
Deer Mouse 3.0 3.6 4.4 12.0 2.6 2.6 1.3 0.8 0.3 0.5
Capture Rate (number/100 TN) Brush Mouse Pinyon Mouse 4.8 0.0 5.8 0.6 0.0 0.4 1.0 0.0 0.0 0.0 0.2 1.2 0.0 4.8 0.5 5.0 0.0 3.8 0.8 2.8
USDA Forest Service Gen. Tech. Rep. PSW-GTR-181. 2002.
Dead Wood Resources and Small Mammals—Chambers
Trap Station Analyses I averaged values for each habitat variable by trap station and used these data to develop habitat association models. I used logistic regression as a means of selecting variables that separated trap stations used by small mammals from unused trap stations. I conducted separate analyses for each mouse species (deer mouse, brush mouse, pinyon mouse). I used the Hosmer and Lemeshow goodness-of-fit test to determine whether the distribution of probabilities produced by my model(s) fit the logistic probability distribution (SAS Institute, Inc. 1990).
Results I captured 270 individuals of 3 species during the trapping period: 135 deer mice (50 percent of captures), 74 pinyon mice (27 percent of captures), and 61 brush mice (23 percent of captures). Deer mice were more abundant in units 1, 2, and 3. Brush mice were most abundant in unit 1. Pinyon mice were most abundant in units 4 and 5 (table 3).
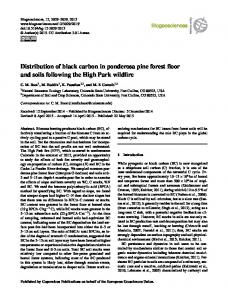
Stand-Level Analyses Models with two regressors were strongest predictors of deer mouse and pinyon mouse habitat use based on AICd values. For brush mouse, there was no difference between the 1- and 2-variable models based on AICd values (table 4). Large Gambel oak trees and small ponderosa pine snags explained 87 percent of the variation in deer mouse abundance (F = 24.3, df = 2, 9, P < 0.0007). Deer mice were positively correlated with large Gambel oaks (R = 0.64, P = 0.05) (fig. 1A) and negatively correlated with small ponderosa pine snags (R = -0.74, P = 0.01) (fig. 1B).
Table 4Stepwise linear regression models developed to explain differences in habitat use at the stand level by deer mice, brush mice, and pinyon mice, Mt. Trumbull, Arizona, 1998.1 Species Deer mouse
Habitat Variable >15 cm dbh Gambel oak trees 50 cm dia. ponderosa pine stumps Lichen and moss cover
0.37 0.23
0.37 0.61
13.5 10.9
2.6 0
Pinyon mouse
Juniper species basal area Ponderosa pine basal area
0.90 0.05
0.90 0.95
-6.1 -10.9
4.9 0
1
Akaike’s Information Criterion (AIC) was used to select models with predictive power using fewest variables; lowest AIC values are associated with models that give the best fit of data (best model is depicted in bold typeface, if not indicated in bold typeface, either model is equally acceptable). AICd is the relative AIC value for each model, calculated by taking the difference between the model with lowest AIC value.
USDA Forest Service Gen. Tech. Rep. PSW-GTR-181. 2002.
685
Dead Wood Resources and Small Mammals—Chambers
Basal area of juniper and ponderosa pine trees explained 95 percent of the variation in pinyon mouse abundance (F = 67.2, df = 2, 9, P = 0.0001) (table 4). Pinyon mice were positively correlated with juniper basal area (R = 0.85, P = 0.002) (fig. 1C) and ponderosa pine basal area (R = 0.71, P = 0.02) (fig. 1D). Large ponderosa pine stumps explained 37 percent of the variation in brush mouse abundance (F = 4.8, df = 1, 9, P = 0.06) (table 4). Brush mice abundance was negatively correlated with large ponderosa pine stump density (R = -0.61, P = 0.06) (fig. 1E). Lichen cover was not significantly correlated with brush mouse abundance (R = 0.15, P = 0.7), and it did little to explain more variation in mouse abundance (based on AICd values) when included in the multiple regression model (table 4) (F = 5.4, df = 2, 9, P = 0.04).
Trap Station Analyses Of 143 trap stations with vegetation data, I captured deer mice at 14 stations, pinyon mice at 12 stations, and brush mice at 6 stations. Combining all species, I captured mice at 29 of 143 trap stations. Trap stations with the highest probability of deer mice capture had higher forb cover, higher live tree basal area, and higher densities of small (