United Nations Educational, Scientific and Cultural Organization
International Hydrological Programme
Forest Management and the impact on water resources: a review of 13 countries
IHP - VIII / Technical document Nº 37 Latin America and the Caribbean
United Nations Educational, Scientific, and Cultural Organization International Hydrological Programme International Sediment Initiative
Forest management and the impact on water resources: a review of 13 countries
Editors Pablo A. Garcia-Chevesich, Daniel G. Neary, David F. Scott, Richard G. Benyon, Teresa Reyna.
Published in 2017 by the United Nations Educational, Scientific and Cultural Organization, 7, place de Fontenoy, 75352 Paris 07 SP, France and UNESCO Regional Office for Sciences for Latin America and the Caribbean – UNESCO Montevideo
© UNESCO 2017 ISBN 978-92-3-100216-8
This publication is available in Open Access under the Attribution-ShareAlike 3.0 IGO (CC-BY-SA 3.0 IGO) license (http://creativecommons.org/licenses/by-sa/3.0/igo/). By using the content of this publication, the users accept to be bound by the terms of use of the UNESCO Open Access Repository (http://www.unesco.org/ open-access/terms-use-ccbysa-en). The designations employed and the presentation of material throughout this publication do not imply the expression of any opinion whatsoever on the part of UNESCO concerning the legal status of any country, territory, city or area or of its authorities, or concerning the delimitation of its frontiers or boundaries. The ideas and opinions expressed in this publication are those of the authors; they are not necessarily those of UNESCO and do not commit the Organization.
Cover photo: CC0 License Graphic design: Leonardo Alvarez de Ron Cover design: María Noel Pereyra Typeset: Pablo García Chevesich Edition: Miguel Doria, Soledad Benítez, Joaquín Jafif and Tatiana Másmela
Table of Contents Acknowledgements .................................................................................................................. 6 Executive summary .................................................................................................................. 7 Chapter 1. Forest Management and Water in Argentina........................................................
11
1.1 Introduction ......................................................................................................................
11
1.2 Literature review...............................................................................................................
14
1.3 Politics..............................................................................................................................
18
1.4 Climate change and the future of forestry & forest research............................................
18
1.5 References.......................................................................................................................
19
Chapter 2. Forest Management and Water in Australia.........................................................
21
2.1 Introduction.......................................................................................................................
21
2.2 Literature review...............................................................................................................
25
2.3 Politics..............................................................................................................................
28
2.4 Climate change and the future of forestry & forest research............................................
29
2.5 References.......................................................................................................................
29
Chapter 3. Forest Management and Water in Brazil...............................................................
33
3.1 Introduction.......................................................................................................................
33
3.2 Literature review...............................................................................................................
36
3.3 Politics..............................................................................................................................
38
3.4 Climate change and the future of forestry & forest research............................................ 40 3.5 Acknowledgements........................................................................................................... 41 3.6 References....................................................................................................................... 41 Chapter 4. Forest Management and Water in Chile................................................................
45
4.1 Introduction....................................................................................................................... 45 4.2 Literature review............................................................................................................... 47 4.3 Politics..............................................................................................................................
51
4.4 Climate change and the future of forestry & forest research............................................ 51 4.5 Acknowledgements........................................................................................................... 52 4.6 References....................................................................................................................... 52
3
Chapter 5. Forest Management and Water in China..............................................................
55
5.1 Introduction......................................................................................................................
55
5.2 Literature review..............................................................................................................
56
5.3 Politics..............................................................................................................................
60
5.4 Climate change and the future of forestry & forest research...........................................
62
5.5 Acknowledgements..........................................................................................................
63
5.6 References.......................................................................................................................
63
Chapter 6. Forest Management and Water in the Democratic Republic of Congo.............
67
6.1 Introduction......................................................................................................................
67
6.2 Literature review..............................................................................................................
68
6.3 Politics..............................................................................................................................
74
6.4 Climate change and the future of forestry & forest research...........................................
75
6.5 References.......................................................................................................................
81
Chapter 7. Forest Management and Water in India................................................................
87
7.1 Introduction......................................................................................................................
87
7.2 Literature review..............................................................................................................
88
7.3 Politics..............................................................................................................................
97
7.4 Climate change and the future of forestry & forest research...........................................
98
7.5 Acknowledgements.......................................................................................................... 101 7.6 References....................................................................................................................... 101 Chapter 8. Forest Management and Water in Malaysia......................................................... 105 8.1 Introduction...................................................................................................................... 105 8.2 Literature review.............................................................................................................. 110 8.3 Politics.............................................................................................................................. 115 8.4 Climate change and the future of forestry & forest research........................................... 119 8.5 Acknowledgements.......................................................................................................... 124 8.6 References....................................................................................................................... 125 Chapter 9. Forest Management and Water in Peru................................................................ 129 9.1 Introduction...................................................................................................................... 129 9.2 Literature review.............................................................................................................. 136 9.3 Politics.............................................................................................................................. 138 9.4 Climate change and the future of forestry & forest research........................................... 140 9.5 Acknowledgements.......................................................................................................... 142 9.6 References....................................................................................................................... 142
4
Chapter 10. Forest Management and Water in Romania....................................................... 149 10.1 Introduction.................................................................................................................... 149 10.2 Literature review............................................................................................................ 153 10.3 Politics............................................................................................................................ 155 10.4 Climate change and the future of forestry & forest research......................................... 156 10.5 References..................................................................................................................... 157 Chapter 11. Forest Management and Water in the Republic of South Africa...................... 159 11.1 Introduction.................................................................................................................... 159 11.2 Literature review............................................................................................................. 162 11.3 Politics............................................................................................................................ 165 11.4 Climate change and the future of forestry & forest research.......................................... 165 11.5 References..................................................................................................................... 166 Chapter 12. Forest Management and Water in Spain............................................................. 169 12.1 Introduction.................................................................................................................... 169 12.2 Literature review............................................................................................................ 173 12.3 Politics............................................................................................................................ 175 12.4 Climate change and the future of forestry & forest research......................................... 176 12.5 Acknowledgements........................................................................................................ 178 12.6 References..................................................................................................................... 178 Chapter 13. Forest Management and Water in the United States......................................... 181 13.1 Introduction.................................................................................................................... 181 13.2 Literature review............................................................................................................ 186 13.3 Politics............................................................................................................................ 195 13.4 Climate change and the future of forestry & forest research......................................... 197 13.5 Acknowledgements........................................................................................................ 198 13.6 References..................................................................................................................... 198
5
Acknowledgements The editors deeply thank all the contributing authors that submitted a chapter representing their country, for all the time and effort invested.
6
Executive summary Trees have been around for more than 370 million years, and today there are about 80 thousand species of them, occupying 3.5 billion hectares worldwide, including 250 million ha of commercial plantations. While forests can provide tremendous environmental, social, and economic benefits to nations, they also affect the hydrologic cycle in different ways. As the demand for water grows and local precipitation patterns change due to global warming, plantation forestry has encountered an increasing number of water-related conflicts worldwide. This document provides a country-by-country summary of the current state of knowledge on the relationship between forest management and water resources. Based on available research publications, the Editor-in-Chief of this document contacted local scientists from countries where the impact of forest management on water resources is an issue, inviting them to submit a chapter. Authors were instructed to use the following structure:
1. Introduction Present a brief history of the country’s native forests and forest plantations, describing the past and current natural and plantation forest distribution (map, area, main species), as well as main products produced (timber, pulp, furniture, etc.). Characterize the country’s water resources and main water uses, discussing the key water resource issues. Finally, describe the forest & water issues that are relevant in the country.
2. Literature review Write a brief review of water-related forest management studies. Include methods (e.g. paired watershed studies, precipitation/runoff relationship, water balance, hydrological modelling, sap flow meters, etc.) and results. End with a section on best management practices utilized or recommended by the country to increase water yield and/or improve water quality.
3. Politics Discuss key environmental regulations, laws, and policies related to forestry and water, and evaluate how research results have interacted with politics and vice versa, i.e. the creation of new regulations, either enforced by the law, or simply applied by the private sector, to improve water yield and water quality. Also, discuss the role of forest certification systems in managing water quantity and quality.
4. Climate change and the future of forestry & forest research Evaluate the effects of climate change in the country, especially on water resources, describing how the area occupied by forest plantations is increasing or decreasing, and where. End this section proposing future research and management practices that should be incorporated in the management of forest plantations to improve water quality and water yield. An excellent group from 13 nations, representing almost half the World’s population, submitted chapters (Argentina, Australia, Brazil, Chile, China, Republic of Congo, India, Malaysia, Peru, 7
Romania, South Africa, Spain, and United States), making this document a relevant contribution to the current state of water and forestry-related issues, management, and policies worldwide. Differences in historical forest management, climate, vegetation types and socioeconomic conditions driving the use and management of forests mean that forest hydrology research results vary from nation to nation. This makes it difficult to generalise and extrapolate between countries and regions. What seems to be of greatest importance is the combination of watershed characteristics (size, slope and soils), current and prior land uses and local climates, especially the temporal distribution of annual precipitation and temperatures. In certain climates, for example parts of Australia, Brazil, Chile, China, India, South Africa, Spain and the USA, where natural grassland, shrublands or land previously cleared for agriculture is replaced with fast growing plantations, streamflows and groundwater recharge are often substantially reduced, potentially creating local conflicts between plantations and other water users. In South Africa and Australia, this has led to introduction of legislation to limit plantation developments in some areas. Conversely, reforestation of degraded agricultural land, especially where soils have been heavily compacted, can sometimes increase dry season streamflows by increasing infiltration rates and may also increase the soil’s water holding capacity as well as improving water quality. Consequently, flood mitigation is seen as an important role of forests in some countries. Whereas once forests were thought to bring rain, it is now well documented that at local scales of tens to tens of thousands of ha, replacement of shallow-rooted vegetation with forest usually reduces streamflow but may improve water quality. Permanent clearing of forest will increase streamflow in some regions, albeit often accompanied by reduced water quality. In the few parts of the world where fog drip is an important hydrologic input, forest clearing reduces water yield. At much larger scales, for example in the Amazon Basin in Brazil and Peru, extensive forests can cycle moisture between the land and the atmosphere so that large-scale clearing of natural forest may have detrimental effects on regional and national water cycles. In many countries, including Brazil, Chile, China, India, Malaysia, Peru, Romania, and Spain, deforestation and soil degradation have created water quality problems, which are now being addressed, or will need to be addressed through reforestation. In China, for example, extensive areas of highly erodible soils have been reforested. However there may be a trade-off between improved water quality through soil restoration and reduced water yield, unless rainfall occurs only during winter months, as is the Chilean case. Fire in forests can create concerns over water quality, and less commonly, water yield. In Australia, Spain and the USA, fire seasons are becoming longer and more extreme due in part to combinations of drier and warmer climate. Forest management to reduce fire risk and the associated detrimental effects of wildfire on water quality, is now an important consideration in these countries. Based on the information provided, the countries with the closest links between forest hydrology research and policy-making are Australia, Brazil, China, South Africa, and United States. However, in most of the reminding eight countries, research and political initiatives are rapidly advancing. Importantly, most countries have invested resources and research into climate change adaptations, including its effects on forests and water interactions. In many countries there is still a clear lack of connection between research results and effective forest management policies, a topic that urgently needs to be addressed. Generally speaking, conflicts between forests and water are increasing worldwide, and future research should focus on how to solve current and future conflicts, considering local climates. As agriculture, mining, and urbanization continue to grow, it is expected that the demands for water resources will increase, leading to more conflicts. However, demands for forest-related products will also increase. Furthermore, the establishment, conservation, and management of forests are tasks that most countries should focus on, in order to ensure healthy watersheds. In this sense, activities such as reforestation, afforestation, and land restoration represent a key factor for the future, since worldwide millions of hectares are deforested every year, with many of them becoming deserts. 8
Before concluding, it is worth mentioning gender mainstreaming, even though the topic has not been the focus of this work, when remarking the importance of strengthening forests’ as an effort to work towards poverty reduction, biodiversity conservation and sustainable development. Though gender analysis of forest management for water resources is country specific, generally countries have a clear differentiation between the roles of men to those of women, as typically men are in charge of harvesting and manufacturing wood products, whereas women focus more on fruit collection or similar less intense tasks. A study released by the International Union for Conservation of Nature (IUCN) in the International Year of Forests, 2011, concludes that men and women have different yet complementary knowledge, use and management of the forests. Therefore, in order to achieve sustainable use of forest and land resources, both women and men’s needs, knowledge and experience must be valued and considered. This work suggests that despite there has been progress in women´s access to education employment opportunities in development countries, there is still a marked disparity in forest education, employment and career perspectives in forestry. Results indicate that women have poor access to training programmes, official-decision making process as well as property rights of forests. On the other hand, women play an important role in forest resource management and conservation due to their close dependence on forest resources for subsistence (fuelwood, fodder, herbal medicine among others) and income. A greater focus by future research on the interaction between forest management, water management and gender issues can help to better understand their interconnection and to identify ways to strengthen the management of both resources while fostering gender equality.
9
Chapter 1.Chapter Forest Management and in Argentina 1. Forest Management and WaterWater in Argentina Teresa María Reyna1 1 (
[email protected]), Santiago Reyna11 (
[email protected]), and Teresa María Reyna (
[email protected]), Santiago Reyna (
[email protected]), 1 María (
[email protected]) and MaríaLábaque Lábaque1 (
[email protected]) 1
Facultad de Ciencias Exactas, Físicas y Naturales. Universidad Nacional de Córdoba. Argentina
1.1 Introduction
1.1 Introduction
Argentina is the Latin American country with most arid semi-arid and dry sub-humid area, covering Argentina is the Latin withofmost arid conditions, semi-arid and dry sub-humid area, soil, covering 75% of the country. Its American large size,country its variety climatic geomorphic processes, water 75% of the country. Its large size, its variety of climatic conditions, geomorphic processes, soil, water and vegetation resources determine a great deal of ecological diversity and production systems based resources determine a great define deal ofinecological andofproduction onand thevegetation use of natural resources. These features Argentina diversity large areas native and systems planted based on the use of natural resources. These features define in Argentina large areas of native and forests, such as subtropical forests, xeric forests and cold temperate forests. planted forests, such as subtropical forests, xeric forests and cold temperate forests.
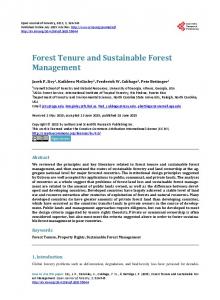
InInthis region, different environments of forests, shrubs and grass steppes, high deserts, wetlands, of forests, shrubs and grass steppes, high deserts, thisvast vast region, different environments which have been subjected to different productive uses according to the different stages of wetlands, which have been subjected to different productive uses according to the different stages of colonization the country underwent, are distinguished. Native forests in Argentina colonization that that the country underwent, are distinguished. Native forests in Argentina can becan be groupedinto intosix sixforest forestregions regionsasasshown shownininFigure Figure1.1. grouped
Figure 1. Forest regions of Argentina (source: Management Unit of Forest Assessment System (UMSEF) Head Office of Forestry, Figure 1. Forest regions of Argentina (source: Management Unit of Forest Assessment (UMSEF)Boliviana”: Head December 2002.). (“Parque Chaqueño”: Chaco Park Forest; “Selva Misionera”: Misiones Rainforest; System “Selva Tucumano Office of Forestry, December 2002.). (“Parque Chaqueño”: Chaco Park Forest; “Selva Misionera”: Misiones Tucuman-Bolivian Rainforest; “Bosque Andino Patagónico”: Andean Patagonian Forest; “Monte”: Monte Shurblands; “Espinal”: Rainforest; “Selva Tucumano Boliviana”: Tucuman-Bolivian Rainforest; “Bosque Andino Patagónico”: Andean Espinal Xeric Forest. (http://cyt-ar.com.ar/cyt-ar/index.php/Regiones_forestales_de_Argentina).
Patagonian Forest; “Monte”: Monte Shurblands; “Espinal”: Espinal Xeric Forest. (http://cyt-ar.com.ar/cyt-ar/ index.php/Regiones_forestales_de_Argentina).
7
1
Facultad de Ciencias Exactas, Físicas y Naturales. Universidad Nacional de Córdoba. Argentina
11
Forest management and the impact on water resources: a review of 13 countries
1) Chaco Forest: quebracho colorado santiagueño (Schinopsis lorentzii), quebracho blanco, algarrobo, vinal, itín, mistol, lapacho, palo blanco and palo lanza, yuchán, brea, duraznillo, palo santo, chañar, molle, urunday, guayacán, viraró, espina corona, palo piedra, palo amarillo (or ibirá-catú), tala, palmares. 2) Misiones Rainforest: Lapachos; laureles, guatambú blanco, palo rosa, cedro misionero, peteribí, yerba mate, marmelero, canafístola, timbó, guayubirá, urunday, cancharana, incienso, grapia, maría preta, rabo itá, rabo molle, azota caballo, aguaí, camboatá, carne de vaca, persiguero, el pino paraná (or araucaria), numerous mirtáceas, several bambúseas, as tacuarembó and tacuaruzú, palms as pindó. 3) Tucumán-Bolivian Rainforests (“Yungas”): tipuana tipu; the cebiles; pacará (called timbó in other regions); tarco (or rosewood); pink lapacho; biscote; picconia excelsa/palo blanco; terminalia australis/palo amarillo; White launches; (Guayaibí in other regions); laurels; horcomolle; (Or muddy stick); myrtle; cedars; Creole walnut; machine; cebiles; It pacará; Pine Hill; walnut. 4) Andean Patagonian Forest: populated mostly by conifers, Fagaceae, Myrtaceae and several species of Nothofagus such as pehuén; lipain, maitén, ñire, tepa, tepú, cypress Guaitecas, coihue, Coyan, lleuques, raulí, radal, lenga, Temu, the quetri or “myrtle” or the giant “patagonian larch” (lahuán) and huililahuán, copihue, notro and various evergreen shrubs such as cinnamon, blackberry, elderberry, strawberry, sarsaparilla etc. 5) Monte Shrublands: predominantly of jarillas (genus Larrea), pitch, pichana, retamo, tintitaco, and others that are typical jarillal. 6) Espinal Xeric Forest: «ñandubay» (Prosopis affinis), Prosopis alba and P. Nigra (black locust and black locust), Tala (Celtis tala), deciduous dry forests, shrubs and grass steppes;
«Caldén» (Prosopis caldenia).
Today, a high percentage of these lands have significant levels of degradation and deterioration of their physical and chemical properties, generating negative environmental impacts besides agricultural activity itself. In the early 20th century, natural forests covered a third of the Argentine territory; they were over one hundred million hectares (the areas of France and Spain together). Since then, the loss of native forest has been a constant process with pulses associated with favorable moments for agricultural expansion due to prices of agricultural products, technological changes or sociopolitical context (example of this were the years of the First World War, when Argentina was the leading producer of tannin extract). In 1980, a period of deforestation began, helped by demand for primary products of native forests with the modernization of livestock management, increased agricultural area, and consequently the expansion of the railway system, which in summary generated a significant reduction in forest area. The first estimate of the effective area of forest in Argentina corresponds to the National Agricultural Census of 1937. Since then, estimates show a marked decrease in forest area. The First National Native Forest Inventory was developed under the Native Forests and Protected Areas Project (IBRD Loan 4085-AR, 1998-2005). The first survey of the surface and distribution of native forests nationwide is from 1998 (UMSEF – Head Office of Forestry - SAyDS, 2002) (Table 1).
12
Chapter 1. Forest Management and Water in Argentina Table 1. Argentine Area of Native Forest between 1937 and 2011 (ha). Source: Year 1937: National Agricultural Census; 1987: estimates (IFONA) National Forestry Institute; 1998: First National Native Forest InventoryProject Native Forests and Protected-Secretariat of Environment and Sustainable Development Areas. Years 2002-2011: Management Unit of Forest Assessment System (UMSEF). Head Office of Forestry. Secretariat of Environment and Sustainable Development. Cabinet of Ministers. Year 1937
Year 1987
Year 1998
Year 2002
Year 2004
Year 2006
Year 2011
37,535,308
35,180,000
33,190,442
30,073,365
29,603,147
28,727,427
27,221,721
In recent decades, Argentina has been facing a process of transformation of its native forests of important dimensions, with the aggravating circumstance that forests are primarily replaced by soybean monocultures. This type of farming practice deteriorates the site so much that it can be assumed that conversion is permanent and if the lands were abandoned, the recovery of the original native forest would not be feasible. According to the data, some of the most affected forest regions correspond to Tucumán-Bolivian Forest and Chaco Forests. Table 2 presents deforestation data for some provinces within the period 1998- 2002, which show the continuing loss of native forest surface. Table 2. Deforested area (ha) by province and forest region during the period 1998-2002 (Source: UMSEF – Head Office of Forestry - SAyDS). Province
Deforestation Period 1998-2002 Chaco Forest Region
Tucumán-Bolivian forest region
Total
Córdoba
121,107
121,107
Chaco
117,974
117,974
Salta
152,800
Santiago del Estero
306,055
Tucumán
20,865
41,589
194,389 306,055
1,306
22,171
The province of Salta and Chaco are highly affected by indiscriminate logging and deforestation. In the region called Dry Chaco (Chaco Seco), 70% of native forests were eliminated to benefit agricultural production. Another region that is particularly threatened by logging companies is the Yungas rainforest, which also includes territories of the provinces of Salta, Jujuy and Tucuman, constituting one of the richest areas of biodiversity in the Americas. In 2013 Argentina was the nontropical country that suffered deforestation the most, as 34 ha/day were cleared. In addition to indiscriminate logging and general deforestation, we should mention forest fires as an important agent of reduction of native forests as, for example, in the province of Cordoba, where 139,000 ha were burnt in 2003 and 138,340 in 2013 and over a million and a half trees disappeared. We should also add that the native forests of Argentina have undergone severe degradation processes that favor biomass loss and result in impoverished forests, often compromising their ability to provide goods and services. There is clear evidence that the loss of biomass in tropical forests occurs at a higher rate than surface loss due to deforestation; however, as it is a less evident process, it does not get the attention it deserves. The magnitude of this process from the data from the First National Native Forest Inventory indicates, for example, for the region of Chaco forest that out of a total of 459 plots surveyed, only 7% kept its natural state while the remaining 93% showed signs of
13
Forest management and the impact on water resources: a review of 13 countries
human intervention due mainly to livestock, logging or agroforestry (Forest Policy: Native forests and environmental preservation. Observatory of Public Policy, November 2010, available online). Implanted forests in Argentina contain mostly fast-growing exotic species whose wood is suitable for industrial use (to a lesser degree for the production of oils, resins and tanning). Very few are implanted to be used with windbreak or fixation of sand dunes purposes. In 1998 the area of planted forests covered 780,396 ha, by the beginning of 2006, according to unofficial estimates, there were approximately 1,000,000 ha of planted forests. Afforestation has been focused mainly on the introduction of exotic species previously eliminating native forests and jungles, which alters the ecology and wildlife and dramatically reduces fauna and fertility of soils, thereby facilitating their water erosion. Among implanted non-native conifers, several species of pines, especially ponderosa pine, cypress, cedar, and in colder areas, firs and redwoods, stand out. In Argentina, exports of agricultural and forestry primary sector, together with agribusiness have traditionally been the main source of foreign exchange (35% GDP). The Argentina Republic has a land area of nearly 2.8 million km2, equivalent to 279 million hectares, approximately 30 million of which are covered with forests (i.e. 10% of the total) and 20 million intended for farms (7% of total), so one would expect that the forest resource would have economic importance. However, the primary forest sector has fluctuated in recent decades only between 0.1% and 0.3% in GDP, whereas the derived agro forestry does not normally exceed 2% of it. This is a striking situation since different technical estimates admit that in addition to existing surfaces covered with forests, there are about 20 million ha of ground that is suitable for commercial forestry cultivation and that does not compete with agricultural uses. And productivity of cultivated forests with exotic species is high, equaling or surpassing that of other countries with traditional forestry. In Argentina, the exploitation of forests involves a wide range of productive activities and services, from the harvest of seeds and the production of forest seedlings and other inputs, implantation and management of the forests, to the manufacture of finished parts, furniture, housing, cellulose pastes, cardboard and papers of different quality, wood panels, chemical extracts for the industry and a large set of byproducts, and even the manufacture of machines and equipment for these various activities and related marketing and transportation services. Overall, none of the subsectors of the forestry industry has achieved the necessary development to generate strong markets of suppliers of goods and services and significantly promoted the development of related activities.
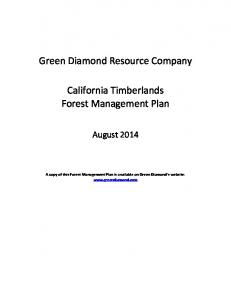
1.2 Literature review In Argentina, the supply of water resources can be expressed as a mean annual flow of about 26,000 m3/s. 85% of surface water in the country corresponds to the Argentine territories of the basin of Río de la Plata, with its rivers Paraguay, Uruguay and Parana, among its main water courses, and with the highest concentration of population and productive activity. On the other side are located the arid and semi-arid regions with low rainfall basins and less than 1% of the total surface water. In the country you can find eleven watersheds shown in Figure 2. The National Population, Households and Housing Census conducted in 2010 recorded a total of 40,117,096 inhabitants, so the annual average surface water supply per capita can be expressed as a rate of about 20,400 m3 / inhabitant / year, well above the threshold of water stress of 1,000 m3 / inhabitant / year. The distribution is very uneven, with about 90% of the population living in urban areas of over 10,000 inhabitants.
14
Chapter 1. Forest Management and Water in Argentina
Figure 2. Watersheds of Argentina (Source:https://www.educ.ar/recursos/14649/los-biomas-y-la-hidrografia-en-elFigure 2. Watersheds of Argentina territorio-argentino) (Source:https://www.educ.ar/recursos/14649/los-biomas-y-la-hidrografia-en-el-territorio-argentino)
Use of water resources • Extractive uses: Drinkable water and water for sanitation and irrigation stand out among other consumptive of water. Irrigation demands 70% of the total, followed by30% the municipal supply, With regard uses to groundwater, the latest available studies recorded that of the water used corresponds to thisand source. Major exploitable aquifers have been surveyed in the country, with high livestock watering, industrial use. level of knowledge in some cases, as in the provinces of San Juan and Mendoza, which heavily
depend on them. Recently, Argentina, Brazil, andpublic Uruguay, the The country has 125 irrigation systems together or areas, with taking into Paraguay account both and implemented private “Project for Environmental Protection and Sustainable Development of the Guarani Aquifer System” complementary and comprehensive irrigation. It is considered that the potential of land suitable for located inisgeological formations that are found only at different depths in abevast region the Basin of Río irrigation about 6,300,000 hectares, of which 2.5 million may feasible forofcomprehensive de la Plata, considered one the most important freshwater of the world. irrigation. Total irrigatedas area is of about 1.5 million hectares, while reserves the area with irrigation infrastructure available (including in it to thethe registered one) covers about 1.75 million hectares. While threat sustainability of groundwater and surface water sources In Argentina there is a growing due to human alteration of land use in the tributary basin. Non-conservationist farming practices, deforestation, agrochemical use and changes in land use, particularly urbanization, disturb the water balance and quality conditions of the sources. 12
15
Forest management and the impact on water resources: a review of 13 countries
Examples of these phenomena are: • The increase in the amount of suspended solids resulting from more water erosion due to deforestation, overgrazing and mismanagement of arable land, as verified in Lakes Los Molinos and San Roque in Cordoba; in the province of Misiones, in some areas of the Bermejo River Basin and other areas of the country. • The presence of pesticides in surface courses, as has been detected in waters of the Uruguay River and the Río Negro. • The contamination of surface reservoirs as the Embalse de Rio Hondo, in Santiago del Estero, or Lakes Los Molinos and San Roque in Cordoba, due to untreated wastewater from coastal urban and industrial settlements or settlements located in the tributary basin. • The contamination of aquifers due to disposal of sewage in septic tanks, as the case of “Puelche” in the province of Buenos Aires, or intensive industrial urban development, as in the industrial city belt bordering the Parana and Río de la Plata from Rosario to La Plata, where its tributaries in very serious state of contamination, such as the Matanza-Riachuelo and Reconquista, in the suburbs of Buenos Aires, are the most eloquent expression. Serious shortcomings in the management and disposal of urban and industrial toxic solid waste, particularly in urban peripheries, contribute to this situation.
Use of water resources • Extractive uses: Drinkable water and water for sanitation and irrigation stand out among other consumptive uses of water. Irrigation demands 70% of the total, followed by the municipal supply, livestock watering, and industrial use. The country has 125 irrigation systems or areas, taking into account both public and private complementary and comprehensive irrigation. It is considered that the potential of land suitable for irrigation is about 6,300,000 hectares, of which only 2.5 million may be feasible for comprehensive irrigation. Total irrigated area is about 1.5 million hectares, while the area with irrigation infrastructure available (including in it the registered one) covers about 1.75 million hectares. While this would indicate that there is great potential for expansion, in many cases large investment is still needed to deliver the water to the areas to be incorporated. • Non-extractive uses: The need to increase the availability of water resources by regulating their seasonal variability, to mitigate floods and generate electricity, boosted the construction of reservoirs and multipurpose dams since the beginning of the 20th century. Initially, the State’s efforts were focused on arid and semi-arid areas, accompanying the development of irrigated areas and, subsequently, massive power generation through great binational works in rivers Parana and Uruguay. To date, the country has built important regulation capacity with more than 100 large dams in operation and dedicated mostly to multiple uses (power generation, municipal and industrial supply, irrigation, flood mitigation, navigation and recreation). The largest hydropower potential is associated with the basins of the Plata (rivers Bermejo, Paraná and Uruguay) and with the ones that flow into the Atlantic (rivers Colorado, Negro, Chubut and Santa Cruz).
16
Chapter 1. Forest Management and Water in Argentina
Fire Impacts to Quality of Reservoirs San Roque and Los Molinos. The following describes the situation in two reservoirs after the disappearance of native forests due to fires and deforestation. Córdoba along with its hinterland is one of the most important cities in Argentina with a population of more than 1,400,000 inhabitants in 2010. In this city, water is supplied by the San Roque and Los Molinos reservoirs. The region is subject to strong variations in its hydrological cycles. Besides, a steady population growth experienced in recent years in the city and its hinterland has derived in conflicts for the water supply, which were protracted by droughts, floods and changes in the land use. Additionally, periodic fires in the basin seriously deteriorated both reservoirs. A study performs to the assessment of impairment suffered annually by both lakes due to fires occurring in the Sierras de Cordoba was conducted. This study attempted to determine the increased siltation in reservoirs that supply water to the city as a result of fires. The model used to calculate the specified degradation in the basin is the Djorovic & Gavrilovic (1974). Results showed a significant decrease in the time needed to reach a full siltation of the reservoirs due to fires in the upper basin. As a result of the natural watershed degradation, erosion and sediment deposition occur in vast land areas and mainly in the riverbeds. The obstacle of dams for sediment discharge in rivers draining upstream thereof, causes accumulation of sediment and widespread erosion in the downstream reaches. Table 3 shows the embankment of reservoirs San Roque and Los Molinos considering the effects of fire on watersheds and when different levels are reached. Along with the solid materials degradation product of the basin, the rivers are loaded with nutrients directly related to the chemical characteristics of soils involved. Agricultural activities not regulated, overgrazing and fires, among other actions that depend on man, especially in the basin headwaters increase rates of sediment generation directly affecting the net volume of reservoirs and their water quality. To reduce these effects, implementing land use practices in the watershed, controlling deforestation actions, and preventing and controlling unwanted fires is required. Table 3: Summary of the values of reservoir embankment in San Roque and Los Molinos in both situations. Reservoir
Construction
Embankment
Original Reservoir Volume
2011 (%)
50% (year) 75% (year)
100% (year)
Without considering the effect of fires SAN ROQUE
1944
201
22%
2094
2169
2244
LOS MOLINOS
1953
307
9%
2281
2445
2609
Considering the effect of fires SAN ROQUE
1944
201
29%
2061
2119
2178
LOS MOLINOS
1953
307
11%
2213
2343
2473
Regarding the storage capacity of reservoirs and for a proper planning of water resources, in what refers to the ability of regulation of the dam, conducting bathymetries that will generate some basis for required monitoring and control is needed. Highlands use should be regulated by setting maximum cattle stocks in terms of heads per hectare leading to a rational use and avoiding overgrazing.
17
Forest management and the impact on water resources: a review of 13 countries
1.3 Politics The National Constitution of Argentina (1994), Article 41, states that “The Nation promulgates rules containing the minimum protection, and the provinces those necessary to reinforce them, without altering local jurisdictions “. On this basis, it approved and promulgated the General Environment Act 25,675 (2002) and later Act 26,331 (2007) of minimum standards for the environmental protection of native forests. This law states the minimum principles of environmental protection of native forests and the environmental services they provide to society, and includes the contribution of public funds for environmental services provided by native forests. The standard promotes the enrichment, restoration, conservation, sustainable use and management of native forests in Argentina. In the different districts that have native forests, the need to adapt the legislation for sustainable use, based on what is stated in this standard, is determined. In this context, the Sustainable Forest Management Plan (SMP) is one of the fundamental tools for management. According to the standard, this instrument is defined as “The document summarizing the organization, means and resources, in time and space, of the sustainable use of forest resources, timber and non-timber, in a native forest or group of native forests, for which a detailed description of forest lands in their ecological, legal, social and economic aspects should be included, and in particular, a forest inventory with a first level of detail as to allow decision-making regarding forestry to apply in each of the units of native forest and its estimated profitability “(Balducci et al, 2012).
1.4 Climate change and the future of forestry & forest research Climate trends that have occurred in most of the Argentine territory in the last three or four decades are remarkable. And they are likely related to global climate change. These trends have affected natural systems and human activities, requiring rapid adaptation. The most important are: • Increase of annual average rainfall in parts of the country, especially in the northeast and western area peripheral to the traditional wet region. • Increase of frequency of extreme precipitation in much of eastern and central Argentina. • Increase of temperature in the mountainous area of Patagonia and Cuyo, with general retreat of glaciers. • Increase of river flows and frequency of floods across the country, except in the Comahue and northern Patagonia.
Furthermore, according to the Second National Communication of Argentina to the UN Framework Convention on Climate Change, October 2007 (op.cit. 4), there has been a decline in the flow of rivers originating in the Andes in San Juan, Mendoza and Comahue. However, the Andean Regional Center of INA (INA-CRA) argues that the decrease in river flow is not verifiable by identifying trend studies, conducted in the main rivers of the province (Pochat, 2012)
Commentaries Argentina has been through a very intense deforestation process, still occurring, driven mainly by crave to free land for agriculture (particularly for the production of grains, mainly soybean). This process has almost deprived entire provinces of its original forests (case of Córdoba, where only remnants can be seen).
18
Chapter 1. Forest Management and Water in Argentina
Deforestation and the new land practices have had very strong impacts on water resources, both in their quantity and quality. Deforestation and, later, agriculture transform totally the environment, introducing afterwards the use of agrochemicals that have important impacts on water quality (both surface and subsurface). There is a strong need to know better these impacts and how they can be diminished. To reduce siltation effects in reservoirs, implementing land use practices in the watershed, controlling deforestation actions and preventing and controlling unwanted fires is required. Highlands use for grazing should be regulated by setting maximum cattle stocks in terms of heads per hectare leading to a rational use and avoiding overgrazing in order to keep the watersheds health. Prevention of fires (and control, once they occurred) is a debt that Argentina has to its forests. Recent fire cases that have been in the global media show the need to take this aspect more seriously. Protected Natural Areas will be an important contribution to regional sustainable development, providing the whole society with environmental services and goods in perpetuity, with real and direct benefits to local communities. Historical experience shows that - abandoned to market rules and to economic actors’ various degrees of “green” consciousness -, natural and cultural resources are under constant and progressive deterioration, which directly or indirectly becomes detrimental to the population (Rodríguez del Pozo, 2003). It should be understood that the fight against desertification and the fight against poverty are two variants of the same objective, which encourages sustainable management of natural resources in order to promote rural development and thereby improve living conditions of dryland inhabitants.
1.5 References Balducci, Ezequiel Diego; Eliano, Pablo; Iza, Hugo Rubén; Sosa, Ignacio Alberto. 2012. Bases Para el Manejo Sostenible de los Bosques Nativos de Jujuy. 1a ed. Incotedes, ISBN 978-987-28804-0-8. Djorovic M, and Gravilovic (1974). Quantitative classification of torrent waterways. Institute for Forestry and Wood Industry (referido en MOPU 1985). Bosques Andinos (2011) Infografías. Bosques Andinos. Programa de Schweizerische Eidgenossenschaft, Confederarion Suize, Confederation Svizzera, Confederation svizra. FAO – LADA (2011) Publicación sobre la degradación de la tierra en Argentina para decisores políticos. La Lucha contra la Desertificación en Argentina: Degradación de la Tierra en Zonas Áridas e Identificación de Prácticas de Manejo Sustentable de Tierras www.fao.org/nr/lada/index.php?option=com_docman. LADA (2008) Proyecto Evaluación de la Degradación de Tierras en Zonas Áridas. Informe final de la Ejecución de las Cartas Acuerdo Nº 1 Escala local. Disponible en www.fao.org/nr/lada. Pochat, Victor. 2012. Recursos Hídricos - Julio de 2012 - Víctor Pochat. Ministerio de Ciencia, Tecnología e innovación productiva. Reyna, S.; Reyna, T.; Lábaque, M. (2014). “Fire Impacts to Quality of Reservoirs San Roque and Los Molinos” Pinnacle Environmental & Earth Science, Vol. 1 (2) 2014, Article ID pees_146, 315-321, 2014. Rodríguez del Pozo (2003). Proyecto: Bosques Nativos y Áreas Protegidas. BIRF - Préstamo 4085-AR. UMSEF - Dirección de Bosques – SayDS. 2002. Cartografía y Superficie de Bosque Nativo de Argentina al año 1998. Publicado en diciembre de 2002.
19
Chapter 2. Forest Management and Water in Australia Richard G. Benyon2 (
[email protected])
2.1 Introduction Australia’s Forests • Total land area of 769 million ha; 125 million ha of native forest; fire prone forests dominated by Eucalyptus and Acacia. • 1 million ha of Eucalyptus plantations, mainly for pulpwood; 1 million ha of Pinus plantation for pulp, sawn timber, veneer and composite wood products.
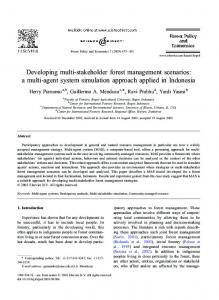
Australia is the driest inhabited continent with unique forest vegetation dominated by Eucalyptus and Acacia. It is also an old continent with soils often high in salts but leached of essential minerals, especially phosphorus. Low rainfall, low nutrient, sometimes saline soils and unique vegetation have had strong influences on forest hydrology in Australia. Substantial areas of Australia’s native vegetation, including forests and woodlands, have been cleared for agriculture since Europeans arrived in the late 18th and 19th century. About 22% of all Australia’s woody native vegetation has been cleared since 1750, including about 30% of Australia’s native eucalypt forests (Beeton et al. 2006). Clearing of native vegetation is now restricted or banned in most states. Australia now has 125 Mha of forest (16% of the total land area), of which most is natural forest and only 2 Mha is industrial plantation. Figure 1 shows the distribution of the main forest types within Australia. The 15 plantation regions indicated in Figure 2 are areas considered to be most suitable for plantations and where the vast majority of Australia’s 2 Mha of plantations are grown. Only about 0.2% of Australia’s land area has forestry plantations. This may increase over coming decades as tree planting is used to sequester carbon to offset greenhouse gas emissions. The Australian aborigines were the 1st to manage Australia’s forests, primarily by using cool fires to create open grassy understory. Anecdotal evidence suggests that when Europeans arrived some 200 years ago at least some parts of the landscape had a park-like appearance. For example it was often noted that horses could be ridden through forests and that they largely had a grassy understory (Watson 2014). The arrival of Europeans in the early eighteen hundreds quickly resulted in large-scale decimation of aboriginal population and with that ended their management. Largescale clearing of forests began for agriculture. Many millions of hectares of forest and woodland were cleared. For a detailed anecdotal account of the transition of the landscape during Australia’s early history of European settlement see Watson (2014).
2
Department of Ecosystem and Forest Science, the University of Melbourne
21
Forest management and the impact on water resources: a review of 13 countries
Figure Figure1.1.Distribution DistributionofofAustralia’s Australia’sforests. forests. Figure 1. Distribution of Australia’s forests.
Figure 2. Australia’s plantation growing regions. Source Parsons et al. 2006.
Figure2.2.Australia’s Australia’splantation plantationgrowing growingregions. regions. Source Source Parsons Figure Parsonsetetal.al.2006. 2006.
1818 22
Chapter 2. Forest Management and Water in Australia
Australia’s Government Following the arrival of British settlers after 1788, until 1900, Australia was a group of six independent British colonies, each with its own colonial government. At Federation in 1901 these colonies were united to form the Commonwealth of Australia with the establishment of the Australian Parliament. Australia now has a three tier system of government: an overarching federal government, eight separate state and territory governments and numerous local governments. Forest policy and Management is largely the responsibility of the states. However, the federal government sets overall policy directions and maintains national statistics on forests and forestry.
Australian forest ownership and management • Europeans settlers in the 19thC cleared large areas for agriculture and exploited some forests; in the 20th C state government forest services introduced sustainable native forest harvesting and multiple-use; much forest is now privately owned, the rest is mostly in parks, reserves and multiple use public forests. • National forests polices have encouraged development of industrial plantations to replace imported wood products, with a target of 3 Mha by 2020 (unlikely to be achieved: currently 2 Mha); plantations were largely publically developed before the 1980s, but now much is in private ownership. • Various codes of practice for native and plantation forest harvesting in most states aim to protect environmental values including surface water quality and yield.
During the 2nd half of the 19th century and early 20th century, the states established their own forest services to manage forests on public lands. Australia has a system of private and public land ownership. Most of the agricultural and urban land is privately owned but large areas of forest remain public land in national parks, state forests and other reserves. State forest and national parks services are responsible for managing these publicly owned forests. The cessation of aboriginal management of the land resulted in a change to fire regimes in some parts of the country. In south-western, southern and eastern Australia removal of regular cool burns resulted in thickening of the forest understory and possibly increasing the frequency or extent of occasional very large wildfires that occur under unusually hot dry windy conditions. The first of these ‘mega-fires’ occurred in Victoria in 1851 when much of the state burnt. Very severe fires have reoccurred every 20 to 50 years since then. Reduction of fire risk or mitigation of fire effects is often an important part of forest management. For example, after severe fires in 2009 killed 179 people and destroyed over 2000 buildings, a royal commission recommended a substantial increase in the amount of fuel reduction burning undertaken in Victoria’s forests, increasing almost fivefold the area of planned fuel reduction burning undertaken each year. Setting up of state forest services in the 19th century and early 20th century resulted in a move away from simple forest exploitation to sustainable forest management. Plans to sustainably utilize and regenerate forest for timber production were introduced over decades as an understanding of the ecology of the native forests was developed through research and as methods for drying and sawing the dense timber from eucalypts were devised. Multiple use management of state forests now aims to sustainably harvest timber while maintaining environmental and other socioeconomic values. One of the main concerns has been protection of soils from erosion and protection of streams from siltation and deterioration in water quality. Much of the research in Australian native forests since the 1970s has focused on how to mitigate or minimise the impacts of forest harvesting and forest fires on stream water quality. A large body of research examines how wildfires, forest roads and forest harvesting affect sediment run-off from 23
Forest management and the impact on water resources: a review of 13 countries
forest soils and on stream water physical and chemical properties. This has resulted in development of prescriptions for forest management in various areas as part of ‘codes of forest practice’. These codes are administered and enforced by state forest services or departments of primary industries, environment or environmental protection agencies: forest harvesting plans are developed; exclusion zones are identified that will protect streams from disturbance; harvesting coupe size and road locations are prescribed to minimise risks to water quality; site rehabilitation is mandated to further minimise erosion and deterioration of water quality. More recently, impacts of large-scale wildfires and of planned fuel reduction burns on water quality have been the subject of some research. As well as obtaining forest products from native forests, Australia since the late 19th century has sought to replace imported softwood timbers with locally grown plantation wood. The early 20th century saw the establishment of various arboreta designed to identify exotic species, particularly conifers, that would grow well and produce good quality timbers in Australia. In southern Australia Pinus radiata was identified as being a fast-growing versatile timber species and, largely since the nineteen sixties, almost 1 Mha of plantations of this species has been established in southern Australia. In drier parts of southern Australia particularly south-west Western Australia, P. pinaster is also grown in plantations for timber. In south-eastern and eastern Queensland about 200,000 ha of three species of tropical pines and their hybrids have been planted. Some native pines are also grown in plantations in Queensland. Until the early 1990s there was very little planting of Eucalyptus in Australia for timber with most hardwood timber being harvested from native eucalypt forests. However with large Japanese pulp mills looking for new sources of high-quality pulping wood and with government policies aimed at trebling Australia’s plantation area from 1 Mha to 3 Mha between 1995 and 2020, large areas of Eucalyptus particularly E. globulus and E. nitens were established between the early 1990s and the global financial crisis in 2008.
Australia’s water resources Water in Australia is mainly used for irrigated agriculture, for some industrial processes and for urban water supplies; Scarcity of water supplies often leads to competition between water uses including the water needs of natural ecosystem. The majority of Australia’s fresh water resources are located in the tropical north. However, remoteness and generally poor conditions for agriculture mean these water resources are largely unexploited. Most of the population is concentrated along the east and southern coasts where major rivers have been dammed to create large water storage reservoirs to supply Australia’s main urban areas. Large engineering schemes in the decades after World War 2 diverted rivers inland to provide large stores of water for irrigated agriculture, mainly in inland New South Wales, Victoria, South Australia and Queensland. Some regional and local groundwater systems are also used extensively for irrigation.
Current forest water issues include: • Protection of water quality with increasing wildfire and planned fuel reduction burning • Protection of water yield after timber harvesting and wildfire in some native forests • Managing water yield reductions after conversion of agricultural land to forestry plantations in a few regions with high concentrations of new industrial plantations
24
Chapter 2. Forest Management and Water in Australia
2.2 Literature review • Paired catchment studies, established from the 1960s to the 1980s, have examined the effects of forest clear fell and regeneration, forest thinning, wildfires and mining and forest regeneration on catchment water quality and yield in native eucalypt forests. • Several paired catchment studies have examined the effects of replacement of native forest or pasture with pine plantation. • Various plot-scale studies have directly measured water use by native forests or plantations to determine the drivers of water use and how water use is affected by forest management. • Runoff plots, sometimes using rainfall simulators, have examined effects of roads, disturbance and rainfall intensity on water quality. • Modelling and plot-scale studies have examined use of tree planting to combat dryland and irrigation salinity and the sustainability of land-based effluent reuse. • Analysis of long-term catchment land use, rainfall and streamflow data have determined trends in water yield and in some cases salinity, in the decades following tree planting on previously cleared land from which generalised rainfall-runoff equations for forest and nonforest land have been derived. • A recent book by Bren (2015) provides a detailed Australian perspective on forest hydrology and catchment management, with specific examples.
The impetus to established forest hydrology research programs in Australia has often been political or based on a desire by governments to develop science-based policy and management solutions to specific socio-economic and environmental issues. From the 1940s to the 1970s, large wildfires and public debates over forest clearing, timber harvesting or mining in native forests, particularly where these were water sources for large towns or cities, prompted establishment of catchment hydrology research programs in Victoria, New South Wales and Western Australia, based mainly on paired research catchments to which various harvesting or other management treatments were applied (Vertessy et al. 1998, Watson et al. 1999, Lane and Mackay 2001, Bari and Ruprecht 2003, Bren and Hopmans 2007, Webb et al. 2012). At that time, state governments, who are largely responsible for managing publicly owned forest and water resources, were willing to fund large, long-term, in-house research programs to obtain the best science on which to base natural resources management decisions. More recently, such research has been outsourced to universities and Australia’s national research agency (the CSIRO), often with a shorter-term focus on development or application of generalised models or study of hydrological processes at the plot-scale.
Water quality from forests Australian research on forest water quality has included both native forests and plantations. Wild fires, clear-fell timber harvesting and construction of roads for forest operations can have impacts on water quality (Cornish and Binns 1987, Hopmans et al. 1987, Croke et al. 1999, Wilson 1999, Townsend and Douglas 2000, Lane et al. 2006, Hopmans and Bren 2007, Sheridan et al. 2007, Lane et al. 2008, Smith et al. 2010, Smith et al. 2011). If not well managed, these can result in deterioration in water quality, risking drinking water supplies and water dependent ecosystems. Paired catchment studies (see Section 2.2) have often included regular manual sampling of water from base-flow and automatic samplers design to collect frequent water samples during and after storm events. Water quality parameters studied include: sediment concentrations and total sediment loads, total dissolved salts, turbidity, and concentrations of mineral elements such as N, P, Na and
25
Forest management and the impact on water resources: a review of 13 countries
Cl. Various biological water quality parameters have also been measured, particularly in catchments supplying potable water to urban communities. Findings of some of this research, particularly on how to mitigate effects of wildfires, timber harvesting and road construction, have been incorporated into state government codes of forest management practice (see Section 2.4). Research during the 1980s and 1990s examined the beneficial effects of tree planting for controlling dryland and irrigation salinity (Stirzaker et al. 2002, Polglase et al. 2002) and for sustainable landbased disposal of sewage and other effluents (Myers et al. 1999). Australia’s generally old soils and dry climate have resulted in gradual accumulation of salts from rainfall over millennia, mainly in regions where mean annual potential evapotranspiration exceeds mean annual rainfall, so that small concentrations of salt in rainfall are not fully leached from the soil profile and salt gradually accumulates over time. Under much of the original deep rooted native vegetation, groundwater recharge was small and salts were distributed throughout the soil profile. Clearing of vegetation for dryland agriculture, or irrigation of agricultural land in semi-arid regions, has increased groundwater recharge in many areas, causing water tables to rise, which concentrates salts near or on the soil surface. A dry climate and soils low in nutrients, particularly P, make some soils suitable for landbased effluent reuse.
Water yield from natural Eucalyptus forests Research on water yield from Australia’s native forests has been strongly influenced by large wildfires in Victoria in 1939. Substantial streamflow declines in the three decades following these fires in the forests supplying water to Australia’s 2nd-largest city, Melbourne (Langford, 1976) led to establishment of the first and most comprehensive long-term catchment hydrology research program in Australia. These moist Eucalyptus regnans and E. delegatensis (ash-type) forests grow in high rainfall (MAP 1200-2800 mm year-1) mountainous regions in southern and eastern Victoria and Tasmania, usually on deep, fertile, well drained soils. Conversion from relatively old, senescing forests (150-300 years old) to dense regrowth of the same species, caused by wildfire or clearcutting, results in declines in water yield of up to 50% over the next 20 to 30 years (Langford 1976, Kuczera 1985, Watson et al. 1999, Watson et al. 2001, Bren et al. 2010), due mainly to changes in transpiration (Dunn and Connor 1993, Vertessy et al. 2001, Buckley et al. 2012) and interception (Haydon et al. 1996). Kuczera (1985, 1987) characterised the regional forest age vs yield curve (commonly referred to as the Kuczera curve) for forests in Melbourne’s water supply catchments. Much subsequent debate and forest hydrology research in these and other eucalypt forests has focussed on whether this response to disturbance is typical of native eucalypt forests. Roberts et al. (2001) observed reductions in stand sapwood area and transpiration with forest age in E. sieberi forest regenerated from seedlings after fire or timber harvesting, suggesting there may also be an age related change in water yield from other eucalypt forests that regenerate primarily from seedlings after complete removal of the eucalypt overstorey. A long-term study in eight paired research catchments at Karuah, New South Wales, initially indicated a long-term response of streamflow to forest age in high rainfall (MAP 1400-1700 mm year-1), warmer moist Eucalyptus forests, possibly similar in magnitude to that observed in Victoria’s ash-type eucalypt forests (Cornish 1993, Cornish and Vertessy 2001). However, after analysing a longer period of post-treatment streamflow records from the Karuah catchments, Webb et al. (2012) concluded that while an ash-type water yield response can occur in other forest types, “…it appears to be the exception rather than the rule”. Less dramatic disturbances such as selective thinning, patch cutting and regeneration or strip thinning in 40 to 50 year old regrowth forest resulted in water yield increases of ~20%, persisting for 10 to 20 years (Jayasuriya et al. 1993, Watson et al. 2001, Hawthorn et al. 2013). After analysing up to 45 years of rainfall, streamflow and forest inventory data from the Victorian paired research catchments, Benyon et al. (2015) concluded that overstorey sapwood area, estimated from stocking density and basal area, has the strongest correlation with annual evapotranspiration (ET) and streamflow from 26
Chapter 2. Forest Management and Water in Australia
these forests, explaining almost 90% of the variation in mean annual ET. Jaskierniak et al. (2015) developed and tested methods to map spatial variation in stocking density and basal area using LiDAR. These can be used to map forest water use to identify low and high water yielding areas within large catchments. In drier (MAP 900 – 1400 mm year-1), more fire tolerant mixed eucalypt forests that cover large areas of south-eastern Australia, a smaller number of paired catchment studies and plot scale measurements of ET indicate water yield responses to fire or selective logging are less dramatic than in the ash-type eucalypts (Lane and Mackay 2001, Gharun et al. 2013, Nolan et al. 2014, Nolan et al. 2015). Wildfire in these forests usually kills only a small proportion of the overstorey, while most trees recover by sprouting from epic buds under the bark. After an initial reduction, ET either recovers to the pre-fire state or marginally exceeds this for at least a few years. In most cases forest water use will return to pre-fire levels within 8 to 12 years but if large areas of the catchment burn at only moderate severity, enabling both quick recovery of the overstorey and development of dense patches of seedlings, a more persistent, although relatively small increase in ET above pre-fire level may occur (Nolan et al. 2015). Paired catchment studies of the effects of native eucalypt forest harvesting and management and on effects of deforestation on water yield have been undertaken in Western Australia since the 1970s. In total, 27 experimental catchments in five catchment groups with mean rainfall ranging from 600 to 1200 mm year-1 in south-west Western Australia have examined effects on water yield of native forest harvesting and regeneration, forest thinning, bauxite mining and reforestation and clearing for agriculture (Schofield 2003). Permanent clearing of forests for pasture increased streamflows by ~200-300 mm year-1, which has often been associated with development of dryland salinity. Clearing of native forest for bauxite mining, followed by forest regeneration, increased water yields by 8% initially before a slow recovery to pre-mining levels after 12 years. Forest thinning in higher rainfall areas increases water yield by ~100-200 mm year-1, returning to pre-thinning levels in 12-15 years Bari and Ruprecht 2003).
Water yield from planted forests Only a few paired catchment studies in Australia have examined effects on water yield of conversion between native forest, plantations and pasture (Ruprecht and Schofield 1989, Bari and Ruprecht 2003, Bren et al. 2006, Bren and Hopmans 2007). More of the recent research in Australia on plantation water use has focused on analysis of long-term rainfall-runoff relationships or flow duration curves (Holmes and Sinclair 1986, Vertessy and Bessard 1999, Lane et al. 2005, Zhang et al. 2011, Brown et al. 2013), the use of empirical models (Zhang et al. 2001, Bren et al. 2006, Bren and Hopmans 2007, Greenwood et al. 2011), process-based models (Beverly et al. 2005, Marcar et al. 2010) and plot scale measurements (Benyon et al. 2006) to determine changes in streamflow and groundwater recharge and discharge following deforestation (permanent removal of forest) or afforestation (planting of forests on previously natural grassland or cleared agricultural land). These studies have produced results in broad agreement with studies elsewhere in the world: that permanent forest removal increases streamflow, while afforestation of grassland or cleared agricultural land reduces streamflows and groundwater recharge. In some circumstances, for example where annual potential ET substantially exceeds annual rainfall and where groundwater in an aquifer of high transmissivity is accessible to tree roots, plantation annual ET can exceed annual rainfall and plantations can be a net groundwater user (Benyon et al. 2006). The magnitude of responses of individual catchments and groundwater systems are variable, depending on rainfall, forest type and condition and catchment and groundwater characteristics. Using process-based models validated against long-term streamflow observations in several catchments, Marcar et al. (2010) demonstrated that the effects of partial afforestation of a catchment can be strongly influenced by the location of the plantations within the catchment and therefore that it is possible to choose locations for new plantations that minimise their water yield impacts. 27
Forest management and the impact on water resources: a review of 13 countries
Best water management practices Tasmania was the first state to introduce a mandatory code of forest practice (Forest Practices Act 1985) which applies to forestry activities in all public and private forest (see Forest Practices Board Tasmania, 2000). This 120-page document provides guidelines and standards for protection of environmental values including water quality and flow during and after forest harvesting operations. It includes definitions of streamside reserves and guidelines for management of these in native forests and plantations and specifies maximum limits for forest harvesting in water supply catchments per year. Victoria introduced a similar ‘Code of Forest practices for Timber Production’ in 1989 (The State of Victoria Department of Environment and Primary Industries, 2014). This 80 page document aims to “deliver sound environmental performance when planning for and conducting commercial timber harvesting operations” by detailing the mandatory regulatory principles and instructions which apply to all harvesting and associated roading operations on both public and private land in native and planted forests. Its six guiding principles include conservation of soil and water assets within forests and maintenance and improvement of river health, by protecting waterways and aquatic riparian habitats from disturbance and minimising water pollution by avoiding harvesting activities in sensitive areas such as steep slopes. It details specific mandatory actions required for all forest management and operational planning, protection of environmental values, for roading, timber harvesting and forest regeneration operations. It also lists other legislation and government policies relevant to protection and management of forests. Other Australian states and territories each have their own version of a forest management code, practice or guidelines. In 1995, in co-operation with Australia’s state and territory governments, Australia’s commonwealth government prepared a statement of national principles to be applied to management of forestry plantations (see http://www.agriculture.gov.au/forestry/australias-forests/ plantation-farm-forestry/principles). The two principles relevant to water quality and quantity are very general, stating: “Water quality (physical, chemical, or biological) should be protected by measures controlling change resulting from plantation activities” and “Water yield should be managed as required by careful planning of operations”. In 2012, Australia’s national scientific and research agency, the CSIRO, reviewed all of Australia’s codes of forest practice as applied to plantation forestry and how well these addressed the national principles (individual assessments can be downloaded at http://www.agriculture.gov.au/forestry/ australias-forests/plantation-farm-forestry/principles). These reports also detailed the relevant laws governing protection of water quality and yield in each state. Guidelines have also been developed for using tree planting to combat dry-land and irrigation salinity (Stirzaker et al. 2002, Polglase et al. 2002) and for land-based disposal of wastewater (Myers et al. 1999).
2.3 Politics The politics around forestry in Australia has often focussed on timber harvesting in native forests, resulting in development of state codes of forest practice (section 2.4) and regional forest agreements. However, since the late 1990s, there has also been debate in some regions over the effects of new plantations on water resources. Because Australia is a dry continent and much of the agriculture relies heavily on irrigation, water allocation has politically been a very controversial topic in Australia for many decades. Until the 1990s, water allocation for irrigation in the various states was largely uncontrolled with no accurate water accounting. Consequently in some surface and groundwater systems, more water was allocated for irrigation than was actually available, or in others water supplies were rapidly approaching full allocation. Water in Australia can be privately owned as an entitlement separate 28
Chapter 2. Forest Management and Water in Australia
from land titles. In some river systems or groundwater systems, water entitlements can be bought and sold on an open water market. Since the 1990s, state and federal governments have sought to introduce accurate water accounts and to regulate water usage through water licensing and trading systems to ensure water usage is sustainable and produces the greatest net socioeconomic and environmental benefits. This resulted in all states and federal government agreeing to a national water policy in 2004, called the National Water Initiative (see http://www.nwc.gov.au/__data/assets/ pdf_file/0008/24749 /Intergovernmental-Agreement-on-a-national-water-initiative.pdf). This aims to ensure sustainable use of scarce water resources, with water going to the most productive uses, once the needs of the environment have been met. Three paragraphs in this document identify the need to account for activities that reduce water supplies but which are not currently accounted for. New forestry plantations are specifically mentioned as one such activity that may require management or regulation in areas where the available water is currently over allocated or close to full allocation. Greenwood (2013) provides a comprehensive overview of the development of Australian policy on impacts of industrial plantations on water resources.
2.4 Climate change and the future of forestry & forest research Recent and current ‘hot research topics’ include: tree planting to manage dry land salinity caused by previous clearing of native vegetation for agriculture; impacts on water yield of afforestation of previously cleared land; determining and managing environmental water requirements of floodplain forest and woodland ecosystems along highly regulated rivers; understanding impacts of wildfires and planned burning on water quality in native forests; understanding threats to the health of native vegetation caused by global warming and increasing severity of droughts. Emerging issues include the impact of groundwater pumping for coal seam gas extraction on groundwater dependent vegetation including forests and the hydrological effects of large-scale afforestation for carbon sequestration to offset greenhouse gas emissions.
2.5 References Bari MA, Ruprecht JK, 2003. Water yield response to land use change in south–west Western Australia, Department of Environment, Salinity and Land Use Impacts Series Report No. SLUI 31. Beeton RJS, Buckley KI, Jones G J, Morgan D, Reichelt RE, Trewin D, 2006. Australia State of the Environment 2006. Independent report to the Australian Government Minister for the Environment and Heritage, Department of the Environment and Heritage, Canberra, 141pp. Benyon RG, Theieveyanathan S, Doody TM, 2006. Impacts of tree plantations on groundwater in south-eastern Australia. Australian Journal of Botany 54, 181-192. Benyon RG, Lane PNJ, Jaskierniak D, Kuczera G, Haydon SR, 2015. Use of a forest sapwood area index to explain long-term variability in mean annual evapotranspiration and streamflow in moist eucalypt forests. Water Resources Research in press. Beverly C, Bari M, Christy B, Hocking A, Smettem K, 2005. Predicted salinity impacts from land use change: comparison between rapid assessment approaches and a detailed modelling framework. Australia Journal of Experimental Agriculture 45, 1453-1469. Bren L, Lane P, McGuire D, 2006. An empirical, comparative model of changes in annual water yield associated with pine plantations in southern Australia. Australian Forestry 69, 275-284. Bren L, Hopmans P, 2007. Paired catchments observations on the water yield of mature eucalypt and immature radiata pine plantations in Victoria, Australia. Journal of Hydrology 336, 416-429. Bren L, Lane P, Hepworth G, 2010. Longer-term water use of native eucalyptus forest after logging and regeneration: The Coranderrk experiment. Journal of Hydrology 384, 52-64. Bren L, 2015. Forest Hydrology and Catchment Management: An Australian Perspective. DOI 10.1007/978-94-0179337-7. Springer, London, 276 pp. 29
Forest management and the impact on water resources: a review of 13 countries Brown AE, Western AW, McMahon TW, Zhang L, 2013. Impact of forest cover changes on annual streamflow and flow duration curves. Journal of Hydrology 483, 39-50. Buckley TN, Turnbull TL, Pfautsch S, Gharun M, Adams MA, 2012. Differences in water use between mature and post-fire regrowth stands of subalpine Eucalyptus delegatensis R. Baker. Forest Ecology and Management 270, 1-10. Cornish, P.M., Binns, D. 1987. Streamwater quality following logging and wildfire in a dry sclerophyll forest in southeastern Australia. Forest Ecology and Management 22, 1-28. Cornish PM, 1993. The effects of logging and forest regeneration on water yields in a moist eucalypt forest in New South Wales, Australia. Journal of Hydrology 150, 301-322. Cornish PM, Vertessy RA, 2001. Forest age-induced changes in evapotranspiration and water yield in a eucalypt forest. Journal of Hydrology 242, 43-63. Croke J, Hairsine P, Fogarty P, 1999. Sediment transport, redistribution and storage on logged forest hillslopes in south-eastern Australia. Hydrological Processes 13, 2705- 2720. Dunn GM, Connor DJ, 1993. An analysis of sap flow in mountain ash (Eucalyptus regnans)forests of different age. Tree Physiology 13, 321-336. Forest Practices Board, 2000. Forest Practices Code, Forest Practices Board, Hobart, Tasmania, 125 pp. Gharun M, Turnbull TL, Adams MA, 2013. Stand water use status in relation to fire in a mixed species eucalypt forest. Forest Ecology and Management 304, 162-170. Greenwood AJB, Benyon RG, Lane PNJ, 2011. A method for assessing the hydrological impact of afforestation using regional mean annual data and empirical rainfall–runoff curves. Journal of Hydrology 411, 49-65. Greenwood AJB, 2013. The first stages of Australian forest water regulation: National reform and regional implementation. Environmental Science & Policy 29, 124-136. Hawthorn SND, Lane PNJ, Bren LJ, Sims NC, 2013. The long term effects of thinning treatments on vegetation structure and water yield. Forest Ecology and Management 310, 983-993. Haydon SR, Benyon RG, Lewis R, 1996. Variation in sapwood area and throughfall with forest age in mountain ash (Eucalyptus regnans F. Muell.). Journal of Hydrology 187, 351-366. Holmes JW, Sinclair JA, 1986. Water yield from some afforested catchments in Victoria. Hydrology and Water Resources Symposium, Griffith University, Brisbane, 25-27 November 1986. The Institution of Engineers, Australia. Hopmans P, Flinn DW, Farrell PW, 1987. Nutrient dynamics of forested catchments in southeastern Australia and changes in water quality and nutrient exports following clearing. Forest Ecology and Management 20, 209-231. Hopmans P, Bren LJ, 2007. Long-term changes in water quality and solute exports in headwater streams of intensively managed radiata pine and natural eucalypt forest catchments in south-eastern Australia. Forest Ecology and Management 253, 244-261. Jaskierniak D, Kuczera G, Benyon R, Wallace L, 2015. Using Tree Detection Algorithms to Predict Stand Sapwood Area, Basal Area and Stocking Density in Eucalyptus regnans Forest. Remote Sensing 7, 7298-7323. Jayasuriya MDA, Dunn G, Benyon R, O’Shaughnessy PJ, 1993. Some factors affecting water yield from mountain ash (Eucalyptus regnans) dominated forests in south-east Australia. Journal of Hydrology 150, 345-367. Kuczera G, 1985. Prediction of water yield reductions following a bushfire in ash-mixed species eucalypt forest. Melbourne Metropolitan Board of Works, Report No. MMBW-W-0014, Melbourne Metropolitan Board of Works, Melbourne. Kuczera G, 1987. Prediction of water yield reductions following a bushfire in ash-mixed species eucalypt forest. Journal of Hydrology 94, 215-236. Lane PNJ, Mackay SM, 2001. Streamflow response of mixed-species eucalypt forests to patch cutting and thinning treatments. Forest Ecology and Management 143, 131-142. Lane PNJ, Best AE, Hickel K, Zhang L, 2005. The response of flow duration curves to afforestation. Journal of Hydrology 310, 253-265. Lane PNJ, Sheridan GJ, Noske PJ, 2006. Changes in sediment loads and discharge from small mountain catchments following wildfire in south eastern Australia. Journal of Hydrology 331, 495-510. Lane PNJ, Sheridan GJ, Noske PJ, Sherwin CB, 2008. Phosphorous and nitrogen exports from SE Australian forests following wildfire. Journal of Hydrology 361, 186-198.
30
Chapter 2. Forest Management and Water in Australia Langford KJ, 1976. Change in yield of water following a bushfire in a forest of Eucalyptus regnans. Journal of Hydrology 29, 87-114. Marcar N, Theiveyanathan T, Roxburgh S, Gilfedder M, Littleboy M, Christy B, Barlow K, Almeida A, Crawford D and Benyon R, 2010. Methodology to assess site-specific impacts of plantations on catchment water yields. CSIRO: Water for a Healthy Country National Research Flagship. Myers BJ, Bond W J, Benyon R G, Falkiner RA, Polglase PJ, Smith C J, Snow VO, Theiveyanathan S, 1999. Sustainable effluent-irrigated plantations: an Australian guideline. CSIRO, Canberra, 286p. Nolan RH, Lane PNJ, Benyon RG, Bradstock RA, Mitchell PJ, 2014. Changes in evapotranspiration following wildfire in resprouting eucalypt forests. Ecohydrology 7, 1363–1377. Nolan RH, Lane PNJ, Benyon RG, Bradstock RA, Mitchell PJ, 2015. Trends in evapotranspiration and streamflow following wildfire in resprouting eucalypt forests. Journal of Hydrology 524, 614-624. Parsons M, Gavran M, Davidson J, 2006. Australia’s Plantations 2006. Australian Government, Department of Agriculture, Fisheries and Forestry, Canberra, 60 pp. Polglase PJ, Theiveyanathan S, Benyon RG, Falkiner RA, 2002. Irrigation management and groundwater uptake in young tree plantations growing over high watertables. RIRDC Publication No 02/146, RIRDC, Canberra, 54 p. Roberts S, Vertessy R, Grayson R, 2001. Transpiration from Eucalyptus sieberi (L. Johnson) forests of different age. Forest Ecology and Management 143, 153-161. Ruprecht JK, Schofield NJ, 1989. Analysis of streamflow generation following deforestation in southwest Western Australia. Journal of Hydrology 105, 1-17. Sheridan GJ, Lane PNJ, Noske PJ, 2007. Quantification of hillslope runoff and erosion processes before and after wildfire in a wet Eucalyptus forest. Journal of Hydrology 343, 12-28. Smith H, Sheridan G, Lane P, Bren L, 2010. Best management practice guidelines for mitigating impacts on erosion and water quality from post-fire salvage harvesting of plantation forests. Technical Report 207, CRC for Forestry, Hobart, 48 pp. Smith HG, Sheridan GJ, Lane PNJ, Nyman P, Haydon S, 2011. Wildfire effects on water quality in forest catchments: A review with implications for water supply. Journal of Hydrology 396, 170-192. Stirzaker R, Vertessy R, Sarre R (editors) 2002. Trees, Water and Salt: An Australian guide to using trees for healthy catchments and productive farms. RIRDC, Canberra, 159 p. The State of Victoria Department of Environment and Primary Industries, 2014. Code of Practice for Timber Production 2014. Department of Environment and Primary Industries, Victoria, 80 pp. Townsend SA, Douglas MM, 2000. The effect of three fire regimes on stream water quality, water yield and export coefficients in a tropical savannah (northern Australia). Journal of Hydrology 229, 118–137. Vertessy RA, Watson FGR, O’Sullivan SO, Davis S, Benyon R, 1998. Predicting water yield from mountain ash forest catchments. Industry Report No. 98/4. Cooperative Research Centre for Catchment Hydrology, Melbourne, 38 pp. Vertessy RA, Bessard Y, 1999. Anticipating the negative hydrologic effects of plantation expansion: Results from a GIS-based analysis on the Murrumbidgee Basin. Cooperative Research Centre for Catchment Hydrology, Report 99/6, Canberra. Vertessy RA, Watson FGR, O’Sullivan SK, 2001. Factors determining relations between stand age and catchment water balance in mountain ash forests. Forest Ecology and Management 143, 13-26. Watson FGR, Vertessy RA, McMahon TA, Rhodes B, Watson I, 1999. The hydrologic impacts of forestry on the Maroondah catchments. Report No. 99/1. Cooperative Research Centre for Catchment Hydrology. Monash University, Victoria, Australia, 80 pp.
Watson F, Vertessy R, McMahon T, Rhodes B, Watson I, 2001. Improved methods to assess water yield changes from paired-catchment studies: application to the Maroondah catchments. Forest Ecology and Management 143, 189-204. Watson D, 2014. The Bush: travels in the heart of Australia. Penguin Books, Australia, 427pp. Webb AA, Kathuria A, Turner L, 2012. Longer-term changes in streamflow following logging and mixed species eucalypt forest regeneration: The Karuah experiment. Journal of Hydrology 464-465, 412-422.
31
Chapter 3. Forest Management and Water in Brazil Walter de Paula Lima3 (
[email protected]), Silvio Frosini de Barros Ferraz4, Carolina Bozetti Rodrigues3, Maria José Brito Zakia2, and Luiz Felippe Salemi5
3.1 Introduction From the point of view of the relationship between forest and water in Brazil, it is interesting to start with a brief analysis of the country’s native biomes and the associated water resources. As can be seen in Figure 1, the largest Brazilian biome is the Amazon, followed by the Cerrado and the Atlantic Forest (IBGE, 2004). The Amazon biome encompasses an area of 4,196,943 km2, the largest continuous remnant of tropical forest in the world, associated with the Amazon River basin. Besides its importance in terms of the largest fresh water reservoir (Tundisi, 2014), it is also currently recognized that the Amazon forests play a major influence in the atmospheric circulation and rainfall generation, not only locally, but also to other regions of the country, especially the noutheast (Makarieva et al., 2014). The Cerrado biome covers an area estimated as 2,036,448 km2 , equivalent of about 25% of the Brazilian territory, covered with woody savanna vegetation and located in the central part of the country. This biome has also a paramount importance in terms of water resources, for it is the home of the headwaters of very important river basins: São Francisco, Paraná, Tocantins and Parnaiba, which are the main water source for hydroelectricity generation in the country (Oliveira et al., 2014). The Atlantic Forest biome covers an area of about 1,110,182 km2 and is located along the eastern coast, the most developed and populous part of Brazil. Over 67% of the Brazilian population lives in this biome. Because of this, it has suffered an historic process of deforestation and human occupation since the discovery of the country back in the year 1500, and it is estimated that the present remnants of this biome correspond to about 17% of its original cover (Calmon et al., 2011), from which only 8% can be classified as closed, native forests. The Atlantic Forest biome is composed by distinct forest physiognomies, which has resulted in a significant biological diversity. Its importance in terms of water values derives from the fact that it protects the water sources for the supply of many cities and a huge population (MMA, 2007). The other three Brazilian biomes are comparatively smaller in area. The Caatinga biome corresponds to a vegetation cover of stepped savanna, which is entirely located in the national territory, with an area of 844,453 km2, occupying the northeastern, semi-arid part of the country. The Pampas biome comprises the grasslands of the southern part of the State of Rio Grande do Sul, in the southernmost part of the country, with an area of 176,496 km2. And the smallest biome is the Pantanal, a floodplain with an area of 150,355 km2 in the southwest part of the country. Surface water availability in the country is entirely dependent on the regularity of the precipitation regime and on storage conditions of the catchments, which, in turn, is very much related with the forest cover. Historically, however, the development of the country, in terms of agricultural expansion and urbanization, was accompanied by a widespread process of deforestation of the native forest ecosystems, the most critical of which was the one observed in the Atlantic Forest biome, but also, in smaller proportion, in the Amazon. As a result, this deforestation process may have influenced the evapotranspiration patterns locally (Gordon et al., 2011), but for sure it was responsible for the surface degradation of a huge amount of catchments in many places, with all consequences in terms of alteration of the catchment hydrological stability, soil erosion, soil compaction, water 5 3 4
Forest Science Department, Escola Superior de Agricultura “Luiz de Queiroz”, University of São Paulo Praxis Consultants Forest Resources Graduate Program, Escola Superior de Agricultura “Luiz de Queiroz”, University of São Paulo
33
Forest management and the impact on water resources: a review of 13 countries
quality degradation and decrease in water storage capacity (Bruijnzeel, 2004). Therefore, a most critical need, now, is the restoration of forest cover, at least in terms of reclamation of hydrologically sensitive areas, riparian areas at the scale of the small catchments and aquifer recharge areas. It has been estimated, for example, that the deficit of riparian forests in the State of São Paulo alone amounts to approximately 1.4 million hectares (IPEF, 2014).
Figure 1. Brazilian biomes and location of planted forests (modified from IBGE, 2004). Figure 1. Brazilian biomes and location of planted forests (modified from IBGE, 2004).
Surface water availability the country is entirely on the of the precipitation Therefore, in terms of the in relation of natural forest dependent management andregularity water resources in the country, on storage conditions the catchments, in of turn, is very related with the itregime can beand summarized that in the of Amazon there is awhich, surplus water andmuch deforestation is expected forest cover. river Historically, however, thelong development of thethere country, in terms of agricultural expansion to influence flow regime in the run, although is still no scientific evidence for this and urbanization, wasregion, accompanied by aforests widespread process of deforestation of the native but forest effect. In the Atlantic remaining still play an important regulation function this role is limited as the a result their of conditions, the landscape and proportion in relation to in the ecosystems, most of critical which wasposition the one in observed in the Atlantic Forest biome, but also, catchment area. Nevertheless, the expectation of most people inprocess the country thatinfluenced the restoration smaller proportion, in the Amazon. As a result, this deforestation may is have the of native forests, in general, very much important for thebut conservation of water resources. Similarly, evapotranspiration patternsislocally (Gordon et al., 2011), for sure it was responsible for the water problems areamount alwaysofattributed toindeforestation. many other human surfaceresources degradation of a huge catchments many places, Surprisingly, with all consequences in terms alteration of the landscape, which also affects water resources, does not always raise preoccupation. of alteration of the catchment hydrological stability, soil erosion, soil compaction, water quality degradation and decrease in water storage capacity (Bruijnzeel, 2004). Therefore, a most critical need,
Forest plantations, on the other hand, have always been considered as detrimental to water resources now, is the restoration of forest cover, at least in terms of reclamation of hydrologically sensitive by the people, in general, very much in the same way as it occurs in other parts of the world. The areas, riparian areas at the scale of the small catchments and aquifer recharge areas. It has been total area of forest plantations in Brazil amounts to more than 66,500 km2, 76% with eucalypt and estimated, for example, that the deficit of riparian forests in the State of São Paulo alone amounts to 24% with pine species (ABRAF, 2013), the majority being located in the southeast, south and central
approximately 1.4 million hectares (IPEF, 2014).
34
32
Chapter 3. Forest Management and Water in Brazil
regions of Brazil. However, the expansion of forest plantation areas can now be seen in other, nontraditional, parts of the country (Figure 1). Wood production of eucalypt plantations, which was around 25 cubic meter per hectare per year in the early phase of the introduction of the species in the country, is presently around 45 cubic meter per hectare per year, although values as high as 60 cubic meter per hectare per year can usually be achieved, as a result of the gradual improvement of silviculture technology, species selection and genetic improvements (Gonçalves et al., 2013). On the other hand, such high productivity is usually achieved on a rotation length of around 6 to 7 years. For the supply of short fiber raw material for the pulp industry, these conditions are indeed competitive. Since the introduction of the species in the country about one hundred years ago, eucalypt plantations have become a very familiar element in the landscape of the rural Brazil, providing presently around 70 million cubic meters of wood that supply an ever increasing demand for multiple applications, including wood for energy, charcoal, furniture, panels, fiber boards and for the steel industry and civil construction (ABRAF, 2013). However, in spite of the unquestionable economic and social value of the species for the country, forest plantations, mainly eucalypt plantations, are still viewed with criticism by many people, nongovernmental organization (NGOs), environmentalists, social organizations and also scholars, instigated by ancient popular opinions, beliefs and ideological disputes. It is interesting to remember, however, that this worldwide controversy is not related to eucalypt plantation only, but to forests in general. That is, the relation between forest and water is still unresolved (Andréassian, 2004). In the early phase of the forest plantations development in Brazil, as a result of a government incentive programs, much of what is known today in terms of forest hydrology, catchment water balance, landscape ecology, tree physiology and ecosystem services had not been taken into account neither in the process of licensing of the proposed afforestation projects by the government environmental agencies, nor, most importantly, in terms of the implementation of sustainable management strategies. It was common and allowed, for example, to cut remnants of natural forests for reforestation with plantations, which is today not only prohibited but considered outrageous. On the other hand, in many cases there was no preoccupation at all with the protection of hydrologically sensitive areas of the catchments along the plantation landscape, which still can be seen in old plantations in some parts of the country. As given in the current Brazilian Forest Code, these areas are considered as “permanent preservation areas” and must be protected and set aside from production purposes. This strategy also contributes to biodiversity conservation within the plantation stands (Hartley, 2002). Therefore, part of this criticism in the country may also be related with this unplanned beginning of plantation forestry. Clearly, it thus appears that the controversy is not just of technical nature, but involves many other aspects other than the simple question of how much water do eucalypt plantations use, or whether they dry up the soil or not. It has to be tackled as a complex environmental problem, the solution of which does require the scrutiny of science, but must also take into account all the uncertainties involved in the relationship between the use of the natural resources and the related environmental impacts, mainly in terms of maintaining the ecosystems services and also including the social and cultural trade-offs involved in the transformation of the landscape and the expansion of the area of forest plantations. This new environmental perception began to gain momentum in the country at the end of the 1980´s and forest companies began to review their plantation management strategies. Most of them soon created an “environmental department” in their administrative structure. The market-oriented scheme of Forest Certification undoubtedly gave a substantial contribution for the insertion of environmental and water preoccupation in the management strategies. And then the philosophical concepts of sustainable development and sustainable forest management emanated from the UNCED Conference in Rio de Janeiro in 1992, practically consolidated, at least conceptually, the need for this paradigmatic change.
35
Forest management and the impact on water resources: a review of 13 countries
In summary, it can undoubtedly be said that the Brazilian forest plantation sector improved substantially from the point of view of the environment. But it can also be said that there is still space for further improvements in this regards, mainly in terms of hydrology and the challenge of balancing the main economic objective of forest production with the incorporation of water values in the management strategies, as will be discussed further in this chapter.
3.2 Literature review In spite of the large territory of the country, and also taking into account the diversity of forest biomes, the preoccupation with the relationship between forest and water, in terms of research programs and public policies, is still scarce in Brazil, mainly as related to the effects of native forests management and the effects on water. On the other hand, the Brazilian scientific literature related to forest plantations and water is more abundant and a review of the majority of such studies can already give a consistent perspective of the relationship between forest plantation and water, at least in terms of the magnitude of the potential effects on catchment water balance in different parts of the country (Lima et al., 2012b). As indicated in Figure 2, the studies related to forest plantations and water were developed mainly in the regions with the largest concentrations of forest plantations (Lima et al., 1990; Vital et al., 1999; Soares & Almeida, 2001; Almeida et al., 2007; Cabral et al., 2010; Facco et al., 2012; Lima et al., 2012a; Lima et al., 2012b; Trevisan et al., 2012; Almeida et al., 2013; Ferraz et al., 2013), whilst the fewer studies related to native forests and water were done the northern of the Amazon 2012a; Lima et al., 2012b; Trevisan et al., 2012; Almeida et al.,in2013; Ferraz et region al., 2013), whilst the and in the central part of the country (Holscher et al., 1997; Shuttleworth, 1988; Sommer et al., fewer studies related to native forests and water were done in the northern region of the Amazon 2002; and Borma et al., 2009; et al., 2015). et This indeed a preoccupation when one considers in the central part ofVourlitis the country (Holscher al., is 1997; Shuttleworth, 1988; Sommer et al., 2002; the Borma etsurface al., 2009; Vourlitis etthat al., 2015). This from is indeed a preoccupation when in one considers theor the potential degradation can result unplanned deforestation the Amazon, potential surface degradation that can result from unplanned deforestation in the Amazon, or the current policy for the transformation of the Cerrado biome for agricultural expansion, in spite of the current policy for the transformation the Cerrado biome for agricultural expansion, in spite of the major water importance of this biomeof(Oliveira et al., 2014). major water importance of this biome (Oliveira et al., 2014).
Figure 2. Localization of the research studies of forests and water in Brazil, in terms of forest plantations with eucalyptus 2. Localization and pine and Figure also of native vegetation. of the research studies of forests and water in Brazil, in terms
of forest plantations with eucalyptus and pine and also of native vegetation. For the comparative evaluation of the research results related to forest and water, in terms of forest plantations and native forests, the average annual values of precipitation and evapotranspiration were 36 calculated based on the annual values mentioned in the reviewed studies. These average annual values were plotted against the so called “Zhang Curve” (see Figure 3), which was derived based on the analysis of over 250 experimental catchments worldwide (Zhang et al., 2001). Forest plantations in
Chapter 3. Forest Management and Water in Brazil
For the comparative evaluation of the research results related to forest and water, in terms of forest plantations and native forests, the average annual values of precipitation and evapotranspiration were calculated based on the annual values mentioned in the reviewed studies. These average annual values were plotted against the so called “Zhang Curve” (see Figure 3), which was derived based on the analysis of over 250 experimental catchments worldwide (Zhang et al., 2001). Forest plantations in Brazil are located in regions with average annual precipitation varying from 1100 to 1500 mm, while the average annual evapotranspiration varies from 800 to 1400 mm. As for the few studies with native forests, the average annual precipitation varies from 1600 to 2600 mm, whilst the annual evapotranspiration varies from 900 to 1500 mm. canalso alsobebe seen in Figure 3 the thatmajority the majority the annual evapotranspiration values of the ItIt can seen in Figure 3 that of theofannual evapotranspiration values of the forest forest plantation studies fall above the Zhang curve. However, the model proposed by Zhang et al. plantation studies fall above the Zhang curve. However, the model proposed by Zhang et al. 2001) 2001) not developed forest plantations, but mature native forests (Bren, was notwas developed for forestfor plantations, but mostly formostly maturefor native forests (Bren, 2015). This2015). detail This detail may explain why the values of average annual evapotranspiration of eucalypt forest may explain why the values of average annual evapotranspiration of eucalypt forest plantations in plantations in Brazil stay above the Zhang curve, for these values were obtained with fast-growing, Brazil stay above the Zhang curve, for these values were obtained with fast-growing, highly highly productive commercial plantations, which are usually managed on a rotation length of 6 to 7 productive commercial plantations, which are usually managed on a rotation length of 6 to 7 years. years. Undoubtedly, these conditions are related to correspondingly increases in water consumption. Undoubtedly, these conditions are related to correspondingly increases in water consumption. Based on Figure 3, it is expected that fast growing, highly productive forest plantations, managed at a
Based on Figure 3, it is that will fastpresent growing, highly productive forest plantations, managed at a short rotation length of expected 6 to 7 years, higher annual evapotranspiration, as compared with short rotation 6 to 7 years, will called presentattention higher annual compared with mature nativelength forest.ofRosoman (1994) to this evapotranspiration, effect, referring to itasas the “plantation effect”.native In practical this(1994) meanscalled that the potential impact of referring this higher consumption mature forest.terms, Rosoman attention to this effect, to water it as the “plantation is very much dependent on this soil means conditions on the climatic of the region (Lima effect”. In practical terms, that and the potential impact water of thisavailability higher water consumption is et al., 2012b). is higher, incrementofinthe water consumption In humidon climates, where water very much dependent soil conditions and onsurplus the climatic waterthis availability region (Lima et may not beInnoted. impact be more severe regions ofinnaturally lower climatic al., 2012b). humidHowever, climates, the where waterwill surplus is higher, thisinincrement water consumption water may notsurplus. be noted. However, the impact will be more severe in regions of naturally lower climatic water surplus. 1600
Annual Evapotranspiration (mm)
1400 1200 1000 800 600 400 200 0 0
400
800
Forests (Zhang et al., 1999)
1200 1600 Annual Precipitation (mm) Eucalyptus spp.
2000
Native vegetation
2400
2800
Pinus spp.
Figure 3. Values of average annual evapotranspiration and precipitation obtained in the studies in Brazil and the Zhang Figure 3. Values of average annual evapotranspiration and precipitation curve. obtained in the studies in Brazil and the Zhang curve.
On the other hand, this evidence also suggest, in practical terms, that a major research challenge is related the search of forest plantation management strategies thatthat contribute the elimination, or is On theto other hand, this evidence also suggest, in practical terms, a majortoresearch challenge decrease ofthe the search potential of this highmanagement water consumption (Lima et contribute al., 2012a;to Ferraz et al., related to of impact forest plantation strategies that the elimination, 2013). or decrease of the potential impact of this high water consumption (Lima et al., 2012a; Ferraz et al., 2013).
Using current scientific information, some effective actions could be considered at the macro and meso scales, seeking to improve forest plantation planning in order to avoid water impacts and increase water conservation.
37
Forest management and the impact on water resources: a review of 13 countries
Using current scientific information, some effective actions could be considered at the macro and meso scales, seeking to improve forest plantation planning in order to avoid water impacts and increase water conservation. The most important attribute observed at macro scale is the regional climate, mainly the aspects of water availability, considering the total annual precipitation, potential evapotranspiration and also the soil water balance along the year. Other important aspect at this scale refers to physical attributes of landscape like geology and relief, indicating potential water behavior regarding infiltration, runoff and problems related to erosion, soil water retention and nutrient losses (Hewlett & Hibbert, 1967). At the meso scale, the most important aspect is the spatial and temporal planning of land use at the catchment, including protected areas proportion and location, road design, clear-cut planning. Some examples of actions at the macro and meso scales are shown below. Macroscale actions – the regional hydrological zoning based on total annual precipitation and potential evapotranspiration, as proposed by Calder (2007), would allow to identify regions more vulnerable to higher water consumption by forest plantations, where it is expected environmental and social impacts by a significant reduction of water flow in the streams (Farley et al., 2005). In this case, those areas could be submitted to specific actions at meso and micro scale in order to compensate for the low water availability, and increase the “blue water” flow at managed areas (Falkenmark & Folke, 2002), thus avoiding conflicts. The hydrological response is another important aspect that could be assessed by discharge/precipitation ratio, or specific indices such as the Flashness Index (Baker et al., 2004). This regional characterization is based mainly on soil and terrain attributes and allows the land classification considering water behavior that is very useful to guide forest management in order to reduce environmental impacts. For example, regions with characteristically high hydrological response areas are more prone to the occurrence of extreme events of droughts and floods, and also erosive processes. Mesoscale actions – one of the most important actions at this scale is the definition of forest plantation proportion at landscape level. According to regional environmental law and the existence of conservation areas, forest plantations in Brazil occupy a proportion varying between 10% and 40% of a given property area. The proportion of protected areas could be increased in regions of naturally low water availability, not only by creation of reserves, but also by the alternative schemes of forest management, such as increasing the rotation length, which would contribute to diminish the plantation effect (Rosoman, 1994). In the same way, the mosaic management of clear-cut presents high potential of diminishing water consumption impacts, since it consider a mix of stands with different ages (and water consumption), thus avoiding the occurrence of huge clear-cut areas. The spatial structure of plantation areas in relation to streams and runoff channels also could be a management tool seeking to attenuate impacts and excessive water consumption, shifting plantations from areas with higher soil water content that have important water yield function at the catchment scale, as hydrologically sensitive areas (Agnew et al. 2006). The identification of these areas could indeed help local land-use planning. Also, the road design could be modified considering the surface water dynamics at the landscape level, deactivating roads from more sensitive areas, reducing density and also redesigning some roads in order to avoid stream sedimentation (Ferraz et al., 2007).
3.3 Politics Brazil has a comprehensive environmental law system, which has become stronger after the promulgation of the ‘new’, 1988 Constitution.
38
Chapter 3. Forest Management and Water in Brazil
From the point of view of the relation between forests and water, two laws deserve comments: the Forest Code6 and the National Policy of Water Resources7. The Forest Code requires that all rural properties, be it public or private, should maintain a percentage of native vegetation, which varies from 20 to 80% of the property area, depending on the country region. Part of this percentage must be located on the so called “permanent preservation areas”, which have been established for the purpose of soil and water conservation. These areas are located mainly along water courses, and also around springs and headwater areas, as well as around natural water bodies, lakes and reservoirs, as established during the licensing process. On the other hand, the National Policy of Water Resources established a decentralized administration by river basin, aiming to conciliate the environment and the water conservation. Each river basin must have a Committee and an Agency, which are responsible for, respectively, the elaboration of the River Basin Planning, and for the implementation of such plan. The funding for these actions derives from the charges for water use. Therefore, Brazil is well endowed with environmental laws, but the ineffective enforcement of these laws difficult the real achievement of their environmental objectives. On the other hand, another example of public policy in this respect is the recent, new legal tool, referred to as Environmental and Rural Register, by which the owners of all rural properties must declare whether their land use is or is not in accordance with the Forest Code. In case it is not, there will be a term, ranging from 5 to 20 years for the restoration of the forest cover in areas that should be protected. This Register is done on a geographic information system and all information are nested on an imagery with a resolution varying from 1:25,000 to 1: 50,000, depending on the region. It is expected that this new tool will enforce forest conservation. Another example of a powerful tool, not only related to law enforcement, but also to the social and environmental administration of forest companies, is the Forest Certification. A recent survey made by Imaflora (Institute of Agricultural and Forest Management and Certification), one of the Brazilian Certification Institutions, compared the requirements of the Forest Code with the Forest Certification requirements among certified and non-certified forest companies, and the results are summarized in Table 1 (Pinto et al., 2014).
Table 1. Impacts of the Forest Stewardship Council Certification on the conservation of native vegetation in forest plantation areas in the South of Brazil (Pinto et al., 2014). Practice
6 7
Law requirement
Percentage of forest companies that use the practice Certified Group
Control Group
Control Plan of invasive species
No
100%
33%
Fauna and Flora Studies
No
71%
29%
Planting of native species
Yes
71%
50%
Monitoring of environmental legislation
No
100%
29%
Environmental licensing
Yes
86%
14%
Legal Reserve Registering
Yes
100%
57%
% of native forest
Yes
42%
34%
Conversion of native forests to plantations
No
100%
57%
Law 9433, of 8 January 1997 Law 12651, of 25 May 2012
39
Forest management and the impact on water resources: a review of 13 countries
3.4 Climate change and the future of forests & forest research Although causation of global warming and climatic extreme events is still a matter of debate in the scientific community (Parmesan and Yohe, 2003), it seems apparent that climate extremes are becoming more common. Given the profound changes announced by the IPCC reports, climate is changing at all scales (Lawrence and Vandecar, 2014). For example, at the macroscale, circulation patterns that govern the climate of huge regions such as the Amazon basin and the southeast are likely to change. Climatic events are predicted to be more frequent and also intense (Timmermann et al., 1999). This picture is translated into the broader generalization of IPCC reports, that is, the increasing frequency of extreme events (Easterling et al., 2000) that include not only floods but also severe droughts as was experienced in Brazil in 2014. As a matter of the fact, in this referred year, the southeast region experienced one the most severe droughts in the history of the records while, at the same time, some rivers of the Amazon basin (e.g. Negro River) reached one of the highest flood stages. With this in mind, an important topic that should be the focus of research is related to deforestation in the Amazon basin and its effects on climate since the last one influences economic activity in many sectors including forestry. Climatic interactions (teleconnections) between macroregions in Brazil, that is, the north region (Amazon basin) and the southeast, showed that the former provides a substantial amount of water vapor that, ultimately, generates rain at the latter (Fearnside, 2004). With increasing deforestation in the Amazon, climate patterns in the southeast are likely to change (Lawrence and Vandecar, 2014). Thus, understanding changes in circulation patterns at the macroscale seems to be a clear focus of research that may collaborate in predicting a better zoning of forest plantations and water management actions in case deforestation patterns and greenhouse emissions are not halted. In addition, at the local scale, research on the forest ecosystem behavior of different ecosystem under drought scenarios such as the “Seca Floresta Project” in the Amazon (Brando et al., 2008) must continue to document the consequences of a dryer climate in the Amazon and other biomes in the medium to long-term. At this point, in a changing climate, a new agro climatic zoning should be carried out indicating the ‘new’ regions more suitable for forest plantations under many climate scenarios (e.g. Garcia et al., 2014). With these zoning maps, the already documented and predicted expansion of forest plantations in the country (Kröger, 2012; Campos, 2013; Rezende et al., 2013) could be, for example, established in degraded pastures sites that abound in Brazil (Dias-Filho et al., 2014), where sufficient annual rainfall is available. This would lead to an increase in carbon storage above ground and, thus, would contribute to tackle climate change through carbon biological sequestration with low impacts on water resources. Currently, eucalypt plantations are predicted mainly towards the areas of Cerrado and Atlantic Forest (Campos, 2013), where climate is seasonal. This could lead to more conflicts relating to forest plantations, water and people in the tropics. At the catchment scale, besides the development of more water efficient cultivars, emphasis must also be given to the development and implementation of best management practices that improve soil water infiltration which, if exceed evapotranspiration (likely to occur in wet years), would lead to higher dry season flow (Bruijnzeel, 2004; Ogden et al., 2013). This, in turn, is related to many important ecosystem services for downstream users, such as water supply, energy generation (hydropower) and aquatic species conservation. Such practices include harvesting with machinery of low impact on soil physical properties as well as increasing soil organic matter content. Furthermore, best management practices should not be restricted to the forest plantations areas, but should focus on the provisioning of ecosystem services at whole landscape level (Foley et al., 2005). Wellconserved and diverse native riparian buffers, for example, could provide predators for many insects that could damage forest plantations. Thus, these riparian ecosystems would lead to an increase in resilience of forest plantations at this higher hierarchical level. Lastly, long-term studies monitoring hydrological variables within small catchments as well as simulation studies with these dataset should be stimulated. This would increase the records and, thus, increase our observation and prediction skills to understand streamflow responses to climate change (Strauch et al., 2015). 40
Chapter 3. Forest Management and Water in Brazil
Finally, increases on the knowledge of hydrological ecosystem functioning as well as ecosystem restoration in many biomes such as Pantanal, Cerrado, Amazon and Atlantic Forest should be also included as future actions of research. In this sense, restoration practices should not be restricted to the restoration action per se, but they should focus on the development of different ecological strategies more suitable to each of these biologically and physically diverse biomes, that, as noted earlier in this chapter, have very important functions on regulating the hydrological cycle in the whole country.
3.5 Acknowledgements The advance in the knowledge of the relation of forest plantations and water in Brazil is being acquired with the accumulated results of a cooperative program of hydrologic monitoring of forest plantation management in 16 experimental catchments located in several parts of the country, coordinated by the Forest Hydrology Laboratory of the University of São Paulo and IPEF – Institute of Forest Research and Studies (www.ipef.br/promab). Thanks are also due to Carla Cristina Cassiano e Aline Aparecida Fransozi, for the elaboration of the maps.
3.6 References ABRAF (Associação Brasileira de Produtores de Florestas Plantadas). Anuário estatístico da ABRAF 2013, ano base 2012. Associação Brasileira de Produtores de Florestas Plantadas, Brasília, 2013, 148p. Agnew L.J.; Lyon, S.; Gérard-Marchant, P.; Collins, V.B.; Lembo, A.J.; Steenhuis, T.S.; Walter, M.T. Identifying hydrologically sensitive areas: Bridging the gap between science and application. Journal of Environmental Management, 78, p. 63–76, 2006. Almeida, A.Q.; Ribeiro, A.; Leite, F.P. Modelagem do balanço hídrico em microbacia cultivada com plantio comercial de Eucalyptus grandis X urophylla no leste de Minas Gerais, Brasil. Revista Árvore, Viçosa-MG, v.37, n.3, p.547556, 2013. Almeida, A.C.; Soares, J.V.; Landsberg, J.J.; Rezende, G.D. Growth and water balance of Eucalyptus grandis hybrid plantations in Brazil during a rotation for pulp production. Forest Ecology and Management, 251, p.10–21, 2007. Andréassian, N. Water and forests: from historical controversy to scientific debate. Journal of Hydrology, 291, p. 1-27, 2004. Baker, D.B. ; Richards, R.P. ; Loftus, T.T. ; Krame, J.W. A new flashiness index: characteristics and applications to Midwestern rivers and streams. Journal of the American Water Resources Association, American Water Resources Association, Middleburg, v. 40, n. 2, p 503-522, 2004. Borma, L.S.; Rocha, H.R,; Cabral, O.M.; Von Randow, c.; Collicchio, E.; Kurzatkowski, D.; Brugger, P.J.; Freitas, H.; Tannus, R.; Oliveura, L.; Rennó, C.D. Atmosphere and hydrological controls of the evapotranspiration over a floodplain forest in the Bananal Island region, Amazonia. Journal of Geophysical Research, V. 114, p. 01-12, 2009. Bren, L. Forest Hydrology and Catchment Management, An Australian Perspective. Springer Netherlands, 268 p., 2015. Brando, P.M.; Nepstad, D.C.; Davidson, E.A.; Trumbore, S.E.; Ray, D.; Camargo, P. Drought effects on litterfall, wood production, and belowground carbon cycling in an Amazon forest: results of a throughfall reduction experiment. Phylosophical Transactions of the Royal Society B Biological Sciences, v.364, n.1498, p.1839-1848, 2008. Bruijnzeel, L.A. Hydrological functions of tropical forests: not seeing the soil for the trees? Agriculture, Ecosystems & Environment, v.104, n.1., p.185-228, 2004. Cabral, O.M.R.; Rocha, H.R.; Gash, J.H.C.; Ligo, M.A.V.; Freitas, H.C.; Tatsch, J.D. The energy and water balance of a Eucalyptus plantation in southeast Brazil. Journal of Hydrology, 388, p. 208-216, 2010. Calder, I.R. Forests and water: ensuring forest benefits outweigh water costs. Forest Ecology and Management, 251, p. 110-120, 2007.
41
Forest management and the impact on water resources: a review of 13 countries Calmon, M.; Brancalion, P.H.; Paese, A.; Aronson, J.; Castro, P.; Silva, S.C.; Rodrigues, R.R. Emerging threats and opportunities for large-scale ecological restoration in the Atlantic Forest of Brazil. Restoration Ecology, 19 (2), p.154158, 2011. Campos, A.R. Modelagem territorial de cenário da expansão das plantações de eucalipto no Brasil. Belo Horizonte: Universidade Federal de Minas Gerais, 2013. 49p. (Master Dissertation). Dias-Filho, M.B. Diagnóstico das pastagens no Brasil. Belém – PA: EMBRAPA Amazônia Oriental, 36p., 2014. Easterling, D.R.; Meehl, G.A.; Parmesan, C.; Changnon, S.A.; Karl, T.R.; Mearns, O.L. Climate extremes: observations, modeling, and impact. Science, v.289, n.5487, p.2068-2074, 2000. Facco, A.G. et al. Técnicas de geoinformação para estimativa do balanço hídrico em eucalipto. Pesquisa Agropecuária Brasileira, Brasília, v.47, n.9, p.1243-1250, set. 2012. Falkenmark, M.; Folke, C. The ethics of sócio-hydrological catchment management: towards hydrosolidarity. Hydrology & Earth System Sciences, 6 (1), p.1-9, 2002. Farley K.A.; Jobbagy E.G.; Jackson R.B. Effects of afforestation on water yield: a global synthesis with implications for policy. Global Change Biology, 11, p.1565-1576, 2005. Fearnside, P.M. A água de São Paulo e a floresta amazônica. Ciência Hoje, 34, n.203, p.63-65, 2004. Ferraz, S.F.B.; Marson, J.C.; Fontana, C.R.; Lima, W.P. Uso de indicadores hidrológicos para classificação de trechos de estradas florestais quanto ao escoamento superficial. Scientia Forestalis, n. 75, p. 39-49, 2007. Ferraz, S.F.B.; Lim, W.P.; Rodrigues, C.B. Managing Forest plantation landscapes for water conservation. Forest Ecology and Management, 301, p.58–66, 2013. Foley, J.A., Defries, R. Asner, G.P., Barford, C., Bonan, Carpenter, S.R., Chapin, F.S., Coe, M.T., Daily, G.C., Gibbs, H.K., Helkowski, J.H., Holloway, T., Howard, E.A., Kucharik, C.J., Monfreda, C., Patz, J.A., Prentice, I.C., Ramankutty, N., Snyder, P.K. Global consequences of land use. Science, v.5734, p.570-574, 2005. Garcia, L.G.; Ferraz, S.F.B.; Alvarez, C.A.; Ferraz, K.M.P.M.B.; Higa, R.C.L. Modelagem de aptidão climática de Eucalyptus grandis frente aos cenários de mudança climática. Scientia Forestalis, v.42, n.104, 81-87, 2014. Gonçalves, J.L.M.; Alvares, C.A.; Higa, A.R.; Silva, L.D.; Alfenas, A.C.; Stahl, J.; Ferraz, S.F.B.; Lima, W.P.; Brancalion, P.H.S.; Hubner, A.; Bouillet, J.P.D. Integrating genetic and silvicultural strategies to minimize abiotic and biotic constraints in Brazilian eucalypt plantations. Forest Ecology and Management, 301, p. 6–27, 2013. Gordon, L.J.; Finlayson, C.M.; Falkenmark, M. Managing water in agriculture for food production and other ecosystem services. Agricultural Water Management, 97, p.512-519, 2011. Hartley, M.J. Rationale and methods for conserving biodiversity in plantation forests. Forest Ecology and Management, 155: 81-95, 2002. Hewlett, J.D.; Hibbert, A.R. Factors affecting the response of small watersheds to precipitation in humid areas. In Sopper, W.E. and Lull, H.W., editors, Forest hydrology, New York: Pergamon Press, p. 275–90, 1967 Holscher, D.; Sá, T.D.A.; Bastos, T.X.; Denich, M., Folster, H. Evaporation from young secondary vegetation in eastern Amazonia. Journal of Hydrology, 193, p.293–305, 1997. IBGE (Instituto Brasileiro de Geografia de Estatística). Mapa de Biomas do Brasil. 2004. IPEF. Relatório de Consultoria, Contrato UGL/PDRS/BIRD. 2014. Kröger, M. The expansion of industrial tree plantations and dispossession in Brazil. Development and Change, v.43, n.4, p.947-973, 2012. Lawrence, D.; Vandecar, K. Effects of tropical deforestation on climate and agriculture. Nature Climate Change, v.5, p.27-36, 2014. Lima, W.P.; Zakia, M.J.B.; Libardi, P.L.; Souza Filho, A.P. Comparative evapotranspiration of Eucalyptus, Pine and natural cerrado vegetation measured by the soil water balance method. IPEF International, 1, p.5-11, 1990. Lima, W.P.; Laprovitera, R.; Ferraz, S.F.B.; Rodrigues, C.B.; Silva, M.M. Forest Plantations and Water Consumption: A Strategy for Hydrosolidarity. International Journal of Forestry Research, Volume 2012a, 8 pages. Lima, W.P.; Ferraz, S.F.B.; Rodrigues, C.B.; Voigtlaender, M. Assessing the hydrological of forest plantations in Brazil. In: Boon, P.J.; Raven, P.J. River Conservation and Management. Wiley-Blackwell, 20p., 2012b.
42
Chapter 3. Forest Management and Water in Brazil MMA (Ministério do Meio Ambiente). Mapa de cobertura vegetal dos biomas brasileiros. Projeto de Conservação e Utilização Sustentável da Diversidade Biológica Brasileira - PROBIO.18p.2007.Available: http://www.mma.gov.br/ publicacoes/biomas/category/112-geral Makarieva, A.M.; Gorshkov, V.G.; Sheil, D.; Nobre, A.D.; Bunyard, P.; Li, B,L. Why does air passage over forest yield more rain? Examining the coupling between rainfall, pressure, and atmospheri c moisture content. Journal of Hydrometeorology, 15, p. 411–426, 2014. Ogden, F.L.; Crouch, T.D.; Stallard, R.F.; Hall, J.S. Effects of land cover and use on dry season river runoff, runoff efficiency, and peak storm runoff in the seasonal tropics of Central Panama. Water Resources Research, 49, p.84438462, 2013. Oliveia, P.T.S.; Nearing, M.A.;Moran, M.S.; Goodrich, D.C.; Wendland, E.; Gupta, H.V. Trends in water balance components across the Brazilian Cerrado. Water Resources Research, 50 (9): 7100-7114, 2014. Parmesan, C.; Yohe, G. A globally coherent fingerprint of climate change impacts across natural systems. Nature, v.421, p.37-42, 2003. Rezende, J.B.; Pereira, J.R.; Botelho, D.O. Expansão da cultura de eucalipto nos municípios mineiros e gestão territorial. CERNE, v.19, n.1, p.1-7, 2013. Rosoman, G. The Plantation Effect. Greenpeace New Zealand, Auckland. 48p., 1994. Shuttleworth, W. J. Evaporation from Amazonian Rainforest. Proceedings of the Royal Society of London. Series B, Biological Sciences, 233 (1272), p.321-346, 1988, Soares, J.V.; Almeida, A.C. Modeling the water balance and soil water fluxes in a fast growing Eucalyptus plantation in Brazil. Journal of Hydrology, 253, p.130-147, 2001. Sommer, A. et al. Transpiration and canopy conductance of secondary vegetation in the eastern Amazon. Agricultural and Forest Meteorology, 112, p. 103-121, 2002. Strauch, A.M., MacKenzie, R.A., Giardina, C.P., Bruland, G.L. Climate driven changes to rainfall and streamflow patterns in a model tropical island hydrological model. Journal of Hydrology, v.523, p.160-169, 2015. Timmermann, A.; Oberhuber, J.; Bacher, A.; Esch, M.; Latif, M.; Roeckner, E. Increased El Niño frequency in a climate model forced by future greenhouse warming. Nature, 308, p. 694-697, 1999. Trevisan, R.; Salemi, L.F.; Groppo, J.D.; Silva, R.W.C.; Martinelli, L.A.; Dinâmica da água em uma microbacia com cobertura florestal de eucalipto localizada na Serra do Mar no Vale do Paraíba do Sul. Revista Brasileira de Recursos Hídricos, 17 (4), p.207-216, 2012. Tundisi, J.G. Recursos Hídricos no Brasil: Problemas, Desafios e Estratégias para o Futuro. Academia Brasileira de Ciências, 92p., 2014. Vital, A.R.T.; Lima, W.P.; Camargo, F.R.A. Efeitos do corte raso de plantação de Eucalyptus sobre o balanço hídrico, a qualidade da água e as perdas de solo e de nutrientes em uma microbacia no Vale do Paraíba, SP. Scientia Forestalis, 55, p.5-16, 1999. Vourlitis, G.L.; Nogueira, J.S.; Lobo, F.A.; Pinto JR., O.B. Variations in evapotranspiration and climate for an Amazonian semi-deciduous forest over seasonal, annual, and El Niño cycles. International Journal Biometeorological, 59, p. 217–230, 2015. Zhang L.; Dawes W.R.; Walker G.R. Response of mean annual evapotranspiration to vegetation changes at catchment scale. Water Resources Research, 37, p.701-708, 2001.
43
Chapter 4. Forest Management and Water in Chile Pablo Garcia-Chevesich8,9 (
[email protected]), Rodrigo Valdes-Pineda8 (
[email protected]. edu), Roberto Pizarro10 (
[email protected]), Andrés Iroumé11 (
[email protected]), Claudia Sangüesa10 (
[email protected]), Carlos Vallejos10 (
[email protected]), Luis Gonzalez8 (
[email protected]), and Francisco Balocchi9,10 (
[email protected])
4.1 Introduction Chile is geographically known for its shape, a narrow (average 150 km) and long (more than 4,000 km) strip from latitudes 18° to 56° S, facing the Pacific Ocean to the west, the world’s driest desert in the northern Atacama Region, Mediterranean scrub and open forests at mid-latitudes, cold rainforests in the south, and Patagonian steppe in the extreme south-east. The natural limits of Chile greatly isolate it and prevent invasions from other forests in the continent. For these reasons, Chilean forests, including Mediterranean forests (32°-38°30’°S) and Temperate Rainforest (38°30’ to 56°S), can be considered as a biogeographical island (Donoso 1993, Armesto et al. 1995, Armesto et al. 1998, Feisenger, 1998, INFOR 2013, CONAF 2014). Just like most countries around the world, the majority of Chile’s territory was widely covered by forests several centuries ago. Deforestation started with pre-Hispanic populations, to continue in higher rates with the arrival of European Settlers. Thus, by the end of the twentieth century, more than 19 million hectares in Chile were deforested and under some degree of erosion and desertification. Thus, by the end of the twentieth century, more than 19 million hectares in Chile were deforested and are actually under some degree of erosion and desertification. In terms of native forest types, the most widely distributed types are listed in Table 1. However, other relevant species are Prosopis ssp. in the north and “Palma Chilena” (Jubaea chilensis) in the central parts of the country, respectively. Since late 1970s, the creation of Government incentives to plant trees triggered the expansion of man-made forests established with exotic fast growing species which are the base of the Chilean forest economy. The rapid annual growth rate on trees planted in Chile represents a competitive advantage due to a shorter rotation age, compared to the same species growing elsewhere in the world, leading to the appearance of a large forest industry in the country. Today, more than 16 million hectares of the Chilean territory are covered by either plantation (2.5 million hectares) or native (13.5 million hectares) forests (Figure 1). Forest plantations in Chile are dominated by Pinus radiata (D. Don) and Eucalyptus spp., which account for 2.3 million ha (INFOR 2013), an area increasing in average by thousands of hectares every year (CONAF 2014). The forest industry is the second largest exporting sector in Chile, being the mining industry the first. However, forestry-related industry is the main producer of renewable prime material in the country, manufacturing a wide variety of wood products, mostly from commercial pine and eucalyptus plantations. Forest industries comprise a diverse group of large, median and small companies that produce cellulose, lumber, wood panels, furniture, and construction materials, among others.
University of Chile. Faculty of Forest Sciences and Nature Conservancy. International Hydrology Research Group University of Arizona. Department of Hydrology and Atmospheric Sciences /Department of Agricultural and Biosystems Engineering 10 Universidad de Talca. Facultad de Ingeniería Forestal 11 Universidad Austral de Chile. Facultad de Ciencias Forestales y Recursos Naturales 8 9
45
Forest management and the impact on water resources: a review of 13 countries Table 1. Distribution of the main Chilean native and endemic forest species (Donoso 1981 and Society of American Foresters) Latitudinal range (S Lat.)
Precipitation range (mm/yr)
Area (x1,000 ha)
Evergreen
38°30’ - 47°
2,000 - 5,000
4,350
Lenga
36°50’ - 56°
1,000 - 3,000
3,400
Coihue de Magallanes
47° - 55°30’
2,000 - 7,500
1,801
36°30’ - 40°30’
1,500 - 3,000
1,370
40° - 54°
2,500 - 7,500
972
37° - 40°30’
1,500 - 4,000
457
32° - 38°
300-1,000
343
Alerce
39°50’ - 43°30’
2,000 - 4,000
265
Araucaria
37°40’ - 40°48’
2,000 - 4,500
254
Roble-Hualo
32°50’ - 36°50’
500 - 2,000
185
34°45’ - 44°
500 - 900
45
Forest type
Roble-Raulí-Coihue Ciprés de las Guaitecas Coihue-Raulí-Tepa Sclerophyllus
Ciprés de la Cordillera
Chile has a highly regulated water managements system, which can be improved with a better articulation and coordination among Government institutions, as well as better policies and more research. Moreover, and considering the geography of the country, the Government is currently giving more relevance to water resources management, though conflicts are advancing faster than solutions due to both climate change and an increase on water demands. Agriculture is, by far, the main water consumer in the country, followed by industries and mining (Table 2). Table 2. Consumptive water uses in Chile. Source: Adapted from McPhee et al. (2012) and Valdés-Pineda et al. 2014. Sector
Percent
Agriculture
77.8
Industrial
9.1
Mining
7.2
Municipal
5.9
Total
100
Despite the above, a clear problem in Chile is the fact that there is abundance of water in the sparsely populated south, and not enough water in the densely populated Central and Northern regions (Figure 2). For instance, the Government is currently analyzing several options to transport water from the South to areas where the resource is needed. Among the most relevant ideas are a submarine aqueduct, a subterranean aqueduct, ship marine transportation, transportation through aquifer recharge and pumping, and desalinization of seawater. Each solution has its own advantages and limitations, and each one offers different costs, life expectancies, and flow rates. While the creation of a combined system seems to be the best alternative, a logical fact is that Chile will be transporting water from the South in a decade or two, eliminating significantly the adverse effects of global warming and droughts, and supplying the increasing demands for the resource in areas of water scarcity. 46
Chapter 4. Forest Management and Water in Chile
Figure 1. Spatial distribution of forest plantations and native forests in Chile. Own work. Based on Hansen et al. 2013.
Forest expansion has dramatically changed the traditional rural landscape of agriculture on poor and degraded soils, in a period characterized by increasing water demands and dry years. Conflicts between forest plantations and water are gradually increasing in Chile. This is mostly because, Forest expansion has dramatically changed the traditional rural landscape of agriculture on historically, Chile has been a country with plenty of water, and most of its water resources poor and degraded soils, in a period characterized by increasing water demands and dry management system is based on surface water flowing from the Andes to the Pacific Ocean. Though years.plantations Conflicts are between forest plantations and water are in Chile. This forest commonly blamed for increasing lacks of gradually surface andincreasing groundwater flows during is mostly because, historically, Chile has been a country with plenty of water, and most of the last decade or so, it is still unclear whether such decreases of flowing water are due to the its water resources system is based on surface water flowing from the Andes establishment of forestmanagement plantations, climate change, increases on surface and groundwater uses, or a to the Pacific Ocean. Though forest plantations are commonly blamed for increasing lacks combination of all. of surface and groundwater flows during the last decade or so, it is still unclear whether such decreases of flowing water are due to the establishment of forest plantations, climate 4.2 Literature review change, increases on surface and groundwater uses, or a combination of all. As forest plantations in Chile have increased tremendously during the last few decades, water resources-related research began slightly on the 1980s, reaching higher numbers after 1996 (Table 3). Up the year 2012, a total of 91 undergraduate theses were published at national universities (Jofré 4.2toLiterature review et al. 2014). Furthermore, there were 67 publications on national ISI journals and scientific magazines As forest Ecología plantations in Chile have increased tremendously the lastCiencia few decades, water (Bosque, y Biología de Suelos, Turrialba, Cienciasduring Forestales, e Investigación resources-related research began slightly the 1980s,Agro reaching after 1996 Forestal, Medio Ambiente, Python, TerraonAustralis, Sur, higher Revistanumbers U. de Talca, and (Table Revista 3). Up to the year 2012, a total of 91 undergraduate theses were published at national universities Infor). In terms of international ISI journals, there were only 19 water and forestry-related (Jofré et al. 2014). Furthermore, there were 67 publications on national ISI journals and scientific publications (Hydrological Processes, Journal of Hydrology, Journal of Geophysical Research, magazines (Bosque, Ecología y Biología de Suelos, Turrialba, Ciencias Forestales, Ciencia e Forest Ecology and Management, Biogeochemistry, Revista Científica del INIA (Spain), Revista Investigación Forestal, Medio Ambiente, Python, Terra Australis, Agro Sur, Revista U. de Talca, and Ambiente y Desarrollo de CIPMA), which are listed on Table 4. Most of the above studies have been Revista Infor). In terms of international ISI journals, there were only 19 water and forestry-related developed by researches working in national universities, many times in collaboration with publications (Hydrological Processes, Journal of Hydrology, Journal of Geophysical Research, Forest international Ecology and entities. Management, Biogeochemistry, Revista Científica del INIA (Spain), Revista Ambiente y Desarrollo de CIPMA), which are listed on Table 4. Most of the above studies have been developed by researches working in national universities, many times in collaboration with international entities. 47
47
Forest management and the impact on water resources: a review of 13 countries
Figure 2. Distribution of water availability and demands (a), and groundwater management system (b) along Chile. Adopted from Valdes-Pineda et al. 2014.
According to Jofré et al. (2014), water and forestry-related research in the country can be classified
Figure into 2. Distribution of waterwater availability demandsbetween (a), andwater groundwater management system (b) alo four main categories: balanceand (relationship consumption efficiency and management activities), forest management (plantation density, species, interventions), water Adopted from Valdes-Pineda et al. 2014.
efficiency (water consumption), and other topics (modeling, forest management plans, etc.). Thus, the total number of studies focused on each of the above topics are illustrated in Figure 3. Among the According to Jofrétopics et al.related (2014), water and are forestry-related research thecovers, country can be clas main research to water balance comparison among differentin plant runoff generation, and special and temporal distribution of soil moisture. Similarly, butconsumption in lower number, into four main categories: water balance (relationship between water efficiency are studies focused on forest management, i.e. the effects of forest management activities on water management activities), forest management (plantation density, species, interventions), water resources, plant reestablishment, etc. Analysis of soil erosion processes, sediment transport, water efficiency (water consumption), and other topics forest management plans, etc.). T quality, and runoff analysis represent the minority of (modeling, the cases (other topics), followed by topics on water of efficiency, the analysis of theofeffects of forest plantations on soil moisture and the3. Among total number studiesi.e. focused on each the above topics are illustrated in Figure comparison of water efficiency among species and soil types (Jofré et al. 2014). main research topics related to water balance are comparison among different plant covers, ru
generation, and special and temporal distribution of soil moisture. Similarly, but in lower num studies focused on forest management, i.e. the effects of forest management activities on wate resources, plant reestablishment, etc. Analysis of soil erosion processes, sediment transport, w quality, and runoff analysis represent the minority of the cases (other topics), followed by top water efficiency, i.e. the analysis of the effects of forest plantations on soil moisture and the comparison of water efficiency among species and soil types (Jofré et al. 2014). 48
Chapter 4. Forest Management and Water in Chile Table 3. Number of university theses published since 1983 in Chile. Source: University of Chile’s electronic database, cited by Jofré et al. 2014. Period Number of theses Table 3. Number of university theses published since 1983 in Chile. Source: University of Chile’s electronic database, cited by Jofré et al. 2014. 1983-1990 4 Period Number6of theses 1991-1995 1983-1990 4 1996-2000 31 1991-1995 6 2001-2005 30 1996-2000 31 2006-2012 2001-2005 2006-2012 International journals
19 30 19
National journals
Undergraduate theses
Focus of the studies
Water Balance Water Efficiency Forest Management Other focuses 0
10
20
30
40
50
Number of publications
Figure of 3. water Distribution of water andpublications forestry-related publications conducted in Chile. Figure 3. Distribution and forestry-related conducted in Chile. Partially adopted from INFOR 2014. Partially adopted from INFOR 2014.
From Table 4 below, Iroumé (2001) and Huber et al. (2008) refer to results from experimental plots, a method that has been widely used to study the effects of forests in water resources in Chile. However, From Table 4 below, Iroumé (2001)etand Huberare et al. (2008) refer to results fromin experimental Iroumé et al. (2005, 2006) and Huber al. (2010) experimental watershed studies forest plots, a method that has been widely used to study the effects of forests in water resources in plantations. Similarly, Lara et al. (2009) used experimental watersheds on native forests. Also, Chile. However, Iroumé al. (2005, and Huber et al. (2010) are experimental watershed Oyarzún et al. (2006) basedettheir study 2006) on experimental watersheds to compare the hydrology of studies in forest plantations. Similarly, Lara et al. (2009) experimental watersheds on native forests with that from commercial plantations. Little et al.used (2014) used experimental watersheds native forests. Also, Oyarzún et al. (2006) based their study on experimental watersheds to determine the buffer effects of streamside native forests on areas with commercial plantation. Onto compare the Pizarro hydrology nativeLittle forests with that and fromIroumé commercial plantations. Little etonal. the other hand, et al.of(2005), et al. (2009), and Palacios (2013) focused (2014) used experimental watersheds to determine the buffer effects of streamside native large-scale river basins. forests on areas with commercial plantation. On the other hand, Pizarro et al. (2005), Little et al. (2009), Iroumé and large-scale basins. Information on and Chilean studies onPalacios water and(2013) forestsfocused have beenongenerated fromriver a large diversity of geographical areas, treatments, and research methods thus making very difficult the generalization to Information on tendencies. Chilean studies on speaking, water and forests have been generated from suggest a large generate national Generally water and forestry-related studies in Chile diversity geographical areas, andcycle research methods thus making very that forest of plantations strongly affecttreatments, the hydrologic of small watersheds, decreasing thedifficult amount the generalization to generate national tendencies. Generally speaking, water and of water available for other uses. However, most forest plantations have been established onforestryareas related Chileforests suggest forestdecades plantations strongly affect the of where oldstudies growth in native werethat replaced and even centuries ago byhydrologic grasslands cycle (the type decreasing the amount of water available for other However, most ofsmall land watersheds, use with highest runoff-generating potential), which subsequently wereuses. afforested. forest plantations have been established on areas where old growth native forests were replaced decades and even centuries ago by grasslands (the type of land use with highest runoff-generating potential), which subsequently were afforested. 49 49
Forest management and the impact on water resources: a review of 13 countries Table 4. International ISI publications from water and forestry-related studies developed in Chile. Year Authors
Journal
Title
2014 Little et al.
Ecohydrology
Buffer effects of streamside native forests on water provision in watersheds dominated by exotic forest plantations
2013
Iroumé and Journal of Palacios Hydrology
Afforestation and changes in forest composition affect runoff in large river basins with pluvial regime and Mediterranean climate, Chile
Journal of 2013 Mohr et al. Geophysical Research
Runoff generation and soil erosion processes after clear cutting
Journal of Schuller et 2013 Environmental al. Radioactivity
Using 137Cs and 210Pbex and other sediment source fingerprints to document suspended sediment sources in small forested catchments in south-central Chile
Rev. Téc. Ing. Univ. Zulia
GIS application of USLE and MUSLE to estimate erosion and suspended sediment load in experimental catchments, Valdivia, Chile
2011
Iroumé et al.
2011
Birkinshaw Hydrological et al. Processes
The effect of forest cover on peak flow and sediment discharge—an integrated field and modelling study in central–southern Chile
2010
Iroumé et al.
Bosque
Runoff and peakflows after clearcutting and the establishment of a new plantation in an experimental catchment, southern Chile
2010
Huber et al.
Bosque
Effect of Pinus radiata and Eucalyptus globulus plantations on water resource in the Coastal Range of Biobio region, Chile
2010
Schuller et Soil & Tillage al. Research
Use of beryllium 7 to study the effectiveness of woody trash barriers in reducing sediment delivery to streams after forest clearcutting
2009 Lara et al.
Forest Ecology and Management
Assessment of ecosystem services as an opportunity for the conservation and management of native forests in Chile
2009 Little et al.
Journal of Hydrology
Revealing the impact of forest exotic plantations on water yield in large scale watersheds in South-Central Chile
2009
Walling et al.
Water Resources Research
Extending the timescale for using beryllium 7 measurements to document soil redistribution by erosion
2008
Huber et al.
Hydrological Processes
Effect of Pinus radiata plantations on water balance in Chile
2006
Iroumé et al.
Hydrological Processes
Runoff and peak flow responses to timber harvest and forest age in southern Chile
2006
Pizarro et al.
Journal of Hydrology
The effects of changes in vegetative cover on river flows in the Purapel river basin
2005
Iroumé et al.
Journal of Hydrology
Summer flows in experimental catchments with different forest covers, Chile
2005
Oyarzún et al.
Revista Ambiente Los servicios ecosistémicos del bosque templado lluvioso: y Desarrollo de producción de agua y su valoración económica CIPMA
2002
Iroumé and Hydrological Huber Processes
2001
Huber and Iroumé
Journal of Hydrology
Variability of annual rainfall partitioning for different sites and forest covers in Chile
1995
Oyarzún and Peña
Hydrological Processes
Soil erosion and overland flow in forested areas with pine plantations at coastal mountain range, central Chile
50
Comparison of interception losses in a broadleaved native forest and a Pseudotsuga menziesii plantation in the Andes Mountains of southern Chile
Chapter 4. Forest Management and Water in Chile
Despite the above, a recent study by some of the authors of this Chapter (leaded by Roberto Pizarro), among other scientists, suggests that forest plantations in Chile do not significantly affect water quantity on large watersheds (Lignum 2015). This revolutionary result disagrees with most of the international research on water and forest plantations, because most studies suggest that forest plantations consume large amounts of water. However, most studies worldwide have been done in areas where precipitation falls during summer, among other seasons, but summer rains is a common denominator. Central Chile’s precipitation occurs only during winter months, when trees are dormant. As a result, rainfall infiltrates into the soil horizons, recharging water tables. Despite the above, knowledge of water resources and forestry interactions is still not well known in Chile, which is a problem that needs to be addressed, based on current tendencies on water consumption, as well as climate change effects in the country. Furthermore, the country’s forestry-related organizations should incorporate BMP’s into their management system, to minimize water consumption from forest plantations. Additionally, the above paragraph is somehow supported by Pizarro et al. (2005) and Little et al. (2009), who documented no significant hydrological changes after forest conversion. Similarly, Iroume and Palacios (2013) documented no significant runoff changes after increasing the area occupied by forest plantations by 15% or less.
4.3 Politics As previously mentioned, Chile is a country in which severe deforestation took place since mid XIX’s century, mostly to habilitate land for agriculture. Such practice was maintained until early XX century, when the “Ley de Bosques” (Forests Law) was created, leading to incentives for the reforestation of thousands of hectares of degraded land along the country. Years later (1974), the DL702 law was created to increase even more the incentives for planting degraded areas, through which the Government reimbursed Between the 75 and 95% of the afforestation costs, providing also work to low-income people, in areas that were previously unproductive and degraded. Thus, more than two million hectares were planted after 1974. Despite the above, there was no relevant laws or regulations focused on mitigating the impacts of forest practices on water resources, even though between 1990 and 2002 there was a 160% increase on water demands from different productive sectors. However, water issues are now incorporated in Forest Certification protocols and environmental priorities in Chile, leading to a series of new forest management approaches. Other than certain restrictions to plant near watercourses or limiting annual harvested areas, there are no laws or regulations focused on the effects of forestry on water resources in Chile. The main reason for this lack of regulations is the fact that there have not been enough studies to know well the effects of forestry on water resources, combined with the fact that Chile is a country with watersheds that fall 5,000 m in elevation on distances shorter than 200 km, with different precipitation regimes, and with strong influences from important mountain ranges. In conclusion, it is strictly necessary to create an applied research policy, to understand the behavior of forest ecosystems and to determine where and how forest activities affect the hydrologic cycle of Chilean watersheds.
4.4 Climate change and the future of forestry & forest research Climate change is a growing concern in Chile, mostly because its effects are represented by the concentration of annual precipitation in fewer and more intense storm events, accompanied by more droughts, more wildfires, and more floods during storms (Valdes-Pineda et al. 2014, Pizarro et al. 2012). As a country used to have enough water for all its needs, the above changes on precipitation behavior has caused tremendous damages in all sectors during the last decades, being the last ten years the worse by far. Every year more trees are planted to become commercial plantations, 51
Forest management and the impact on water resources: a review of 13 countries
leading to more conflicts between forestry and other areas (mostly agriculture), resulting on endless discussions in which each sector blames the opposite, or climate change. Also, there are currently millions of hectares occupied by bare, degraded soils in Chile, and forestry should play a role in recovering such surface to transform them into productive land again. For the above reasons, the future of forest research is based on several challenges: • Genetic management to establish trees that are less water demanding, with adaptations to droughts while maintaining fast growing rates. • Rainwater harvesting practices (e.g. infiltration trenches) to take advantage of the fewer, but intense, storm events resulting from climate change. • Effects of forest management practices on the quantity and quality of water resources, but most importantly, how forests and forest plantations interact with the hydrologic cycle in Chile, and how other areas contribute to current and future water shortages. • BMPs in forestry, to minimize water consumption from a forest plantation in a given watershed. • More research is necessary in the field of ecohydrology, for a better understanding of the role of forests in surface flows and groundwater recharge processes. • Reforestation programs should be implemented in the country to recover the large amount of hectares that are currently degraded
4.5 Acknowledgments The authors thank the International Hydrology Research Group (University of Chile, Faculty of Forest Sciences and Nature Conservancy), the Technological Center of Environmental Hydrology (University of Talca), the University of Arizona’s Department of Hydrology and Atmospheric Sciences, the Austral University of Chile, and the Forest Institute of Chile (INFOR) for their valuable contributions to this Chapter.
4.6 References Armesto, J.J., Lobos, P.L and M.K. Arroyo, M.K. 1995. Los bosques templados del sur de Chile y Argentina: una isla biogeográfica. In Ecología de los bosques nativos de Chile. Eds. J.J. Armesto, C. Villagrán and M. K. Arroyo. Santiago, Chile: Ed. Universitaria, 1995. pp. 23-28. Armesto, J.J., Rozzi, R., Smith-Ramirez, C., and Arroyo, M.K. 1998. Conservation targets in South American Temperate Forests. Science. 282: 1271-1272. Donoso, C. 1981. Tipos forestales de los bosques nativos de Chile. Documento de trabajo No 38. Investigación y Desarrollo Forestal (CONAF/PNUD-FAO) (Publicación FAO Chile). Feisenger, P. 1996. Biodiversity knowledge in Chile. Trends in Ecology and Evolution. Trends in Ecology and Evolution. 11(11): 451-452. Hansen, M. C., P. V. Potapov, R. Moore, M. Hancher, S. A. Turubanova, A. Tyukavina, D. Thau, S. V. Stehman, S. J. Goetz, T. R. Loveland, A. Kommareddy, A. Egorov, L. Chini, C. O. Justice, and J. R. G. Townshend. 2013. HighResolution Global Maps of 21st-Century Forest Cover Change. Science 342 (15 November): 850-853. Huber, A., Iroumé, A., Mohr, C., Frêne, C. 2010. Effect of Pinus radiata and Eucalyptus globulus plantations on water resource in the Coastal Range of Biobio region, Chile. Bosque 31 (3): 219-230.
52
Chapter 4. Forest Management and Water in Chile INFOR. 2013. Anuario Forestal 2013. Boletín Estadístico N 140. Instituto Forestal, Ministerio de Agricultura. Santiago, Chile. Iroumé, A., Carey, P., Bronstert, A., Huber, A., Palacios, H. 2011. GIS application of USLE and MUSLE to estimate erosion and suspended sediment load in experimental catchments, Valdivia, Chile. Rev. Téc. Ing. Univ. Zulia, 34 (2): 119-128. Iroumé, A., Palacios, H., Bathurst, J., Huber, A. 2010. Runoff and peakflows after clearcutting and the establishment of a new plantation in an experimental catchment, southern Chile. Bosque 31 (2): 117-128. Iroumé, A., Huber, A. 2002. Comparison of interception losses in a broadleaved native forest and a Pseudotsuga menziesii plantation in the Andes Mountains of southern Chile. Hydrological Processes 16, 2347-2361. Lignum. 2015. Las plantaciones forestales no producirían menor cantidad de agua en cuencas forestadas. Available at http://www.lignum.cl/2015/04/23/plantaciones-forestales-producirian-menor-cantidad-de-agua-en-cuencashidrografica/ Pizarro, R. R. Valdes, P. Garcia-Chevesich, C. Vallejos, C. Sanguesa, C. Morales, F. Balocchi, A. Abarza, and R. Fuentes. 2012. Latitudinal analysis of rainfall intensity and mean annual precipitation in Chile. Chilean Journal of Agricultural Research 72(2): 252-271. Schuller, P., Walling, D.E., Iroumé, A., Quilodrán, C., Castillo, A., Navas, A. 2013. Using 137Cs and 210Pbex and other sediment source fingerprints to document suspended sediment sources in small forested catchments in southcentral Chile. Journal of Environmental Radioactivity 124: 147-159. Schuller, P., Walling, D.E., Iroumé, A., Castillo, A. 2010. Use of beryllium 7 to study the effectiveness of woody trash barriers in reducing sediment delivery to streams after forest clearcutting. Soil & Tillage Research 110: 143-153. Valdés, R., Pizarro, R., Garcia-Chevesich, P., Valdés, J.B., Pérez, F., Olivares, C., Vera, M., Balocchi, F., Vallejos, C., Fuentes, R., and Abarza, A. 2014. Water Governance in Chile: Availability, Management, and Climate Change. Journal of Hydrology 519(C): 2538-2567. Walling, D.E., Schuller, P., Zhang, Y., Iroumé, A. 2009. Extending the timescale for using beryllium 7 measurements to document soil redistribution by erosion. Water Resources Research 45, W02418, doi:10.1029/2008WR007143. Zamorano-Elgueta, C., Benayas, J. M. R., Cayuela, L., Hantson, S., & Armenteras, D. (2015). Native forest replacement by exotic plantations in southern Chile (1985–2011) and partial compensation by natural regeneration. Forest Ecology and Management 345: 10-20.
53
Chapter 5. Forest Management and Water in China Shirong Liu12 (
[email protected]), Yong Lin13, Hui Wang12, Yujing Yang12, Ning Liu14, and Mingfang Zhang15
5.1 Introduction With various climatic and topographic conditions, China covers a large geographic territory and owns diversified forest ecosystems ranging from boreal forests in the north to tropical rain forests in the south. Along with the large spatial variation of bio-climate, the distinctive characteristics of topography and landforms, such as the Loess and the Himalaya Plateau, provide China unique forest landscape pattern and processes. Due to periodic historical wars, population growth and over-exploration of forest resources, forest cover in China has greatly reduced. Estimating from ancient records, the forest cover in Chinese Xia dynasty (about 4000 years ago) was about 60%, in contrast with that 33% in the late Tang dynasty (around year 800 to 900). In the early Qing dynasty, forest cover in China was estimated at only 21%, which further decreased to 12.5% in around 1949 (Fan and Li, 2005). Both the quantity and the quality of forest resources in China sharply decreased during the collectivization period (1958 to 1982), notably during the Great Leap Forward and the Cultural Revolution. This deforestation trend was even further exacerbated at the beginning of the 1980s, during the economic transition from a planned system to a market economy as a result of economic development impulse. In particular, insecure ownership rights over trees or forests granted to rural households have led to massive forest clearings by the contracting farmers (Démurger et al., 2009). Nowadays, the forests in China are mainly distributed in the regions of northeast, southwest and south China. Since the founding of the People’s Republic of China in 1949, forestry practices have gone through significant changes in management objectives over different periods, which can be distinguished by their effects on forest resources: damage, development and rehabilitation. Three distinct periods are recognized. Phase 1 (from the 1950s to the end of 1970s) was characterized by timber utilization, resulting in deforestation. Phase 2 (from the end of the 1970s to the late 1990s) placed equal emphasis on both timber production and ecological improvement. Phase 3 (from the late 1990s to the present) adopts sustainable forest management strategies with the high priority on natural forest protection and ecological restoration (Liu et al., 2010). To improve environmental quality, China has implemented several large-scale forestation and afforestation programs that contribute to the increased forest cover from 16.0% in the 1980s to 21.63% in 2013. The earliest program is the Three-North Forest Shelterbelt Program. It was mainly designed to combat desertification and dust storms, and to improve hydro-climate conditions by increasing forest cover in arid and semiarid areas from 5% in the 1980s to 15% by 2050. Following the severe flood in 1998 in the Yangtze River Basin, the Natural Forest Protection Program (NFPP) was initiated in late 1998 along the upper reaches of the Yangtze River and the upper and middle reaches of the Yellow River. In addition, ‘‘Sloping Land Conversion Program’’ or ‘‘Grain for Green’’ was launched across China in 1999 to convert farmland on the slopes above 25 degree to forests for halting water and soil erosion through increasing forest cover (Liu et al., 2010). The implementation of the above three large-scale forest restoration programs has generated a significant growth in forest resources. Up to now, the total forest area in China is 208 million ha with a forest cover of 21.63%. The area of planted forests in China is approximately 69 million ha, which accounts for
Institute of Forest Ecology, Environment and Protection, Chinese Academy of Forestry, Beijing 100091, PR. China. National Marine Environmental Monitoring Center, State Oceanic Administration, Dalian, 116023, PR. China 14 School of Veterinary and Life Sciences, Murdoch University, 90 South Street, Murdoch, WA 6150 Australia. 15 School of Resources and Environment, University of Electronic Science and Technology of China, Chengdu, China 611731 12 13
55
Forest management and the impact on water resources: a review of 13 countries
one fourth of the world’s total forested area (Wang et al., 2011a). Large-scale forestation in China is supposed to provide an opportunity for the study of large-scale forestation hydrology. Forests play an important role in environmental rehabilitation, biodiversity conservation, carbon sequestration, bio-fuel, and timber production, and also offer numbers of amenities and social benefits (Calder, 2007). However, under some circumstances forests cannot simultaneously produce equal and positive multiple ecosystem services because of the trade-offs among different or competing functions (Wang et al., 2011a). As comparing to environmental issues including sandstorm, desertification, soil erosion, and drought and flood disasters, water quality degradation and water resources shortage are considered as the two major challenges of highly water relevance. In China, forests are believed to be an important instrument for mitigating and solving environmental problems. Therefore, largescale forestation and afforestation campaigns have been widely conducted for years across China. Nevertheless, the negative impacts resulting from these activities including water yields reduction in semi-arid and arid regions and hydrological regime shift (too- little-too-much-water syndrome) in humid regions have been increasingly concerned by Chinese ecologists and hydrologists (Sun et al., 2008). In the meantime, in the context of global climate change, the question of how to shape forest management to mitigate the likely impacts of climate change on forests, water and forest-water relationship for ensuring national or regional sustainable development is of great concern. Due to the vast land area and various bio-climatic conditions in China, the forest and water related issues are region and forest specific. In southern China, flood disasters, wetland degradation and loss, water pollution (eutrophication) and subsequent biodiversity loss are the key concerns, whereas water shortage and soil erosion are the main problems in northern China. There were several early reviews on the relationships between water and forest in China (Zhang and Yu, 1988; Liu et al., 1996; Li et al., 2001; Zhang et al., 2003; Zhang et al., 2004b; Wei et al., 2008). However, it is essential to update the recent Chinese research development of forest hydrology. Currently, researchers are focusing on large-scale watershed hydrology, reforestation hydrology and global change hydrology. Hydrological effects of forest management, such as reforestation and deforestation in association with land use and land cover change, are increasingly addressed. Understanding the effects of land use and land cover change on water yield and hydrologic processes, including groundwater recharge or surface runoff, are of significance to the development of sustainable land use planning and integrated watershed management. Therefore, in order to sustainably manage the forest-water relationships under a changing environment in China, this paper reviews the recent Chinese advances in forest-water research, and discusses the future research perspectives of forest eco-hydrology.
5.2 Literature review 5.2.1 An overview of global forest-water research For centuries popular opinion on forest and water relation has been forests generate rainfall and increase flows from springs and rivers (Andreassian, 2004). The majority of the studies on forest and water relationship concluded that forests use more water and produce less surface runoff, groundwater recharge and streamflow than shallow rooted forms of vegetation, such as crops, pastures, grasslands or shrub lands. The hydrological response resulting from forest cover change depends on vegetation types and climatic regime. According to Bosch and Hewlett (1982), deciduous hardwoods produced a 25 mm change in water yield per 10% forest cover change, while bush and grassland generated about 10 mm difference. Also, streamflow could not be detected when forest cover change is less than 20%. Streamflow response to deforestation or afforestation depends both on the regional background precipitation and the current annual precipitation. Normally water yield change is greatest in high rainfall areas and less pronounced in low rainfall areas with more persistency due to the slow regrowth of vegetation. Decreases in water yield following afforestation seem to be proportional to the growing rate of the stand, while gains in water yields after clear cut attenuate in proportion to the rate of the vegetation recovery (Fohrer et al., 2005). It is worth pointing 56
Chapter 5. Forest Management and Water in China
out that most studies were conducted at small paired-watershed or small watershed scale, while the large scale watershed (e.g., >1,000 km2) hydrology studies have been few (Wei et al., 2005; Sun et al., 2006). Even though few large-scale watershed studies were conducted due mainly to the difficulties in locating the similar paired watersheds as a control, there are inconsistent results for large-scale watersheds (Lin and Wei, 2008). For example, Costa et al. (2003) found that the annual mean discharge was significantly enhanced after 19% of the forest land was transformed into cropland and pasture use in an upstream basin of the Tocantins River (175,360 km2 in area). Significantly increased mean and peak flows over annual and spring periods was indicated after forest harvesting in another large-scale forested watershed study conducted in Central British Columbia (Lin and Wei, 2008). In contrast, some studies found limited or no hydrological responses (Dyhr-Nielsen, 1986; Buttle and Metcalfe, 2000; Wilk et al., 2001; Lin and Wei, 2008). The difficulty of extrapolating the results from different spatial scales, together with existing inconsistent results, and especially significant lack of large-scale watershed studies clearly highlight a critical need to assess the forest and water relationships at large spatial scales. Such a need is further exemplified in the demand for more information on forest hydrological responses and adaptive watershed management under global climate change and large-scale forest disturbances. Three ways, namely: paired watershed, single watershed and simulation models, are widely used to quantify the impact of forest or other vegetation cover change in the hydrologic cycle (Fohrer et al., 2005). In a paired catchment experiment, land use is held constant on the control catchment and changed in the treatment catchment. Differences in hydrologic response with respect to annual runoff, flood, and low flow response and water quality can be then compared with each other under the same climatic conditions. In single-catchment experiments, the effects of land use change are measured by comparing the change in hydrological responses before and after the land use change, but this cannot separate the effect of land use change from the effects of different weather conditions before and after the change. Among the third method, the process based hydrological models, composed of rainfall, canopy interception, soil infiltration and runoff processes are very useful for understanding the mechanisms underlying the hydrological responses by analyzing causal-result relationships. However, the simulation results from the hydrological models are largely a reflection of the assumptions involved and the model structure deliberated. Traditionally, hydrological models are the main tools to study the forest and water relationship. However, the uncoupling of vegetation dynamics, climate change and hydrological processes in hydrological models cannot distinguish the hydrological responses of land use change from that of climate change. Eco-hydrological models through coupling the interactions of climate change, hydrological processes and ecological processes and linking various land use/ cover components, such as upland, riparian, and aquatic ecosystems at multi-temporal and spatial scales, can sort out the different hydrological effects from climate change, land use/cover change, and watershed management impacts.
5.2.2 Forest-water research in China 5.2.2.1 Forest hydrology research methods and technologies Because there was no real paired watersheds study (Wei et al., 2008), hydrological and ecohydrological models are widely used in forest and water research at watershed scale in China (Liu et al., 2001; Zhang et al; 2006; Zhang et al., 2008; Deng, 2012; Guo and Su, 2014; Peng et al., 2014). For instance, Deng (2012) applied SSiB4T/TRIFFID model to project the impacts of temperature changes on forest hydrological effects in the mountain region of Southwestern China at basin scale. Other eco-hydrological models including CHARM (Climate and Human Activities-Sensitive Runoff Model) and SWAT model were used to distinguish the effects of climate change and land use change on runoff in Suomo watershed of upper Yangtze River (Chen et al., 2005) and in Shiyang River watershed of northwestern China (Guo and Su, 2014). Recently, Peng et al. (2014) developed a distributed eco-hydrological model by coupling a vegetation ecosystem model (BIOME-BGC) with
57
Forest management and the impact on water resources: a review of 13 countries
a distributed hydrological model (WEP-L) to study the eco-hydrological effects of soil and water conservancy measures in Jinghe River basin, Loess Plateau. Single watershed approach based on statistical analysis is also widely applied (Xu and Niu, 2000; Zhang et al., 2004a; Li et al., 2007; Zhang et al., 2009; Wei et al., 2010; Wang et al., 2011b). For instance, Wang et al. (2011a) made a comparative analysis of the annual runoff and evapotranspiration (ET) between forestlands and non-forestland among the 57 selected basins in the Loess Plateau of China whereas Wang et al.(2011b) gave a literature-review on forest cover and water yield relationships in northern China using statistical approach. Single watershed approach is mainly based on water balance model with the assumption of no change in soil water and groundwater storage at an annual basis and catchment scale, and thus, runoff can be estimated from the difference between precipitation and ET. Thanks to the rapid development of long-term ecological research sites in recent three decades, forest and water research at plot or small catchment scale has been booming in China. Base on the long term monitoring data, the major hydrological variables such as canopy interception, soil and canopy evapotranspiration, soil infiltration and storage, and root and soil interactions were quantified and compared among different types of forests (Liu et al., 1996, 2003; Wei et al., 2005). Such basic hydrological studies provide useful information for hydrological modeling in China (Wei et al., 2005). Moreover, sap flow (Zhang et al., 1997; Lu et al., 2004; Du et al., 2011; Yu et al, 2014), atmospheric water flux (Yu et al., 2006) and isotope technologies (Gu, 1995; Liu et al., 2006 and 2007; Cui et al., 2009; Xu et al., 2006; Xu et al., 2011) are increasingly measured or used in many forest ecosystems across China recently. In China, hydrologists have made efforts to partition the relative contributions of climate change/ variability and forest cover change to hydrological responses. For instance, Zhang et al. (2012) used the modified Double Cumulative Curve Analysis Method to separate the effects of forest harvesting and climatic variability on runoff in a large watershed of Upper Minjiang River. To separate the hydrological consequences of forest cover change from those of climatic changes, physical and distributed eco-hydrological models are very useful, such as the mentioned models CHARM and SWAT. However, it has been recognized that the complex relationship of forest-water restricts a wide application of models, and it has to compromise the simulation accuracy and reliable results when hydrological models are used.
5.2.2.2 Forest hydrology research progress Water yield The effects of forestation on water yield across China varied due to large variations in climate, vegetation and soil condition (Sun et al., 2006; Wei et al., 2008; Wang et al., 2011a). The majority of studies have shown that forestation decreases runoff (Huang et al., 2003; Wang et al., 2011b). The annual water yield loss from afforestation in the Loess Plateau was about 50% (equivalent to 50 mm per year) (Sun et al., 2006). Forest harvesting increased annual water yield, but the magnitude of the increase depended on various factors such as forest types, watershed characteristics, and dominant hydrological processes (snow vs. rain) (Wei et al., 2008). In contrast, some studies reported that annual discharge is negatively related to forest cover. Earlier studies found much smaller base flow in the catchments after logging primitive old growth forests in west Sichuan area, southwest of China than in intact catchments, suggesting that streamflow response of natural old-growth forest is positively related to forest cover (Ma, 1987). However, a recent study pointed out that this conclusion was not based on real paired watershed comparison, and did not consider the hydrological recovering process resulting from vegetation change from a low ET of old-growth fir forest into a high ET of fast-growing shrubs after logging (Zhang et al., 2011). The conversion from the early succession staged grassland on clear-cut site after logging old growth forests to the dense and fast-growing bushes with a higher ET is the cause of annual discharge 58
Chapter 5. Forest Management and Water in China
reduction. Another reason was perhaps related to fog interception by forests in mountainous areas at a high elevation where fogs intercepted by forest canopy constitute a significant portion of total precipitation (Wei et al., 2008). There has been a controversy over the relationship between forest vegetation cover and streamflow in China, with a significant positive relationship (Cao, 1991; Wang et al., 2011a) and no significant effect (Qian, 1983; Zhou et al., 2010; Wang et al., 2011b). It should be pointed out that the controversy is associated with statistical analysis that does not account for other human disturbances such as water withdrawal and engineering interference (Cao, 1991), and with no calibration and the control as a comparable unlogged area (Wei et al., 2008), and thus, leading to the question on the validity of some above mentioned results. It is well known that forests can mitigate flood regime. Such understanding has been demonstrated by numerous experiments at small catchment scale at home and abroad. However, there are many factors would affect the interaction between forest and flood, including anticipant soil water content, soil depth and infiltration, underlying bed-rock properties, water holding capacity in litter layer, intensity and duration of rainfall, forest spatial distribution, and the size of watershed. In the upper Yangtze River, the effect of forests on flood mitigation decreases with the increasing basin size, while forest vegetation loss was not the main reason for the severe flood in 1998 (Xu, 2000). When rainfall intensity is greater than 0.25 mm/min or rainfall amount is larger than 20 mm, forest capacity in intercepting rainfall will be very limited, and this was demonstrated by some experiments in Sichuan province, Southwest China (Xu, 2000). Forest spatial distribution in the upper Yangtze River was not found to be positively related to flood mitigation, because natural forests with deep soil layer and thick litter layer mainly distributed in the areas without storm and heavy rain, whereas storm and heavy rain drop in areas where the vegetation is mainly composed of plantations with shallow soil layer. At the small catchment scale, forests will affect significantly on flood mitigation, but the mitigating effects will attenuate when the severe or heavy flood events occur. This is also true in a large catchment. Meanwhile, forest management activities such as road construction and ditch drainage, through increasing the effective density of the stream network, might cause local flooding (Calder, 2007). In China, there are few studies on the impacts of forests on low flow and the effects of forest harvesting on low flows varied with climate and forests. Of which some studies reported reductions in low flows after logging (Ma, 1987), and the others show increases in low flows (Zhou et al., 2010; Xu, 2000).
Water quality Forests play an important role in improving water quality through reducing erosion, since rainfall is intercepted by canopy and litter layers and other biogeochemical cycling processes (Vose et al., 2011). Although water pollution has become global concern with a high priority, water quality relative to water yield has not been paid an equal attention in the field of forest hydrology research in China. Spatial distribution of forests is supposed to have an important effect on hydrological processes at landscape scale, but it had been neglected in small catchment studies before 2000s. Nearly all early studies on forest landscape hydrology applied a simply and non-spatial dimension parameter of forest cover to characterize the relationship between forest and water at large watershed. In fact, few previous studies aimed clearly at exanimating the effects of land use/cover change on hydrological processes at large watershed by recognizing landscape heterogeneity (Liu et al., 2008). More recently, however, numerous case studies are made relating water quality to watershed landscape pattern using statistical analysis to quantify the relationship between water quality parameters and landscape pattern metrics (Xiao et al., 2007; Ouyang et al., 2008; Yang et al., 2012; Shen et al., 2014). A monograph review titled “Forest landscape patterns and LUCC on ecohydrological response” (Yu et al., 2010) well illustrated research progress over the last 10 years. These researches helped to understand the effects of forest landscape pattern on water quality (Fu et al., 2002; Suo et al., 2005; Xia et al., 2012). Traditional landscape metrics give little consideration of ecological processes and then fail to establish the relationship between landscape pattern and processes. To better understand how landscape pattern affects ecological and hydrological processes, some new 59
Forest management and the impact on water resources: a review of 13 countries
parameters such as landscape spatial loading contrast coefficient, contour based connectivity and directional infiltration parameter are proposed to characterize the relationship between landscape pattern and water quality in China (Chen et al., 2006).
5.3 Politics Before 1970s, China’s forestry focused on timber production with over-exploitation of forest resources, leading to great loss and degradation of natural forests. Consequently, many severe environmental problems, such as soil and water erosion, biodiversity decline, and catastrophic drought and floods, occur frequently across China (Zhang et al., 2000). For tackling these ecoenvironmental consequences, Chinese government adopts new forestry development strategies by changing a focus from timber production into forest protection and ecological restoration. In 2003, China released the Resolution on Accelerating Forestry Development, which clearly defined the national forestry development strategy with a high priority on ecological improvement, ecological security and ecological culture, ushering multi-purpose forestry development towards ecosystem services. Over the past 30 years, forestry development in China has experienced unprecedentedly rapid and extensive changes more than in any comparable period of time in human history. The most remarkable achievement in China is the successful implementations of the five large scale afforestation and reforestation programs aiming at meeting rapidly growing societal demands for ecological amelioration and timber production (Liu et al., 2014). The five large-scale forestry programs include the Natural Forest Protection Program (NFPP), the Conversion of Cropland to Forest Program (CCFP), the Sandstorm Control Program for Areas in the Vicinity of Beijing and Tianjin (SCP), the Key Shelterbelt Development Programs (SDP), the Wildlife Conservation and Nature Reserves Development Program, and the Forest Industrial Base Development Program (FIBDP). These programs are designed mainly for restoring degraded forests, conserving biodiversity, and expanding forest cover, especially in ecologically sensitive areas, such as Yangtze River and Yellow River in western China (Liu et al., 2014). Although these forestry programs aim primarily at tackling the various environmental problems, the actual and potential commercial demand for timber production have been implied in the implementation of reforestation campaigns by local communities. Forest land tenure reform is another mile-stone forestry policy in China, which has generated tremendous impetus to develop the fast-growing and high-yielding plantation in a large scale. Both government initiated reforestation programs and forest land tenure reform have resulted in a rapid development of planted forests throughout China, and the majority of planted forests are monoculture composed of only a few commercial tree species. The impacts of large-scale reforestation have been increasingly concerned in China, particularly in the arid or semi-arid areas (Li et al., 2001; Sun et al., 2006; Wang et al., 2008; Zhang et al., 2009). Hydrological functions vary with tree species and forest types, and show dynamics over time with forest growth and ecological succession. In fact, tree species differ considerably in the amount of annual and seasonal water use via transpiration and interception (Sun et al., 2011), which suggest that species selection and reforestation spatial planning are of great significance to alleviate the negative impacts of large scale afforestation and reforestation on regional water balance. There are many studies on water use of different tree species by measuring sap flow (Du et al., 2011) and water use efficiency (WUE) of different types of forests (Yu et al., 2008; Zhu et al., 2015), which are helpful for tree species selection, regional reforestation planning and eco-hydrological assessment (Peng et al., 2014). Stand density is an important factor influencing canopy interception, water use by evapotranspiration, therefore optimal stand density needs to be precisely defined in afforestation design and stand management for matching water availability in a particular area. Soil water conditions and water use of tree species can be used to determine appropriate stand density of planted forests in Loess Plateau, northwestern China (Yu et al., 2010).
60
Chapter 5. Forest Management and Water in China
Healthy forested watersheds efficiently trap and filter suspended sediments while exposed soil surfaces on the forest floor are susceptible to splash displacement, surface runoff, and erosion (Vose et al., 2011). Optimal upland forest management is of importance to the maintenance of structure and function of downstream aquatic and wetland ecosystems, and the spatial linkage or connection between upland catchment and downstream aquatic ecosystems has been paid a great attention by Chinese forest hydrologists and ecologists (Liu et al., 2010). The worldwide water shortage crises and exacerbating climate change highlight the importance of water resource issues in watershed management. Due to the complexity of geo-spatial variations and social-economic diversity, there is no single answer to tackle water resource issues, and the solution should be watershed or region specific. This is particularly true for understanding and solving water issues in China. Ecosystem services of forests and ecological restoration through afforestation and reforestation at local or regional scale should be managed and approached based on the relationship between forest and water at different scales. In fact, the forest and water relationship varies regionally. Therefore, spatial variations in soil, climate, vegetation and hydrological regime need to be incorporated in reforestation efforts. In humid areas where is rich in water resources, the degradation of water quality, loss of aquatic biodiversity and flood disaster are the key issues among other water related environmental problems. Meanwhile, reforestation efforts would not confront with water shortage, and thus, theoretically reforestation scale is relatively larger in order to maximize ecosystem services of planted forests. In semi-arid and arid regions where suffers water shortage, however, reforestation effort will be greatly limited by availability of water resource, and adverse impacts of large scale reforestation on water yield and consequently regional water balance and water security should be avoided. For balancing the trade-offs of various ecosystem services provided by planted forests, spatially explicit map should be developed for directing reforestation regionalization planning at different scales, including watershed and geographical region. The reforestation planning provides a technical support in determining appropriate size and optimal spatial pattern of reforestation efforts across landscape without compromising the detriment to water resource and the conflict of water use among various land uses. This was exemplified by the Institute of Soil and Water Conservation (ISWC), Chinese Academy of Sciences (CAS) that the spatial suitability of 38 predominately native species in coarse sandy hilly catchments at Loess plateau was mapped at a 100 m resolution using a five-variable (namely: land use/land cover, precipitation, aspect, land position and slope) spatial overlay approach. The spatial context or landscape configure should be also taken into consideration by prioritizing re-vegetation target areas to the zones adjacent to and down slope along the steep landscape, in order to reduce sediment input to the river network and adverse impact on regional stream flow. A very good decision support tool named ReVegIH (Re-Vegetation Impacts on Hydrology) can help land managers to determine afforestation area, spatial pattern and plant species (McVicar, et al., 2007). Forest management in the context of global change is more complex and cannot be approached only at stand level and within forestry sector. Instead, forest management should be implemented at a landscape level and across multi-sectors (Liu et al., 2010). Forest landscape management approach recognizes the interrelationships among land uses, sustainability of landscape resources in terms of desired goods and services, and diversified adaptive options for different stakeholders to cope with global change and land use conflicts (Yu et al., 2014). Sustainable forest management (SFM), which is guided by explicit goals, executed by policies and protocols, and monitored as well as assessed by defined indicators and standards, has been widely advocated, and has been mainstreamed in the national forestry development planning (Liu et al., 2014). The Chinese forest ecosystem monitoring network covering different geographical regions provides a useful instrument for the monitoring and assessment of forest management performance and implication.
61
Forest management and the impact on water resources: a review of 13 countries
5.4 Climate change and the future of forestry & forest research Interactive effects of forest, water and soils on hydrology Like forest canopy and litter, soils play a significant role in regulating hydrological processes. Actually, forest, water and soil interacts each other in a consolidated way to sustain ecosystem processes and functions. To this end, structure and function of forest soils are largely dependent on root system, soil microbes, soil physical properties and litters, which are further affected by aboveground canopy processes. There exist differences in hydrological functions between natural forests and planted forests, and monoculture and mixed stands, which are the result of different soil biological processes and physical properties in the forests. Thus, there is a need to study the interactive effects of forests, water and soils for deepening insight into the hydrological mechanisms of different forest ecosystems and under various water and soil regimes.
Hydrological impacts of large-scale reforestation and afforestation As China has the largest scale reforestation and afforestation in the world, it provides a good opportunity to study effects of large-scale plantation forests on regional water resources and hydrological cycling, especially in arid and semi-arid areas with water-shortage. The general conclusion seems that forest removal or harvesting increases streamflow, whereas reforestation causes water yield reduction, but there have been great uncertainties or variations in hydrological responses to forest changes among different case studies and geographical regions in China. This implies a complicated interaction among forest, water, soil and climate, which is especially exemplified in China with diversified climate, vegetation, soil and topography. Therefore, understanding the ecological effects of largescale reforestation in China is of significance to develop theory and methodology of large scale ecohydrology, and contributes to developing forestry mitigation and adaption strategy to global climate change.
Development of spatial explicit and process-based eco-hydrology models Forest change or land use/cover change and climate change along with other factors interactively affect regional hydrological processes and water resource, leading to the difficulty in distinguishing one kind of hydrological response from another. Despite some methods like statistical analysis can be used to separate hydrological impacts from some influencing factors, they are strictly limited in understanding the mechanism underlying hydrological responses. In this regard, there is a clear need to develop process based eco-hydrological models as an effective tool for assessing forestwater relationship under a changing environment. Long-term forest ecosystem monitoring research, hydrological measurements across scales from small catchment or plot scale to large watershed, and geo-spatial monitoring, are all available now for providing a full dataset needed to develop and validate process-based eco-hydrological models for separating, assessing and forecasting hydrological responses resulting from climate change and land use/cover changes.
Application of forest-water research to forest management Although a great achievement in forest-water research has been made in China, little research knowledge is transferred into forestry policy-making and applied in forest management practices. In many regions, forest managers have still been applying conventional forestry concepts and methods to direct afforestation and reforestation efforts. Water use or water requirement of specific tree species, site condition differences in soil water and rainfall availability, and the likely impacts of climate change have not precisely incorporated into afforestation/reforestation planning in terms of planting area regionalization, planting scale, tree species selection and site classification. The determination of afforestation sites, reforestation scale and stand density should take into consideration of regional 62
Chapter 5. Forest Management and Water in China
water resource use and balance, and forest landscape pattern optimization for mitigating adverse hydrological impacts while maximizing ecosystem services across a landscape.
Balancing trade-offs of multiple ecological service of forests Despite afforestation/reforestation is essential for carbon sequestration, soil erosion control, flood disaster mitigation, poverty alleviation, biodiversity conservation and many other benefits, a growing concern over water or streamflow reduction due to the large-scale reforestation effort, particularly in the arid and semi-arid regions of China has intensified. Therefore, it is imperative to study how to balance the trade-offs of multiple forest ecosystem services by harmonizing synergy. Water problems in China are region specific, and accordingly, managing forest-water relation should be approached differently from region to region. Water related ecological issues such as water pollution, downstream hydrological regime shift and resulting aquatic biodiversity loss are worth integrated with water resource in forest management at large-scale (landscape or regional scale). In southern China, water pollution rather than water shortage is the major problem that has been inadequately addressed, whereas northwestern China is facing serious water shortage problem. Therefore, these differences should be clearly recognized in regional forest management and forest-water research with addressing regional key water-related environmental problems while balancing trade-offs of forest ecosystems services.
5.5 Acknowledgments We are grateful to Prof. Jingxin Wang for helpful comments and revisions that improved this paper. Shirong Liu was jointly funded by the Ministry of Finance (201404201; 201104006 and 200804001), the Ministry of Science and Technology (2012BAD22B01), and China’s National Natural Science Foundation (31290223, 31100380, and 31200477). The co-author, Dr. Yong Lin was supported by special fund for marine and ocean research in the public interest (201405007).
5.6 References Andreassian V. 2004. Waters and forests: from historical controversy to scientific debate. Journal of Hydrology, 291(1):1-27. Bosch JM, Hewlett JD. 1982. A review of catchment experiments to determine the effect of vegetation changes on water yield and evapotranspiration. Journal of Hydrology, 55(1-4):3-23. Buttle JM, Metcalfe RA. 2000. Boreal forest disturbance and streamflow response, northeastern Ontario. Canadian Journal of Fisheries and Aquatic Sciences, 57(S2):5-18. Calder IR. 2007. Forests and water-Ensuring forest benefits outweigh water costs. Forest Ecology and Management, 251(1-2):110-120. Cao YJ. 1991. The impact of the forests in Songhuajiang basin on river discharge in forest ecosystem research in fixed stations, Eds by Zhou XF. Northeast Forestry University Press, Harbin. p396-402. Chen JF, Li XB, Zhang M. 2005. Simulating the impacts of climate variation and land-cover changes on basin hydrology: A case study of the Suomo basin. Science on China Ser.D Earth Sciences, 48(9):1501-1509. Chen LD, Fu BJ, Zhao WW. 2006. Source-sink landscape theory and its ecological significance. Acta Ecologica Sinica, 26(5):1444-1449 (in Chinese) Costa MH, Botta A, Cardille JA. 2003. Effects of large-scale changes in land cover on the discharge of the Tocantins River, Southeastern Amazonia. Journal of Hydrology, 283(1-4):206-217. Cui J, An SQ, Wang ZS, Fang CM, Liu YH, Yang HB, Xu Z, Liu SR. 2009. Using deuterium excess to determine the sources of high-altitude precipitation: Implications in hydrological relations between sub-alpine forests and alpine meadows. Journal of Hydrology, 373(1-2):24-33.
63
Forest management and the impact on water resources: a review of 13 countries Démurger S, Hou YZ,Yang WY.2009.Forest management policies and resource balance in China an assessment of the current situation. the journal of environment and development.18(1):17-41 Deng HP. 2012. Modelling the impacts of temperature changes on hydrological effects of forests in the mountain region of southwestern China at basin scale. Ecology and Environmental Sciences, 21(4):601-605 (in Chinese). Du S, Wang YL, Kume T, Zhang JG. 2011. Sapflow characteristics and climatic responses in three forest species in the semiarid Loess Plateau region of China. Agricultural and Forest Meteorology, 151(1):1-10. Dyhr-Nielsen M. 1986. Hydrological effect of deforestation in the Chao Phraya basin in Thailand. The paper presented at the International Symposium on Tropical Forest Hydrology and Application, Chiangmai, Thailand. 11–14 June 1986, p12. Fan BM, Li ZY. 2005. Forest, evapotranspiration, climate and desert: effects on desertification since the change of forests in China. Scientia Silvae Sinicae, 41(2):154-159. Fohrer N, Haverkamp S, Frede H. 2005. Assessment of the effects of land use patterns on hydrologic landscape functions: development of sustainable land use concepts for low mountain range areas. Hydrological Processes, 19(3):659-672. Fu BJ, Qiu Y, Wang J, Chen LD. 2002. Effect simulations of land use change on the runoff and erosion for a gully catchment of the Loess Plateau, China. Acta Geographica Sinica, 57(6):717-722 (in Chinese). Gu WZ. 1995. Various patterns of basin runoff generation identified by hydrological experiment and water tracing using environmental isotopes. Journal of Hydraulic Engineering, (5):9-17,24. Guo J, Su XL. 2014. Application of conceptual eco-hydrological model to distinguish effects of climate change and land use change on runoff. Hydroelectric Engineering, 33(3):36-41 (in Chinese). Huang M, Zhang L, Gallichand J. 2003. Runoff responses to afforestation in a watershed of the Loess Plateau, China. Hydrological Processes, 17(13):2599-2609. Li LJ, Zhang L, Wang H, Wang J, Yang JW. 2007. Assessing the impact of climate variability and human activities on streamflow from the Wuding River basin in China. Hydrological Processes, 21(25):3485-3491. Li WH, He YT, Yang LY. 2001. A summary and perspective of forest vegetation impacts on water yield. Journal of Natural Resources, 16(5):398-406 (in Chinese). Lin Y, Wei XH. 2008. The impact of large-scale forest harvesting on hydrology in the Willow watershed of Central British Columbia. Journal of Hydrology, 359(1-2):141-149. Liu ML, Tian HQ, Chen GS, Ren W, Zhang C, Liu JY. 2008. Effects of land-use and land-cover change on evapotranspiration and water yield in China during 1900-2000. Journal of the American Water Resources Association, 44(5):1193-1207. Liu SR, Wen YG, Wang B, Zhou GY. 1996. Ecohydrological functions of forest ecosystems in China. China Forestry Publication House, Beijing. (in Chinese). Liu SR, Sun PS, Wen YG. 2003. Comparative analysis of hydrological functions of major forest ecosystems in China. Acta Phytoecological Sinica, 27(1), 16-22. Liu SR, Lin Y, Zhang YD, Guo ZH, Zhang L, Li C, Wang JX. 2010. Landscape ecology contributions to forestry and forest management in China: Progress and research needs. (Chapter 2 in landscape ecology in forest management and conservation: Challenges and solutions for global change Eds by Li C, Lafortezza R, Chen JQ. Higher Education Press, Beijing. p23-46. Liu SR, Wu S, Wang H. 2014. Managing planted forests for multiple uses under a changing environment in China. New Zealand journal of forestry science, 44(suppl 1),S3 Liu SX, Zhang SF, Liu CM. 2001. Advances on the research into the mechanism of hydrological cycle in Yellow river catchment. Geographical Research, 20(3):257-265. Liu WJ, Liu WY, Li PJ, Gao L, Shen YX, Wang PY, Zhang YP, Li HM. 2007. Using stable isotopes to determine sources of fog drip in a tropical seasonal rain forest of Xishuangbanna, SW China. Agricultural and Forest Meteorology, 143(1-2):80-91. Liu YH, An SQ, Deng ZF, Fan NJ, Yang HB, Wang ZS, Zhi YB, Zhou CF, Liu SR. 2006. Effects of vegetation patterns on yields of the surface and subsurface waters in the Heishui Alpine Valley in west China. Hydrology and Earth System Sciences Discussions, 3(3):1021-1043. Lu P, Urban L, Zhao P. 2004. Granier’s thermal dissipation probe (TDP) method for measuring sap flow in trees: Theory and practice. Acta Botanica Sinica, 46(6):631-646.
64
Chapter 5. Forest Management and Water in China Ma XH. 1987. Preliminary Study on Hydrologic Function of fir Forest in the Miyaluo Region of Sichuan. Scientia Silvae, 23(3):253-265 (in Chinese). McVicar TR, Li LT, Van Niel TG, Zhang L, Li R, Yang QK, Zhang XP, Mu XM, Wen ZM, Liu WZ, Zhao YA, Liu ZH, Gao P. 2007. Developing a decision support tool for China’s re-vegetation program: Simulating regional impacts of afforestation on average annual streamflow in the Loess Plateau. Forest Ecology and Management, 251: 65–81. Ouyang W, Hao FH, Wang XL. 2008. Regional nonpoint source organic pollution modeling and critical area identification for watershed best environmental management. Water Air and Soil Pollution, 187(1-4): 251-261. Peng H, Jia YW, Niu CW, Gong JG, Hao CF, Gou S. 2014. Eco-hydrological simulation of soil and water conservation in the Jinghe River Basin in the Loess Plateau, China. Journal of Hydro-environment Research, xx:1-13. Qian WC. 1983. Effects of deforestation on flood characteristics with particular reference to Hainan island, China. International Association of Hydrological Sciences Publication, 140:249-258. Shen ZY, Hou XS, Li W, Aini G. 2014. Relating landscape characteristics to non-point source pollution in a typical urbanized watershed in the municipality of Beijing. Landscape and Urban Planning, 123:96-107. Sun G, Alstad K, Chen JQ, Chen SP, Ford CR, Lin GH, Liu CF, Lu N, McNulty SG, Miao HX, Noormets A, Vose JM, Wilske B, Zeppel M, Zhang Y, Zhang ZQ. 2011. A general predictive model for estimating monthly ecosystem evapotranspiration. Ecohydrology, 4(2):245-255. Sun G, Zhou GY, Zhang ZQ, Wei XH, McNulty SG, Vose JM. 2006. Potential water yield reduction due to forestation across China. Journal of Hydrology, 328(3-4):548-558. Sun P S, Liu SR, Jiang H, LÜ Y L, Liu J T, Lin Y, Liu X L. (2008) Hydrologic effects of NDVI time series in a context of climatic variability. Journal of the American Water Resources Association 44(5):1132-1143 Suo AN, Hong J, Lin Y, Ge JP. 2005. Relationships between soil and water loss and landscape pattern on Loess Plateau. Chinese Journal of Applied Ecology, 16 (9):1719-1723 (in Chinese). Vose JM, Sun G, Ford CR, Bredemeier M, Otsuki K, Wei XH, Zhang ZQ, Zhang L. 2011. Forest ecohydrological research in the 21st century: what are the critical needs?. Ecohydrology, 4(2):146-158. Wang YH, Yu P,Xiong W, et al.2008. Water-yield reduction after afforestation and related processes in the semi-arid Liupan Mountains.JAWRA journal of the American water resources association, 44(5):1086-1097 Wang S, Fu BJ, He CS, Sun G, Gao GY. 2011a. A comparative analysis of forest cover and catchment water yield relationships in northern China. Forest Ecology and Management, 262(7):1189-1198. Wang YH, Yu PT, Feger K, Wei XH, Sun G, Bonell M, Xiong W, Zhang SL, Xu LH. 2011b. Annual runoff and evapotranspiration of forestlands and non-forestlands in selected basins of the loess plateau of China. Ecohydrology, 4(2), 277-287. Wei X, Liu S, Zhou G, Wang C. 2005. Hydrological processes in major types of Chinese forest. Hydrological Processes, 19(1):63-75. Wei XH, Sun G, Liu SR, Jiang H, Zhou GY, Dai LM. 2008. The forest-streamflow relationship in China: a 40-years retrospect. Journal of the American Water Resources Association, 44(5):1076-1085. Wei XH, Zhang MF. 2010. Quantifying streamflow change caused by forest disturbance at a large spatial scale: a single watershed study. Water Resources Research, 46(12):1-15. Wilk J, Andersson L, Plermkamon V. 2001. Hydrological impacts of forest conversion to agriculture in a large river basin in northeast Thailand. Hydrological Processes, 15(14):2729-2748. Xia LL, Liu RZ, Zao YW. 2012. Correlation analysis of landscape pattern and water quality in Baiyangdian watershed. Procedia Environmental Sciences, 13(10):2188-2196. Xiao H, Wei J. 2007. Relating landscape characteristics to non-point source pollution in mine waste-located watersheds using geospatial techniques. Journal of Environmental Management, 82(1):111-119. Xu JH, Niu YG. 2000. Study on the impact of hydraulic engineering and soil water conservation works on streamflow and sediment load in the coarse sandy hilly region of the Yellow River basin. Yellow River Water Conservancy Press: Zhengzhou, China (in Chinese). Xu JX. 2000. Runoff and sediment variations in the upper reaches of Changjiang River and its tributaries due to deforestation. Journal of hydraulic engineering, (1):72-80 (in Chinese). Xu Q, Li H, Chen JQ, Cheng XL, Liu SR, An SQ. 2011. Water use patterns of three species in subalpine forest, Southwest China: the deuterium isotope approach. Ecohydrology, 4(2):236-244.
65
Forest management and the impact on water resources: a review of 13 countries Xu SG, Liu YF, Sun WG. 2006. Research on the Stable Isotope for Soil Water Vertical Transporting in Unsaturated Zone of Zhalong Wetland. Journal of China Hydrology, 26(5):1-6 (in Chinese). Yang X. 2012. An assessment of landscape characteristics affecting estuarine nitrogen loading in an urban watershed. Journal of Environmental Management, 94 (1):50–60. Yu GR, Song X, Wang QF, Liu YF, Guan DX, Yan JH, Sun XM, Zhang LM, Wen XF. 2008. Water-use efficiency of forest ecosystems in eastern China and its relations to climatic variables. New Phytologist, 177(4):927-937. Yu GR, Wen XF, Sun XM, Tanner BD, Lee X, Chen JY. 2006. Overview of ChinaFLUX and evaluation of its eddy covariance measurement. Agricultural and Forest Meteorology, 137(3-4):125-137. Yu XX, Li XB, Xia B. 2010. Forest landscape patterns and LUCC on ecohydrological response. Science Press, Beijing (in Chinese). Yu XX, Wang YH, Wang YJ, Bi HX, Cai TJ, Zhang JC, Yan WD, Liu XD, Zhou P. 2014. Forest eco-hydrological processes and mechanisms in China’s typical regions. Science Press, Beijing (in Chinese). Zhang HP, Simmonds LP, Morison JII, Payne D. 1997. Estimation of transpiration by single trees: comparison of sap flow measurements with a combination equation. Agricultural and Forest Meteorology, 87 (2-3):155-169. Zhang L, Hickel K, Dawes WR, Chiew FHS, Western AW, Briggs PR. 2004a. A rational function approach for estimating mean annual evapotranspiration. Water Resources Research, 40(2):1-14. Zhang M, Wei XH, Sun PS, Liu SR. 2012. The effect of forest harvesting and climatic variability on runoff in a large watershed: The case study in the Upper Minjiang River of Yangtze River Basin. Journal of Hydrology, 464(13):1-11. Zhang PC, Shao GF, Zhao G, Master DC, Parker GR, Dunning JB, Li QL. 2000. China’s forest policy for the 21st century, 288(5474):2135-2136. Zhang XP, Zhang L, Li R, Yang QK. 2009. DEM-based modeling of the impact of vegetation restoration on annual streamflow in the Loess Plateau of China. Chinese Journal of Plant Ecology, 33(6): 1056-1064 (in Chinese). Zhang XP, Zhang L, McVicar TR, Van Niel TG, Li LT, Li R, Yang QK, Wei L. 2008. Modelling the impact of afforestation on average annual streamflow in the Loess Plateau, China. Hydrological Processes, 22(12):1996-2004. Zhang YD, Liu SR, Wei XH, Liu JT, and Zhang GB. Potential impact of afforestation on water yield in the subalpine region of southwestern China. Journal of the American Water Resources Association. 2008, 44(5): 1144-1153 Zhang YD, Liu SR, Gu XF. 2011. The impact of forest vegetation change on water yield in the subalpine region of southwestern China. Acta Ecologica Sinica, 31(24):7601-7608 (in Chinese). Zhang Z, Wang S, Sun G, McNulty S, Zhang M, Li J. 2006. Application of a physically based distributed watershed hydrological model MIKESHE in a small watershed of the Loess Plateau, Western China. In: Liu S, Sun G, Sun P. (Eds.), Extended Abstracts from the Conference on Forest and Water in a Changing Environment, Chinese Academy of Forestry, Beijing, China, August 8-1, 2006. Zhang ZQ, Wang LX, Wang SP. 2004b. Forest hydrology research in China. Science of Water and Soil Conservation, 2(2):68-73. Zhang ZQ, Yu XX, Zhao YT, Qin, YS. 2003. Advance in researches on the effect of forest on hydrological process. The Journal of Applied Ecology, 14(1):113-116 (in Chinese). Zhang ZZ, Yu XX. 1988. The Major Progress on Chinese Forest Hydrological Research. Journal of Beijing Forestry University, 10(2):79-87 (in Chinese). Zhou GY, Wei XH, Luo Y, Zhang MF, Li YL, Qiao YN, Liu HG, Wang CL. 2010. Forest recovery and river discharge at the regional scale of Guangdong Province, China. Water Resources Research, 46(9):5109-5115. Zhu XJ, Yu GR, Wang QF, Hu ZM, Zheng H, Li SG, Hao YB. 2015. Spatial variability of water use efficiency in China’s terrestrial ecosystems. Global and Planetary Change, 129:37-44.
66
Chapter 6. Forest Management and Water in the Democratic Republic of Congo Josué Bahati Chishugi16 (
[email protected]); Christian Amani17,18 (
[email protected]); Chantal Kabonyi Nzabandora18 (
[email protected]); Jean de Dieu Mangambu Mokoso18 (
[email protected]); David Ushindi Chishugi19 (
[email protected]); Bienvenu Mulwa Gasuga205 (
[email protected])
6.1 Introduction The Democratic Republic of Congo (DRC) is the second largest African country and is located in the Central African zone. The DRC is the fifth largest country in the world in terms of forest cover, and the largest in Africa. Its forest cover, estimated to be more than 166 million hectares, represents more than 62% of the Congo forests (the second largest block of tropical forest in the world). Congo’s forests are compound by 69% of dense forest and only a little more than 30% of other types of forest (Tchathou et al. 2015). The Congo forest represents 10% of the world’s tropical forests and more than 47% of those in Africa (Tchathou et al. 2015), thus having 11 forest types: swamp forest, tropical lowland rainforest, tropical sub-montane rainforest, three types of Afromontane forest, Zambezian forest (Muhulu), Zambezian woodland (Miombo), Sudanese woodland, coastal sclerophyllous forest and mangroves (Musampa et al. 2012). Several studies (De Merode 1998, Yamba 2009, Nelson et al. 2012, Samndong and Nhantumbo 2014), have identified the Congo forest as a critical livelihood source for about 40 million people, providing food, medicine, domestic energy, building materials, and monetary income. The country also plays an important role in regulating the regional and global climate, while commercial logging generates a great deal of state income (Debroux et al. 2007, Mbala and Karsenty 2010, Musampa et al. 2012). The forest harbors an enormous amount of the world’s biodiversity and the DRC ranks as the fifth among countries for its rich diversity of flora and fauna (Musampa et al. 2012). The DRC forests contain a vast plant and animal diversity and include five national world heritage sites (Yanggen et al. 2010). However, these forests are under increasing pressure that could eventually lead to very high degradation and increase poverty among many people who still depend heavily on the resources offered by the forest (de Wasseige et al. 2010). The availability and quality of water in many regions of the world are more and more threatened by misuse and pollution, being increasingly recognized that both are strongly influenced by forests. Moreover, climate change is altering forest’s role in regulating water flows and influencing the availability of water resources (Bergkamp et al. 2003). Therefore, the relationship between forests and water is a critical issue that must be accorded high priority (Calder et al. 2007). West (1990) and Ice and Stednick (2004) found the relationship between forests and water resources as subjects of speculation, controversy, and scientific inquiry. Perceptions that forests have important roles in water resource conservation, for example, were important factors leading to the creation of forest reserves more than a century ago in the United States. Since then, hundreds of field studies have been conducted on various aspects of forest watersheds and their management (Ice and Stednick 2004). Intensive research on forest and watershed hydrology conducted in developed and developing countries, such as the United States (Hamilton 1985, Hornbeck et al. 1993, Ice and Stednick 2004, NCASI 2009, Neary et al. 2012, Wright 2016), Canada (NCASI 2009), Australia (Hewlett and Nutter Departement de Géologie, Université Officielle de Bukavu, DR. Congo CGIAR, Goma, DR. Congo 18 Departement de Biologie, Université Officielle de Bukavu, DR. Congo 19 Independant consultant in crop sciences 20 Ministère de l’Environnement, Conservation de la Nature et Tourisme, DR. Congo 16 17
67
Forest management and the impact on water resources: a review of 13 countries
1968, Holmes and Colville 1970, Ruprecht et al. 1991, Cornish 1993, Bren 2015), Brazil (Bonnet et al. 2005, Germer et al. 2006, Martinez and Toan 2007, Coe et al. 2009, Callède et al. 2010, Melack and Hess 2010, Coe et al. 2011, Levia et al. 2011, Nobrega 2016), and South Africa (Pereira 1962, Wicht 1967, Van Der Zel 1974, Van Wilgen 1982, Hewlett and Bosch 1984, Van Wyk 1987, Bernnett and Kruger 2015), led to the creation of BMPs that helped mitigate or alleviate the impact of forest management on water resources. For the Amazon, the first largest tropical forest in the world, there is a vast literature on forest and water (e.g. Franken and Leopoldo 1984, Furk 1984, Lesack 1993, Mertes et al. 1995, Laurance and Williamson 2001, Nepstad et al. 2004, Jirka et al. 2007, D’Almeida et al. 2007, Celleri and Feyen 2009, Cabral et al. 2010, Ellison et al. 2012). Surprisingly, however, the limited number of studies and publications on forest hydrology in the second world largest tropical forest is alarming. The creation of effective politics will not be possible as a consequence of scarce research and data pertaining a fully understanding of the relationship between forests and water systems in the Congo forest. Tchatchou et al. (2015) noted that in the absence of decisions and vigorous actions, deforestation will increase substantially in the Congo basin because of large programs that are being put in place in view of their emergence, such as the need to generate more capital from the exploitation of forests and other natural resources within its perimeter or watershed. Conducting research on forest hydrology at both large and small watershed scales will definitely fill the knowledge gap for a better and sustainable exploitation and management of the forest resources, mitigating or reducing its impact on water resources (the atmospheric, surface, sub-surface water, and deep groundwater) linked to the forest. In deep root tropical forest ecosystems like those at the Congo and the Amazon, groundwater resources underneath the forest catchment should also be considered, because deep groundwater bodies sustain the forests during a long dry period and groundwater hydrology might mitigate against any adverse effects of predicted lengthening of the dry season (Hulme and Viner 1995 in Bonell 1998). This chapter summarizes the state of current knowledge about forest and water interactions in the DRC.
6.2 Literature review Though characterized as a worldwide worth, the literature on forest hydrology of the DRC is very poor to inexistent and unavailable. This is probably caused by a lack of funding to support the related researches from the governmental institutions. International organizations have sponsored few researches on the Congo forest and the hydrology of the Congo river, but none of them was directly oriented to forest hydrology, but rather to forest or ecosystem mapping, deforestation, hydrological modeling, and climate change and its impact on water resources. Below are listed or summarized a few of these studies, though not directly dealing with forest hydrology itself. Recent publications on deforestation in the DRC are those from Ickowitz et al. (2015) and Tchatchou et al. (2015), giving a detailed review on the agriculture and deforestation in the Democratic Republic of Congo. In the first paper, 44 papers of which 16 from Web of Science and 28 from Google Scholar are published on the DRC. Only 15 of these papers made a specific claim about the relationship between agriculture and deforestation (or forest degradation) in the DRC. Ickowitz et al. (2015) found that deforestation is taking place, albeit at a slower rate than in the rest of the tropics and is concentrated in Kinshasa and Bas Congo provinces, in the eastern DRC, and around medium-sized cities along the Congo River. Rates of primary forest loss appear to be very slow, but are accelerating. Tchatchou et al. (2015) attempted to present the current state of forests at the Congo Basin, to analyze the main current factors of deforestation and forest degradation, making projections in the light of the vision of the emergence of the various countries concerned. They reported that forest exploitation and the extraction of wood energy represent the main causes of forest degradation. Furthermore, the authors recommended additional studies on how to reconcile economic development and environmental concerns in the region. Both Ickowitz et al. and Tchatchou et al. identified agriculture to be the main cause of deforestation, and its impact will likely increase as the population of the 68
Chapter 6. Forest Management and Water in the Democratic Republic of Congo
DRC grows. Similarly, Alisdorf et al. (2016) published a detailed review of results on the hydrology of the Congo Basin and summarized the historic and ongoing research. The main goal of this paper was to provide a basis for new hydrologic research in the Congo Basin, and thus allowing a better understanding of the potential for climate change impacts on the hydrology of the area. From a relative comparison of the total peer reviewed papers (33 for Congo and 299 for the Amazon), the authors found that our contemporary understanding of the Congo Basin and its hydrology is about an order of magnitude less than that of the Amazon. Few conclusions are drawn from this review. On precipitation, based on the studies that address multi-decadal in-situ measurements of rainfall, Alisdorf et al. (2016) noted that there is not a clear agreement that precipitation has significantly declined from 1960 to 1990 across the entire basin. On evapotranspiration, Bultot and Griffiths (1972) concluded that the annual potential evapotranspiration (PET) does not differ greatly from one region to the next (from about 1,100 to a little over 1,200 mm); actual evapotranspiration (AET) in wet seasons is really equal to potential evapotranspiration; whereas in dry seasons the AET is less PET. The AET does vary from region to region across the basin from “a little more than 800 mm in Katanga to a little less than 1,200 mm in Uele. Hydrological models were applied to evaluate the surface water resources of the Congo Basin. Though most of these models are applied for the entire basin, their results are perfectly applied to the DRC, owing to its position inside the basin and surface proportion as compared to other countries. In order to understand and evaluate the spatial and temporal distribution of water resources of the Congo Basin, a Hybrid Atmospheric and Terrestrial Water Balance (HATWAB) model was parameterized and applied to the Congo Basin (Chishugi and Alemaw 2009). The simulated results (the integrated moisture convergence, soil moisture, actual evapotranspiration, and runoff) indicate a strong correlation with rainfall patterns, especially in the high rain-fed region corresponding to the heart of the equatorial forest. Tshimanga et al. (2011) applied a monthly time-step hydrological model to address the challenge of water resources estimation in the Congo basin. Moreover, and highlighting the lack of accurate and continuous climatic and hydrological data in the Congo basin, Tshimanga and Hughe (2014) applied a semi-distributed rainfall-runoff model (PITMAN) using available historical data. Their model was able to capture the timing and magnitude of high- and low-flows satisfactorily, regardless to the location of the sub-basins in headwater areas, downstream areas, or at the outlet. However, the authors identified several challenges in modeling the Congo Basin’s hydrology, including phenomenon such as the south-to-north large changes in seasonal rainfall, the varying lithologies and resultant soil types, and differing vegetation types and thus varying ET (Alisdorf et al. 2016). For example, many of the observed data that are available for the Congo Basin are at the outlets of large subbasins where it is difficult to interpret the hydrological response characteristics because of the large scale of the basins and because of a multiplicity of interacting processes. These processes not only include surface and subsurface response to rainfall at the small scale but also include storage and attenuation effects of wetlands, floodplains, natural lakes, and the channel systems of large rivers. The same difficulties were recognized during the development of a wetland model for the areas of Lake Tanganyika, Lake Upemba, and the Bangweulu Swamps (Hughes et al. 2014 in Alisdorf et al. 2016). The authors concluded that the dynamics of the interchange of water between wetlands and river channels can be complex and different (depending on their physical configuration) and that remote sensing has the potential to contribute to this understanding (Alisdorf et al. 2016). Recently, Lee et al. (2015) developed a linear regression model based on PALSAR ScanSAR backscattering coefficient, water levels from Envisat radar altimetry, and MODIS Vegetation Continuous Field (VCF) products, to generate water depth maps over the flooded forests (wetlands) of the Central Congo Basin. This is the first time such methods are applied on these wetlands. Similarly, Becker et al. (2014) used ENVISAT satellite altimetry data and derived water level fluctuations in the Congo Basin, between 2003 and 2009. The remotely sensed mapping was also conducted by Lee et al. (2011) using GRACE and satellite radar altimetry data to characterize the dynamics of terrestrial water in the Congo Basin. They found that from 2007 to 2011 in the radar frame over the Cuvette Centrale, flooded forest areas covered between 17,700 km2 and 29,400 km2 (December), 69
Forest management and the impact on water resources: a review of 13 countries
whereas the low-water areas varied from 7,600 km2 to 3,400 km2 (March). Previously, Bwangoy et al. (2009) used an optical and radar remotely sensed data to derive topographical indices and generate a wetlands probability map of the Central Congo Basin. They found that wetlands predominate (about 56%) in the CARPE Lake Tele Tumba landscape, located in the western part of the DRC and the south-eastern Republic of Congo. Crowley et al. (2006) used GRACE satellite gravity data to estimate the land water storage within the Congo Basin. Laraque et al. (1998, in Alisdorf et al. 2016) measured depths of 3 m in Lake Tele from the northwestern Cuvette Centrale, noticing mud marks on trees, an indication of annual range in level of about 1 m. Laraque et al. (1998) quoted three references from 1959 to 1961, indicating that Lake Tumba is 3 to 8 m deep and Lake Mai-Ndombe is 3 m deep, both with annual level fluctuations of 2 to 4 m. For the Lake Tumba, the same depths were reported by Marlier (1973). The reader can also consult Brummett et al. (2009) for more details on water resources, forests, and ecosystems in the Congo Basin. The success of satellite applications on surface and subsurface water storage mapping in the Congo can be justified by the continental size of these forests and catchment, as well as the scarcity of reliable and continuous ground-based hydrological and climatic data for the region. For decades, several authors (UNFCCC 2009, Tshimanga et al. 2011, Ludwig et al. 2013, Tshimanga and Hughes 2014, de Wasseige et al. 2015, Alisdorf et al. 2016) noted the unreliability and scarcity of data in the Congo Basin, as compared to other regions of the world. This unresolved issue needs to be given high priority by governmental and internationals organizations. A paper in review by Yollande Munzimi (a PhD candidate at the Department of Geographical Sciences, University of Maryland) on streamflow characterization and the hydrological impact of forest cover change will be of utmost importance (personal communication, 22nd September 2016). August (2013) assessed the effects of land use/cover change on streamflow in the Ndjili River basin (a 2,088 km2 watershed), located in the western side of the DRC. The author found that owing to uncontrolled development activities such as informal settlements, deforestation, vegetation clearance, and mining, between 1987 and 2001, the Ndjili catchment’s forests have decreased 8%, while agricultural land and urbanization have slightly increased 1.4% and 4%, respectively; also, the decrease in natural vegetation cover caused peak flows and mean flows to increase 21.5% and 7.1%, respectively. The study by Brummett et al. (2009) about the role of forests in the Congo Basin’s water balance, exhibits the usefulness of studies from other areas of the world as they provide insights on how forest cover may affect water systems. Some evidence from other regions are that (1) deforestation will increase discharge and runoff on smaller tropical watersheds and (2) mature tropical rainforest deforestation has the potential to degrade the regulation of hydrological flows through changes in evapotranspiration, canopy interception, surface runoff, and groundwater recharge. Brummett et al. (2009) concluded that the results of local, short-term studies provide important information but cannot necessarily be extrapolated to the larger scales and time frames of relevance when discussing vast river systems like the Congo Basin. The authors agree with the statements that the changes in land cover had a significant impact on discharge, although not precipitation in the Amazonian river basin (Costa et al. 2003), and that the effects of deforestation on evapotranspiration rates in the Congo river basins are expected to be particularly significant because of a large portion of rainfall (between 75-95%) coming from recycling moisture on the region’s forests (Brinkman 1983). The aforementioned books and papers on forest hydrology, added to the recent works of Bosch and Hewlett (1982), Bruijnzeel (2002), Bruijnzeel (2004), NCASI (2009), Jofré et al. (2014), and GarciaChevesich et al. (2015a and b) give a detailed review on effect of forest management on water resources. These findings could be applied in the DRC forest provided the climatic aspects of the region are considered.
70
Chapter 6. Forest Management and Water in the Democratic Republic of Congo
Forest and land-cover change mapping (from de Wasseige et al. 2010, with updates) The Observatoire Satellital des Forêts d’Afrique Centrale (OSFAC, South Dakota State University) and the University of Maryland, have implemented wall-to-wall mapping at moderate spatial resolution (60 m), to better quantify spatio-temporal trends in forest cover changes for Central Africa (De Wasseige et al. 2010). The initial results of this mapping, the “Forêts d’Afrique centrale évaluées par télédétection (FACET)” product suite, quantifies DRC’s forest cover and forest cover loss between 2000 and 2010, using Landsat imagery. Three forest types were mapped: (i) primary forest (mature forest with >60% canopy cover), (ii) secondary forest (regrown forest with>60% canopy cover), and (iii) woodlands (woodland formations with 30-60% canopy cover). During the year 2000, the total forest cover was estimated to be 159,529 thousand hectares, with gross forest loss from 2000 to 2010 totaling 2.3% of total forest area (De Wasseige et al. 2010). The results indicate that, for the active period of 1990-2000, the yearly rates of deforestation in central Africa and more especially in the DRC, were 0.21% and 0.25%, respectively (Duveiller et al. 2008). The authors estimated an annual rate of 0.12% for the deterioration of the forests in the RDC and, considering ongoing reforestation, the annual net deforestation rate was 0.16% for central Africa and 0.20% for the RDC. The results of the forest change sampling method estimated that the Congo Basin’s gross annual deforestation rate was 0.13% in the 1990-2000 period; however, such rate doubled by 2005. The annual net degradation rate was 0.05% (1990-2000) and 0.09% (2000-2005), as indicated in Table 1a. For the DRC alone, the evolution of gross and net deforestation between 1990-2000 and 20002005 is quite significant (WRI 2010). The most affected regions are north of the Equatorial provinces, the Oriental province, and the Kivu region (Duveiller and al. 2008). In fact, an assessment of the forest change cover map produced for the DRC by the Decadal Forest Change Monitoring (DFCM) Program confirmed these observations and indicated a concentration of the deforestation zones along axes of transportation (road or fluvial), around large urban areas (Gemena, Lisala-Bumba, Kisangani, etc.), and in the high density population zones of Kivu. The Virunga region showed the highest annual deforestation rate (0.57%, nearly 3 times higher to the national average) (Lindquist et al. 2010). More details about the DRC’s forest evolution are shown Tables 1b, and illustrated in Figure 1. Table 1a. Annual deforestation, reforestation, degradation, and regeneration rates in the dense forest zones of the DRC and Congo Basin, for the 1990-2000 and 2000-2005 periods. (from Ernst et al. 2010, in de Wasseige et al. 2010).
DRC 1990 - 2000
Congo Basin
2000 - 2005
1990 - 2000
2000 - 2005
334
242
547
337
Gross deforestation (%)
0.15 ± 0.02
0.32 ± 0.05
0.13 ± 0.02
0.26 ± 0.04
Gross reforestation (%)
0.04 ± 0.01
0.10 ± 0.03
0.04 ± 0.01
0.09 ± 0.02
0.11
0.22
0.09
0.17
Gross degradation (%)
0.07 ± 0.01
0.16 ± 0.03
0.07 ± 0.01
0.14 ± 0.02
Gross regeneration (%)
0.02 ± 0.00
0.04 ± 0.02
0.01 ± 0.00
0.04 ± 0.01
0.06
0.12
0.05
0.09
Number of processed samples
Net deforestation (%)
Net degradation (%)
The increase in net deforestation rate from 0.09% between 1990 and 2000 to 0.17% between 2000 and 2005 has been worsened in the DRC, where the rate has doubled between the two periods, from 0.11% (1990-2000) to 0.22% (2000-2005). Note that these rates have remained low compared to other regions of the world (Tchatchou et al. 2015). A deforestation rate of 0.3% was already estimated for the Congo basin by Giralowski (2002), who considered the 1955-1989 period, based 71
Forest management and the impact on water resources: a review of 13 countries
on extrapolation of maps. This rate could be higher compared to the rate estimated by De Wasseige et al. (2010), probably due to scale errors that originate from extrapolation of maps. Similarly to other countries in the Congo Basin, the several causes that can explain deforestation include direct causes (e.g. infrastructure development, mining, collection of wood energy and agricultural expansion) and the underlying or structural causes (e.g. economic development or population expansion). Nevertheless, agriculture is the main cause – particularly “slash-and-burn” agriculture, practiced by different populations (Geist and Lambin 2001, Giralowski 2002, De Wasseige et al. 2010, Tchatchou et al. 2015). Total forest cover (Table 2) decreased by 13.8 % between the 2000-2005 and 2005-2010 intervals, with the greatest increase occurring within primary tropical forests. Forest cover loss intensity was distributed unevenly and was most correlated with areas of high population density and mining activity. While gross deforestation for all protected areas increased 64% between the 2000-2005 and 2005-2010 periods, protected areas and Congo Basin Forest Partnership (CBFP) landscapes had lower rates of gross deforestation than areas outside of them (De Wasseige et al. 2010). Table 1b. Area estimates (in hectares) of the land cover types for the DRC as derived from the Congo Basin land cover map (Source: Verhegghen and Defourny 2010). Land cover class
DRC
Congo Basin
DRC (%)
101,822,027
161976107
62.9
3,273,671
3,576,307
91.5
Montane forest
930,863
1,203,462
77.3
Edaphic forest
8,499,308
12666681
67.1
181
428060
0.04
114,526,051
186,765,850
61.3
Forest-savanna mosaic
6,960,040
21,370,825
32.6
Rural complex and young secondary forest
21,425,449
32,253,138
66.4
Tropical dry forest- Miombo
23,749,066
28,840,818
82.3
Woodland
36,994,935
87,400,481
42.3
Shrubland
6,705,478
16,360,746
41.0
Grassland
4,372,677
6,501,378
67.3
Aquatic grassland
75,888
541004
14.0
Swamp grassland
701,308
832,136
84.3
Sparse vegetation
2,129
2224
95.7
12,907,360
22,008,226
58.6
0
807,396
0.0
181
88043
0.2
Bare land
41,935
42030
99.8
Cities and developed area
41,716
109382
38.1
Water
3,944,206
5,068,923
77.8
Total
232,448,419
408,992,600
56.8
Lowland dense moist forest Submontane forest
Mangrove forest Total dense forest
Mosaic of cultivated land and natural land Agriculture Irrigated agriculture
72
Chapter 6. Forest Management and Water in the Democratic Republic of Congo Table 2. Forest cover and loss in DRC (x 1,000 ha) (Source: OSFAC 2010). 2000 Forest cover
2000 - 2005 Forest loss
2005 - 2010 Forest loss
Primary forest
104,455
367
701
Secondary forest
18,293
1,168
947
Woodland
36,781
201
328
Total
159,529
1,736
1,976
Forest type
Figure 1. Evolution of the allocated area for forest exploitation (WRI 2010). Figure 1. Evolution of the allocated area for forest exploitation (WRI 2010).
Forest plantations
Forest plantations In a report on the state of Congo forests, de Wasseige et al. (2015) noted that forest plantations are not In developed a report on in thethe state of Congo forests, debecause Wasseige (2015) forest plantations much Congo Basin, mostly of et theal.need for noted majorthat investments requiredare to much developed in the Congo Basin,value, mostlyas because therisky needcountry for major investments required startnot with planting species of high genetic well asofthe profile over rotation to start withmay planting species of highHowever, genetic value, as well observed as the risky country over rotation period (which exceed ten years). the authors that forest profile plantations could and period (which may in exceed ten years). However, the authors observed that forest could and should be developed the next decades, since they play a more prominent roleplantations both in the national should be developed in the next decades, since they play a more prominent role both in the national economy and national strategies to mitigate climate change. Developing forest plantations for wood economy and national strategies to mitigateofclimate change. Developing forestprocessing plantationswill for wood energy, developing sustainable management forests, and improving energy have energy, developing of especially forests, andperi-urban improving forests energy (de processing willethave major positive impactssustainable on the statemanagement of the forests, Wasseige al. major positive impacts on the state of the forests, especially peri-urban forests (de Wasseige et 2010). Sustainable management of natural forests can also be complemented by the developmental.of 2010). Sustainable management of woodlots natural forests can alsoareas be complemented by the development fast-growing tree plantations, such as in degraded and agroforestry systems, with the of fast-growing tree plantations, such as woodlots in degraded areas and agroforestry systems, participation of local communities and entrepreneurs to meet rising demand (Samndong and with the participation of local communities and entrepreneurs to meet rising demand (Samndong and Nhantumbo 2014). Nhantumbo 2014).
Forest plantations currently occupy a limited space in Central Africa, both in terms of area and in terms of production. Several plantation programs took place on the Batéké plateau, located north of Kinshasa in DRC. From 1987 to 1992, over 8,000 hectares of acacias were planted in Mampu and are now managed using an agro-forestry approaches. In the year 2007, only 345 hectares were planted 73 in the DRC. Finally, the makala project specifically aims to encourage agro-forestry plantations in villages (de Wasseige et al. 2010) and planted about 100 ha of Eucalyptus around Kinshasa (de
Forest management and the impact on water resources: a review of 13 countries
Forest plantations currently occupy a limited space in Central Africa, both in terms of area and in terms of production. Several plantation programs took place on the Batéké plateau, located north of Kinshasa in DRC. From 1987 to 1992, over 8,000 hectares of acacias were planted in Mampu and are now managed using an agro-forestry approaches. In the year 2007, only 345 hectares were planted in the DRC. Finally, the makala project specifically aims to encourage agro-forestry plantations in villages (de Wasseige et al. 2010) and planted about 100 ha of Eucalyptus around Kinshasa (de Wasseige et al. 2014). Ten thousands of hectares of Hevea plantation are distributed all along the Congo River and its tributaries around Kisangani. Unfortunately, though the plantations are still in place, political instability has stopped latex production (de Wasseige et al. 2014). In the view to create a buffer zone around protected areas, 5,000 ha of Arcacia plantations have been under development since 2005 around the Virunga Park, under the Ecomalaka Project. This project aimed to develop an alternative activity to wood-cutting and poaching within the Park (de Wasseige et al. 2014). Although the development of forest plantations has been positive in term of boosting the economy and the GDP of the country, its impact on forest hydrology in term of quality and quantity has been observed on other regions of the world. Putzel et al. (2008) and Karsenty (2010a) noted that future deforestation may be driven largely by the expansion of palm oil plantations into forest regions. Virtually all of the dense humid (high carbon) forests of the DRC are on soils and in climatic conditions that are suitable for palm oil production (Tollens 2010). The main question remains to identify and investigate the impact of forest plantations on the hydrology of these Congo forests.
6.3 Politics Since the beginning of the XXI century, the Government begun a national dialogue aiming to inform the legislative reforms considered to reinforce the follow-up of the forest industry activities, to stop illegal exploitation, fight against deforestation, and to increase the role of local populations in the management of forests. These efforts led to the adoption of the Forest Code law #011/2002 (August 29, 2002), in replacement of the colonial rules and create a more favorable foundation to a sustainable and socially responsible management of the forests in RDC. Still in 2002, the Government of the RDC put a moratorium in place on the distribution of new concessions for logging, followed in 2005 by a legal investigation of all forest titles that aimed to convert those in forest concessions, so that these respected the new code that implied a long list of environmental and social conditions concerning the logging (a process that succeeded in 2009). The results of the conversion process established the base for a great transparency in the forest sector in RDC: for the first time, complete and actualized information on the exploitation titles have been accessible to the public and debated with the local and international concerned institutions. The article #103 of the Forest Code of 2002 gave the right to forest concessionaires or operators to access public ways of evacuation (roads, tracks, sorting paths or railroad, rivers) but without any hindrance by the occupant or the concessionaire on the crossed domain. In addition, the Article #48 of the same code forbids any deforestation within a distance of 50 meters on both sides of the rivers and within a radius of 100 meters from their sources. However, Lindquist et al. (2010) identified a high occurrence of deforestation along the axes of transportation (rivers and roads); water resources pollution is still being reported consequently to agricultural, industrial, mining, and petroleum activities (Saudi 2005) within and around the Congo forest. Although the decree #08/08 (April 08, 2008) considers quality and quantity of water resources (surface and ground water) as one of the factors to assess the environmental impacts owing to forest exploitation, and the law #15/026 (December 31, 2015) related to key points for the protection of water resources in the DRC, it has been observed that in reality, less efforts have been applied to reduce or eradicate the impacts of forest exploitation on water resources.
74
ng its tributaries in both the northern and southern hemispheres, the Congo River flows ghout the year. Its flow has for years remained between the high level of 65,411.92 m3/s (in and the low level of 21,407.54 m3/s (in 1905). However, during the unusual flood of 1962 Chapter 6. Forest Management and Water in the Democratic Republic of Congo e highest for a century, the flow probably exceeded 73,623.8 m3/s. At Kinshasa flow gaugin 6.4 Climate change and the future of forestry & forest research n, the river's regime is characterized by a main peak flow at the end of the year and a secon Water resources in May, as well as by a major low flow during July and a secondary low flow between Mar Having its tributaries in both the northern and southern hemispheres, the Congo River flows throughout April. In reality, the downstream regime of the Congo river represents a climatic influence the year. Its flow has for years remained between the high level of 65,411.92 m /s (in 1908) and the ded over low 20°level of oflatitude onm both sidesHowever, of the during equator, a distance about 2,253 km. Owing t 21,407.54 /s (in 1905). the unusual flood ofof 1962, by far the highest for a century, the flow probably exceeded 73,623.8 m /s. At Kinshasa flow gauging station, the river’s nse size and distribution of its tributaries on both sides of the equator, the weather pattern i regime is characterized by a main peak flow at the end of the year and a secondary peak in May, ular region would have effect overall low river's levels (Chishugi 2008); thus, as well as bynot a major lowmuch flow during Julyon andthe a secondary flow between March and April. In reality, the downstream regime of the Congo river represents a climatic influence extended over 20° ll Congo offlows are more constant than many other African rivers (Brummett et al. 2008). latitude on both sides of the equator, a distance of about 2,253 km. Owing to its immense size and 3
3
3
distribution of its tributaries on both sides of the equator, the weather pattern in one particular region not have much effect et on al. the overall river’s levels (Chishugi 2008); thus, in overall Congoreview flows eviously would mentioned, Alsdorf (2016) give a detailed and comprehensive are more constant than many other African rivers (Brummett et al. 2008).
on the logy of the Congo river. Figure 2 shows discharge values from mid-1906 to mid-2010 for t As previously mentioned, Alsdorf et al. (2016) give a detailed and comprehensive review on the hasa gaugehydrology and from 2007 for2 the Bangui gauge. Themid-1906 authorstoused lowforflows as the of the1936 Congoto river. Figure shows discharge values from mid-2010 the gauge and from 1936 to 2007 for the at Bangui gauge. The authors used low flows asand the ends in l delineator;Kinshasa thus, the Congo River water year Kinshasa starts in early August water year delineator; thus, the Congo River water year at Kinshasa starts in early August and ends Oubanguiin River year, onwater theyear, other hand, in early April, ending inMarch. late March. U late July.water Oubangui River on the otherstarts hand, starts in early April, ending in late Using daily streamflow values 2001 to 2010 reported fromKinshasa-Brazzaville the Kinshasa-Brazzaville gauge, streamflow values from 2001 to from 2010 reported from the gauge, the au the authors estimated an annual 3 flow of 40,662 m /s, which is in agreement with the 40,612 3 m /s ated an annual of 40,662 m /s, is in theof40,612 m /s1902 reported by reportedflow by Laraque et al. (2013), whowhich calculated theiragreement average fromwith a century data between and 2010. who calculated their average from a century of data between 1902 and 201 ue et al. (2013), 3
3
e 2. EvolutionFigure of Congo River of discharge at discharge Kinshasaatand Oubangui River River discharge at Bangui. 2. Evolution Congo River Kinshasa and Oubangui discharge at Bangui. Dots are the a Dots are the average of daily discharge values for a given water year (Source: Alsdorf et al. 2016). y discharge values for a given water year (Source: Alsdorf et al. 2016).
bove is interesting because the Congo River discharge has varied considerably between 196 75 995, and it is only now returning to its long-term average. In the view of the impact of fore gement on water resources, a question rises on the factors that control the discharge of the
Forest management and the impact on water resources: a review of 13 countries
The above is interesting because the Congo River discharge has varied considerably between 1960 and 1995, and it is only now returning to its long-term average. In the view of the impact of forest management on water resources, a question rises on the factors that control the discharge of the Congo River. An increase (twice) of the net deforestation during the 2000-2005 period was observed in the DRC, while this was the period when the Congo discharge is returning to normal (see Figure 2, from 2003 to 2006 for Kinshasa gauge). Could this reflect the effect of deforestation on runoff and stream flow? Several authors reported an increase of discharge with tree cutting but the proportion of the cleared area was about 20% of the catchment size. This is one of many cases in the Congo basin that need more attention. On the time that it takes for water masses to leave their initial basins until their arrival at BrazzavilleKinshasa gauge, Bricquet (1995) in Alsdorf et al. (2016) gave the following estimates: two months from the confluence of the Lualaba and Elila Rivers to Brazzaville; one month from the confluence of the Kotto and Oubangui Rivers; and about 15 days from the confluence of the Loange and Kasai Rivers. These numbers can help assesing the movement of pollution, as well as flooding, generated ftom a particular region in the country.
Spatial distribution of water resources In order to understand and evaluate the spatial and temporal distribution of water resources of the Congo Basin, a distributed GIS-based hydrological model, named Hybrid Atmospheric and Terrestrial Water Balance (HATWAB), was developed and parameterized for the Congo basin using GIS and computational hydrology techniques (Chishugi and Alemaw 2009). The model simulated water balance components by taking rainfall-runoff processes in the basin including soil-texture controlled moisture in the terrestrial system and the vertical integrated moisture convergence that accounts for the net water vapor flux from the basins in order to close the hydrologic water budget. Figure 4 illustrates the simulated spatial distribution of precipitation (A), actual evapotranspiration (B), soil moisture (C), and total runoff (D), among other variables, for the Congo basin. The simulated annual total runoff (Figure 3) varies between 0 and 1945 mm with a mean annual runoff of 342 mm, indicating a general trend strongly influenced by the distribution patterns of precipitations. The lowest runoff values are located in central wetlands and the south-eastern region of the country. Apart from lakes and wide rivers, the highest runoff values are located in the heart of the equatorial forest, and decrease progressively towards the tropics. This trend is relatively correlated with soil types, especially in the south-eastern portion of the country, in the wetland regions and along the main Congo river. The AET varies between 400 and 1700 mm/year with highest values, excluding lakes and water pools, around the equator and the Oriental provinces, between -5 and 5 degrees of latitude. The moisture convergence (negative values) and the moisture divergence fluctuate around the equator during different seasons, winter and summer seasons occurring in the two main climatic regimes of the basin.
Climate Change simulation and impact on water resources for the DRC According to Ludwig et al. (2013), there is no enough information about the impacts of climate change on the Central African Region. Few authors (Tshimanga and Hughes 2012, CSC 2013, Ludwig et al. 2013, de Wasseige et al. 2015) reported climate change vulnerability in regards to hydrology, agriculture, forest functioning, and hydropower. The DRC, as well as the entire Congo basin region, is going to experience an increase in climate variability and changes in the hydrological systems, and will experience more intense rainfall and flash floods during the wet seasons, while the dry seasons could become wetter. Just like other forests types, the forest ecosystems in the region are sensitive and exposed to the changing climate, which will further be exacerbated by other drivers such as land use change, land fragmentation, and over exploitation of forest resources (Sonwa et al. 2012 in Tsalefac et al. 2015). 76
dry seasons could become wetter. Just like other forests types, the forest ecosystems in the region are sensitive and exposed to the changing climate, which will further be exacerbated by other drivers such as land use change, land fragmentation, and over exploitation of forest resources (Sonwa et al. 2012 in Tsalefac et al. 2015). Chapter 6. Forest Management and Water in the Democratic Republic of Congo
Figure 3. Water resources of the Congo Basin in terms of mean annual values. Precipitation (A), Actual Evapotranspiration (B), Soil moisture (C), Total runoff (D). 5.E and 5.F illustrate the simulated vertically integrated moisture convergence C in Jun to Aug and Dec to Feb, respectively (own data, Chishugi 2008).
In humid tropical Africa, the repercussions of past climate variations on watercourses have caused a In humid tropical Africa, the repercussions of past climate variations on watercourses have caused decreaseaofdecrease about 32% of the to thetoAtlantic Ocean. (2009),ononthethe other of about 32%rivers of theflowing rivers flowing the Atlantic Ocean.Conway Conway et et al. al. (2009), hand, reported an increase in increase precipitation, which started to be to noticed at the beginning other hand, reported an in precipitation, which started be noticed at the beginningofofthe the 1990s in certain of Basin, the Congo Basin,to leading to an increase flow in certain watercourses.In most in certain1990s regions of theregions Congo leading an increase in flowin in certain watercourses. In most scenarios used by Beyene et al. (2013), the authors found that runoff is increasing by 15% scenarios used by Beyene et al. (2013), the authors found that runoff is increasing by 15% (A (A scenario) and 10% (B1 scenario) all over the Congo Basin by 2050 (Table 3). Previously, a study scenario)byand 10% (B1 scenario) all over the Congo Basin by 2050 (Table 3). Previously, a study by Aerts et al. (2006) using a different dataset, the authors exhibited a runoff increase of 12% in the Aerts et al. (2006) different dataset,increasing the authors exhibited a runoff increase of 12%et in Congo Riverusing basin.aRunoff is especially in the central and western DRC (Tsalefac al.the 2015).basin. Runoff is especially increasing in the central and western DRC (Tsalefac et al. Congo River 2015). Beyene et al. (2013) also found the river flow to be consistent with projected runoff changes, using multi-modal average annual flows documented at Kinshasa gauging station. They concluded that
discharge is projected to increase between by 2050,with depending on therunoff emission scenariousing Beyene et al. (2013) also found the river flow11toand be17% consistent projected changes, and by 27 to 38% by 2080, compared to the historical period (1960-2000, Table 4). Increased multi-modal average annual flows documented at Kinshasa gauging station. They concluded that discharge changes have been especially observed during wet seasons (October, November, and dischargeDecember). is projected to increase between 11 and 17% by 2050, depending on the emission scenario Ludwig et al. (2013) found similar results on the changes in mean flow using different and by 27 to 38% by 2080, to the historical period (1960-2000, Tableuncertain 4). Increased approaches (Figure 4).compared During the dry season, however, Beyene et al. (2013) found results, that flows increaseobserved or decrease. They wet notedseasons that, though total water availabilityand is dischargestating changes havecould beenboth especially during (October, November, likely to increase in the future, this does not mean that droughts or low flow frequencies will decrease December). Ludwig et al. (2013) found similar results on the changes in mean flow using different in the future. For all their scenarios, the difference in discharge between the dry and wet seasons are approaches (Figure 4). During the dry season, however, Beyene et al. (2013) found uncertain results, increasing, indicating that both wet and dry extremes could increase in the future, towards a more stating that flowsand could bothclimate increase orIndecrease. They noted that, totalatwater availability is seasonal tropical type. general, the discharge of thethough Congo river Kinshasa has likely to been increase in the“normally” future, this thattodroughts or low flow frequencies will decrease rerunning sincedoes 1995.not It ismean important highlight the climatic disturbances observed in the far north-western zone of the DRC, in the Ubangi watershed, whose river reached its lowest level in 100 years in 2012, at Oubangi streamflow gauging station (Beyene et al. 2013).
81
77
Forest management and the impact on water resources: a review of 13 countries Table 3. Summary of change in precipitation, evapotranspiration and runoff across the Congo basin using climate change scenarios (30-year average change not weighted) for the 2050s and 2080s, for SRES A2 (high) and B1 (low) emission scenarios, expressed as percent change of the historical base simulation (1960-2000) (Beyene et al. 2013) Precipitation Climate Model
A2
Evapotranspiration
B1
A2
Runoff
B1
A2
B1
2050 2080 2050 2080 2050 2080 2050 2080 2050 2080 2050 2080
CNCM3
+8
+12
+10
+6
+8
+11
+8
+9
+12
+15
+10
+9
ECHAM5
+6
+21
+8
+15
+13
+17
+3
+5
+16
+60
+24
+42
IPSL4
+11
+9
+5
+13
+9
+12
+9
+11
+19
+6
-3
+20
Multi-model average
+8
+14
+8
+11
+10
+10
+7
+8
+15
+27
+10
+23
Table 4. Projected relative changes in annual average flow for the Congo river at Kinshasa, for two future periods, expressed as percent change, compared to the time period 1960-2000. Three different climate models were used, in combination with a high-emission scenario (A2) and a low-emission scenario (B1) (Beyene et al. 2013) 2036 – 2065
2071 – 2100
A2
B1
A2
B2
CNCM3
20 %
5%
27 %
17 %
ECHAM5
23 %
28 %
73 %
46 %
IPSL4
8%
1%
14 %
18 %
Multi-model average
17 %
11 %
38 %
27 %
Climate Model
In addition to analyzing the average flows, Ludwig et al. (2013) also looked at changes in high flows (Q95) and low flows (Q10) (Figure 4). According to the authors, high flows are increasing more than average flows in most parts of the region. Throughout large parts of the region, high flows are increasing more than 25% for the high-emission scenario (A2). The impact under the low-emission scenario (B1) is less severe, but high flows are increasing throughout most of the region, even under the low-emission scenario. Similarly, low flows decreased over a larger area, compared to the average flow (Figure 4). Additionally, most climate scenarios indicate an increase in flows during the wet season, while during the dry season more scenarios show lower flows. Based on Beyene et al. (2013)’s climate change model, increased evaporation will be observed in most of the DRC. The change is evenly distributed throughout the basin but the increase in evaporation will be slightly higher towards the edge, compared to the central Congo Basin. On average, the increase in evaporation by the end of the century will be about 10% for the A2 emission scenario and 8% for the B1 scenario (Table 4).
78
Chapter 6. Forest Management and Water in the Democratic Republic of Congo
Figure 4. Projected changes in mean flow (a), high flow (Q95) (b), and low flow (Q10) (c), for the 2071-2100 period, relative to the 1971-2000 period, averaged for the three different climate models (GCMs), considering both the high- (A2) and low- (B1) emission scenarios (Ludwig et al. 2013).
An illustrative example on the impact of climate change on water availability and supply An illustrative example on the impact of climate change on water availability and supply
In order to emphasize the vulnerability and adaptation to climate in the DRC, we present the results of ordercarried to emphasize the vulnerability and adaptation to climate in the DRC, werainfall presentrecords the results aInstudy by UNFCCC (2009) in the following sections. This research used from of a study carried by UNFCCC (2009) in the following sections. This research used rainfall records 17 stations, representing the four main hydrologic watersheds in the DRC, which coincide with the from 17 stations, representing the four main hydrologic watersheds in the DRC, which coincide with four climate areas of the country defined by the climate change projection models, for the year 2100. the four climate areas of the country defined by the climate change projection models, for the year Owing to the disparity of the observation periods and the number stationsofper sub‐basin, the data 2100. Owing to the disparity of the observation periods and theof number stations per sub-basin, had to be homogenized by considering the stations that has provided the longest series. These the data had to be homogenized by considering the stations that has provided the longest stations series. are: Boma (Climate Kinshasa/Binza (Climate Area II), BukavuArea (Climate Area III), and Area These stations are: Area BomaI),(Climate Area I), Kinshasa/Binza (Climate II), Bukavu (Climate Lubumbashi/Kipopo (Climate(Climate Area IV).Area TheIV). dataThe relating to these to hydrologic sub‐basins are included III), and Lubumbashi/Kipopo data relating these hydrologic sub-basins are included Table 5. This surface water resources per sub‐basin hydrologicand sub-basin in Table 5.inThis surface water resources assessmentassessment per hydrologic climate and area climate is area is presented presented in Table in 6. Table 6. The numbers obtained from the UNFCCC report (2009) are similar to those from Beyene et al.
The numbers obtained fromestimated the UNFCCC report (2009) are similar to those from BeyeneLudwig et al. et al. (2013), though the latter higher precipitation and temperature. Moreover, (2013), the some latter estimated higher precipitation andontemperature. Moreover, et al. (2013) though noted that bias corrections were operated Beyene et al.’s results.Ludwig From all the 20 global circulation models available in the MAGICC/SCENGEN 5.3 package, only five (CCSM-30, (2013) noted that some bias corrections were operated on Beyene et al.’s results. From all the 20 GFDLCM20, GFDLCM21, GISS-EH, andMAGICC/SCENGEN GISS-ER models) are within acceptable global circulation models available in the 5.3concordant, package, only fivean (CCSM‐30, margin of uncertainty, with the climatic parameters observed in DRC. Table 7 gives an overall GFDLCM20, GFDLCM21, GISS‐EH, and GISS‐ER models) are concordant, within an acceptable summary of the range of projected variations (extreme values, minimum and maximum, across both margin of uncertainty, with the climatic parameters observed in DRC. Table 7 gives an overall scenarios) for the years 2010, 2025, 2050, and 2100, with regard to temperature (°C), precipitation summary of the range of projected variations (extreme values, minimum and maximum, across both (%), and atmospheric pressure (hPa) throughout the entire country (UNFCCC 2009). The annual rain and temperature trends (Table 8) and water volume trends (Table 9) for each geographical area, indicate an increase of rain over most of the country and a reduction of which the dimension
83
79
Forest management and the impact on water resources: a review of 13 countries
is worsening with effect from Area 3 (Maniema), passing through the coastal fringe regions (LowCongo), and finally in Area 4 (especially the extreme South of the country, including Katanga). Table 5. Annual or seasonal acreage and rainfall averages of the hydrologic sub-basins or climate areas (UNFCCC 2009) Hydrologic Sub-basin
Composition
Acreage (Km2)
Average Annual Pp (mm) 2005
54,078
1,000
1,251,396
1,800
I
Lower-Congo
II
Kinshasa + Bandundu + Equator + Eastern Province + 1/4 Western Kasai
III
North Kivu + South Kivu + Maniema + 3/4 Eastern Kasai
382,965
1,700
IV
Katanga + 3/4 Western Kasai + 1/4 Eastern Kasai
656,656
1,100
Table 6. Surface water resources assessment per climate area (UNFCCC 2009). Climate Area
Total Volume (litres)
Evaporation (%)
Flow & Infiltration (litres)
I
540,780 x 108
77
124,379 .40 x 108
II
22,525,128 x 108
77
5,180,779.44 x 108
III
6,510,405 x 108
80
1,302,081.00 x 108
IV
7,223,216 x 108
84
1,155,714.56 x 108
Table 7. Field of climatic parameter variation after projection with the model (UNFCCC 2009). Parameter
2010
2025
2050
2100
Temperature (°C)
0.45 to 0.52
0.91 to 1.03
1.72 to 2.08
2.69 to 3.22
Precipitation (%)
0.3 to 2.5
0.4 to 4.2
0.3 to 7.5
0.8 to 11.4
-0.08 to -0.006
-0.16 to -0.13
-0.29 to -0.25
-0.5 to -0.39
Atmospheric Pressure (hPa)
Table 8. Annual Average rain (mm) and temperature (ºc) trends of the four climate areas (UNFCCC 2009). Climate Area I
II
III
IV
80
Town/Marker Years Boma/ Matadi
Kinshasa
Kindu
Lubumbashi
Rain (mm)
Temperature (°C)
2005
1000
25.2
2050
900
28.4
2100
850
29.1
2005
1800
25
2050
1840
27.5
2100
1900
28.2
2005
1700
25.2
2050
1650
28.2
2100
1630
29.1
2005
1100
20.4
2050
1000
23.7
2100
900
24.7
Chapter 6. Forest Management and Water in the Democratic Republic of Congo
The details perceptible from the monthly totals distinctly predict a shortening of the rainy season period, which increases as one approaches the extreme south of the country. Katanga in particular, will have, in the long run - as from 2020 -, a rainy season of less than 5 months, compared to the current 7 months. On the one hand, the entire country will continue to suffer from global warming (UNFCCC 2009). The total volume delivered by the Congo River, which has been estimated on the basis of its average flow, is 40,000 m3/s (or 4 x10⁷ l/s), i.e. a volume of 126,144 x1010 liters in a year. Therefore, the Congo Basin empties 1,262,304 x 109 liters of water into the Atlantic Ocean every year (UNFCCC 2009). Table 9. Water volume trend (in liters) for each geographical area in the DRC (x 108). Values in brackets give the water volume trend as percentages per climate area Parameter I. Boma - Matadi II. Kinshasa III. Kindu IV. Lubumbashi TOTAL
2005
2050
2010
124,380
111,940
105,720
(1.6 %)
(1.4 %)
(1.30 %)
5,180,779
5,295,907
5,468,600
(66.7 %)
(68.6 %)
(70.4 %)
1,302,081
1,263,784
1,248,466
(16.8 %)
(16.3 %)
(16.1 %)
1,155,715
1,050,649
945,585
(14.9 %)
(13.7 %)
(12.2 %)
7,762,955
7,722,280
7,768,371
(100 %)
(100 %)
(100 %)
Conclusions and recommendations It is clear that more work is needed in the Democratic Republic of Congo to fully understand the relationship between forests and water systems. With enough research, the creation of effective politics will be possible. For the mean time, the authors recommend to find and apply BMPs that have been effective in other countries, under similar climatic conditions, in order to minimize the adverse effects of forest logging and plantations on the quality and quantity of water resources. Paired watershed studies have been common in the USA, Canada, Brazil, Australia, and South Africa, among many other countries. However, no even a single case has been reported for the Congo basin. This could be a starting point as the methods and results are available for comparison. Research teams can be organized through academic institutions as several universities around the country run programs on water, biology, soil, and the environment.
6.5 References Alsdorf, D., E. Beighley, A. Laraque, H. Lee, R. Tshimanga, F. O’Loughlin, G. Mahé, B. Dinga, G. Moukandi, and R. G. M. Spencer (2016), Opportunities for hydrologic research in the Congo Basin,Rev. Geophys., 54, 378–409, doi:10.1002/2016RG000517. August, C.M. (2013) Assessment of the effect of land use/cover change on streamflows. MSc. Diss, University of Dar es Salaam Becker, M., Santos da Silva, J., Calmant, S., Robinet, V., Linguet, L. and Seyler, F. (2014), Water Level Fluctuations in the Congo Basin Derived from ENVISAT Satellite Altimetry. Remote Sensing, 6: 9340-9358, doi:10.3390/rs6109340. 81
Forest management and the impact on water resources: a review of 13 countries Bergkamp, G., Orlando, B. & Burton, I. 2003. Change: adaption of water resources management to climate change. Gland, Switzerland, World Conservation Union (IUCN). Bernnett, B. and Kruger, F. (2015). Forestry and water conservation in South Africa: History, Science and Policy. ANU Press. Beyene, T., Ludwig, L. and Franssen, W., 2013. The potential consequences of climate change in the Congo river basin. In: Climate Change Scenarios for the Congo Basin. [Haensler A., Jacob D., Kabat P., Ludwig F. (eds.)]. Climate Service Centre Report No. 11, Hamburg, Germany, ISSN: 2192-4058. Bonnet, M.-P., G. Barroux, P. Seyler, G. Pecly, P. Moreira-Turcq, C. Lagane, G. Cochoneau, J. Viers, F. Seyler, and J.-L. Guyot (2005), Seasonal links between the Amazon corridor and itsflood plain: The case of the varzea of Curuai, inDynamics and Biogeochemistry of River Corridors and Wetlands (Proceedings of symposium S4 held during the Seventh IAHS Scientific Assembly at Foz do Iguaçu, Brazil, April 2005), IAHS Publ., 294. Bosch, J.M., Hewlett, J.D., 1982. A review of catchment experiments to determine the effect of vegetation changes on water yield and evapotranspiration. J. Hydrol. 55, 3–23. Bren, L. (2015). Forest hydrology and catchment management. An Australian perspective. Springer. ISBN: 978-94017-9337-7. Brinkman, W.L.F. 1983. Hydrology. in H. Lieth and M.J.A. Werger (Eds.). Tropical Rain Forest Ecosystems: Biogeographical and Ecological Studies, Pp. 89-98. Elsevier, Amsterdam. Bruijnzeel, L.A., 2002. Hydrological impacts of converting tropical montane cloud forest to pasture, with initial reference to northern Costa Rica. Project Memorandum Form, Project No. R7991 within the Forestry Research Programme of the Department for International Development of the UK, Aylesford, UK, 60 pp. Bruijnzeel, L.A. (2004) Hydrological functions of tropical forests: not seeing the soil for the trees? Agriculture, Ecosystems and Environment 104:185–228. doi:10.1016/j.agee.2004.01.01 Brummett R., Tanania C., Pandi A., Ladel J., Munzimi Y., Russell A., Stiassny M., Thieme M., White S., Davies D., 2009. Water resources, forests and ecosystem goods and services. In: de Wasseige C., Devers D., de Marcken P., Eba’a Atyi R., Nasi R., and Mayaux P. (eds), 2009. The forests of the Congo Basin - State of the forest 2008, Luxembourg: Publications office of the European Union, 411 p, ISBN 978-92-79-13210-0, doi: 10.2788/32259, pp 141-157 Bultot, F. (1972), Atlas Climatique du Bassin Congolais Publications de L’Institut National pour L’Etude Agronomique du Congo (I.N.E.A.C.), Troisieme Partie, Temperature et Humidite de L’Air, Rosee, Temperature du Sol. Bwangoy, J.B., Hansen, M.C., Roy, D.P., De Grandi, G., Justice, C.O. (2009) Wetland mapping in the Congo Basin using optical and radar remotely sensed data and derived topographical indices. Remote Sensing of Environment, 114 (2010) 73-86. Cabral, OMR, Rocha, HR, Gash, JHC, Ligo, MAV et al., 2010. The energy and water balance of a Eucalputus plantation in southern Brazil. Journal of hydrology, 388, 208-216. Calder I., T. Hofer, S. Vermont and Warren, P. 2007. Towards a new understanding of forests and water. Unasylva Vol. 58, No. 229. FAO: Rome. Callède, J., G. Cochonneau, F. Vieira Alves, J.-L. Guyot, V. S. Guimarães, and E. De liveira (2010), Les apports en eau de l’Amazone à l’Océan Atlantique,Rev. Sci. Eau/J. Water Sci., 23, 247–273. Celleri, R. and Feyen, J., 2009. The hydrology of the tropical Andean Ecosystems: Importance, knowledge status, and perspectives. Mountain Research and Development, Vol. 29, 4: 350 – 355. doi: 10.1659/mrd.00007. Chishugi, C.J. (2008), Hydrological Modeling of the Congo River Basin: A Water Balance Approach. MSc. Dissertation, University of Botswana, Botswana. Chishugi, B. J., and Alemaw, B. F. (2009), The hydrology of the Congo River basin: A GIS-based hydrological water balance model. World environmental and water resources congress 2009: Great Rivers, ASCE Conf. Proc., pp. 1–16, doi:10.1061/41036(342)593. Coe, M. T., M. H. Costa, and B. S. Soares-Filho (2009), The influence of historical and potential future deforestation on the streamflow of the Amazon River -Land surface processes and atmospheric feedbacks, J. Hydrol. 369, 165– 174, doi:10.1016/j.jhydrol.2009.02.043. Coe, M. T., E. M. Latrubesse, M. E. Ferreira, and M. L. Amsler (2011), The Effects of deforestation and climate variability on the streamflow of the Araguaia River, Brazil, Biogeochemistry, 105, 119–131, doi:10.1007/s10533-0119582-2. Cornish, PM. (1993), The effects of logging and forest regeneration on water yields in a moist eucalypt forest in New South Wales, Australia. Journal of hydrology, 150, no 2, p301-322. 82
Chapter 6. Forest Management and Water in the Democratic Republic of Congo Costa et al. (2003), Combined effect of deforestation and doubled atmospheric CO2 concentrations on the climate of Amazonia. Climate journal, 13: 18-34. CSC, 2013. Climate change Scenarios for the Congo Basin. Climate Service Centre Report No. 11. Eds, Haesnsler A., Jacob D., Kabat P. and Ludwig F. Hamburg, Germany. 210p. ISSN: 2192-4058 D’Almeida, C., Vorosmarty, C.J., Hurtt, G.C., Marengo, J.A., 2007. The effects of deforestation on the hydrological cycle in Amazonia: a review on scale resolution. International Journal of Climatology. 27 (5): 633- 647. Debroux, L. et al. 2007 (eds). Forests in Post-Conflict Democratic Republic of Congo: Analysis of a Priority Agenda. center for International Forestry Research, World Bank, et al., Bogor. Defourny P., Delhage, C. et Kibambe Lubamba J-P., 2011. Analyse quantitative des causes de la déforestation et de la dégradation des forets en République Démocratique du Congo. UCL/FAO/CN REDD, Kinshasa. De Merode, E. 1998. Protected areas and livelihoods. Contrasting systems of wildlife management in the RDC. PhD dissertation. University College, London. De Wasseige C, de Marcken P, Bayol N, Hiol Hiol F, Mayaux Ph, Desclee B, Nasi R, Billand A, Defourny P and Eba’a Atyi R. 2012. The forests of the Congo Basin: State of the forest 2010. Luxembourg: Publications Office of the European Union, ISBN 978-92-79-22716-5, DOI: 10.2788/47210 Duveiller, G., P. Defourny, B. Desclée et P. Mayaux. 2008. Deforestation in Central Africa: Estimates at regional, national and landscape levels by advanced processing of systematically-distributed Landsat extracts. Remote Sensing of Environment 112: 1969–81. Ellison, D., Futter, M., Bishop, K., 2012. On the forest cover – water yield debate: from demand – to supply –side thinking. Global Change Biology, 18 (3): 806 – 820. Ernst C., A. Verhegghen, C. Bodart, P. Mayaux, C. de Wasseige, A. Bararwandika, G. Begoto, F. Esono, M. Bara, A. Kondjo, H. Koy, J. S. Makak, J. D. Menomo, C. Musampa, R. Ncogo, G. Neba, B. Nkoumakali, C. B. Ouissika, and P. Defourny. 2010. Congo Basin forest cover change estimate for 1990, 2000, and 2005, by Landsat interpretation using an automated object-based processing chain. The International Archives of the Photogrammetry, remote sensing and spatial Information sciences XXXVIII-4/C7. Franken, W. & Leopoldo, P.R. (1984). Hydrology of catchment areas of Central-Amazonian forest streams. In The Amazon (pp. 501-519). Springer Netherland. Furk, K. (1984). Water chemistry of the Amazon basin: the distribution of chemical elements among freshwaters. In The Amazon (pp. 167-199. Springer Netherlands. Garcia-Chevesich, P. 2015a. Erosion control and land restoration. Outskirts Press. Denver, CO. 451 p Garcia-Chevesich, P., R. Pizarro, and R. Valdes. 2015b. How forestry in the southern hemisphere can help address desertification and global climate change. Journal of Forestry 113(1): 72-74. Geist HJ and Lambin EF. 2001. What Drives Tropical Deforestation? A meta-analysis of proximate and underlying causes of deforestation based on subnational case study evidence. pp. xiii + 116 pp. LUCC Report. Germer SH, Elsenbeer H, Moraes JM (2006) Throughfall and temporal trends of rainfall redistribution in an open tropical rainforest south-western Amazonia (Rondonia, Brazil), Hudrol Earth Syst Sci 10:383-393. Giralowski J. (2002), La déforestation en Afrique centrale. Les facteurs de la dégradation des forêts denses humides équatoriales dans la République démocratique du Congo, Varsovie, Editions Académiques DIALOG, 82 p., 3 cartes h.-t. Hamilton, L. 1985. Overcoming myths about soil and water impacts of tropical forest land uses. In S. A. ElSwaify, W. C. Moldenhauer & A. Lo, eds. Soil erosion and conservation, pp. 680–690. Ankeny, Iowa, USA, Soil Conservation Society of America. Hewlett, J.D. and Nutter, W.L., (1968). An outline of the forest hydrology (p.81). Athens, G.A. University of Georgia Press. Hewlett, J.D. and Bosch, J.M., (1984). The dependence of storm flow on rainfall intensity and vegetation cover in South Africa. Journal of hydrology. 75: 365-381. Holme, J.W. and Colville, J.S. (1970). Forest hydrology in karstic region of Southern Australia. Journal of hydrology, 10(1) 59-74. Hornbeck, J.W, Adams, M.B., Corbett, E.S., Verry, E.S., and Lynch J.A. 1993. Long term impacts of forest treatment on water yield: a summary of the Northeastern USA. Journal of Hydrology 150: 323-344.
83
Forest management and the impact on water resources: a review of 13 countries Hughes, D. A., R. M. Tshimanga, S. Tirivarombo, and J. Tanner (2014), Simulating wetland impacts on streamflow in southern Africa using a monthly hydrological model, Hydrol. Processes, 28, 1775–1786, doi:10.1002/hyp.9725. Hulme, M. and Viner, D.: 1995, A Climate Change Scenario for Assessing the Impact of Climate Change on Tropical Rain Forests. A report prepared by the Climate Research Unit for WWF (U.S.A.), Univ. East Anglia, U.K., p. 34. Ice, G.G. and Stednick, J.D. 2004. Introduction. In A century of forest and wildland watershed lessons, ed. G.G. Ice and J.D. Stednick. Bethesda, MD: Society of American Foresters. Ickowitz A, Slayback D, Asanzi P and Nasi R. 2015. Agriculture and deforestation in the Democratic Republic of the Congo: A synthesis of the current state of knowledge. Occasional Paper 119. Bogor, Indonesia: CIFOR. ISBN 978602-1504-67-3. Jirka, S., McDonald, A.J., Johnson, M. S., Feldpausch, T.R., Couto, E.G. & Riha, S.J. 2007. The relationships soil hydrology and forest structure and composition in the southern Brazilian Amazon. Journal of Vegetation Science, 18(2), 1983-194.between Jofré, P., C. Büchner, R. Ipinza, C. Bahamondes, S. Barros, P. García, and J. Cabrera. 2014. State of the art on water and forest plantations (Spanish). Agricultural Innovation Foundation (FIA) and Forest Institute of Chile (Infor). Government of Chile. Ministery of Agriculture. 120 p. Karsenty, A. 2010a. Large-Scale Acquisition of Rights on Forest Lands in Africa. Rights and Resources Initiative, Washington, D.C. Laraque, A., M. Bellanger, G. Adèle, S. Guebanda, G. Gulemvuga, A. Pandi, J. E. Paturel, A. Robert, J. P. Tathy, and A. Yambele (2013), Recent evolution of Congo, Oubangui and Sangha Rivers flows, Académie Royale des Sciences de Belgique, Geogr. Ecol. Trop., 37(1), 93–100. Laurance, W.F., & Williamson, G.B. (2001). Positive feedbacks among forest fragmentation, draught, and climate change in the Amazon. Conservation Biology, 15(6), 1529-1535. Lee, H., Jung, H.C., Alsdorf et al. (2011) Characterization of terrestrial water dynamics in the Congo Basin using GRACE and satellite radar altimetry. Remote Sensing of Environment, 115, 3530-3538. doi:10.1016/j.rse.2011.08.015. Lee, H., Yuan, T, Jung, H.C. and Beighly, E. (2015) Mapping wetland water depths over the the Central Congo Basin using PALSAR ScanSAR, Envisat altimetry and MODIS VCF data. Remote Sensing of Environment, 152, 136-149. Lesack, L.F., 1993. Water balance and hydrologic characteristics of a rain forest catchment in the central Amazon basin. Water Resources Research, 29(3), 759-773. Levia, D.F., Carlyle-Moses, D., Tanaka, T. (2011), Forest hydrology and Biogeochemistry: Synthesis of Past Research and Future. Ecolog. studies. Dordrecht; London: Springer. Lindquist, E., A. Altstatt, M. Hansen, C. Justice, D. Slayback and B. Adusei. 2010. Tree cover cleaning in the Congo Basin from 1990 to 2000 to 2005: Exhaustive monitoring of forest loss with Landsat and MODIS. Note technique en préparation; non publiée. Ludwig F., Franssen W., Jans W., Beyenne T., Kruijt B., Supit I. (2013) Climate change impacts on the Congo Basin region. In: Haensler A., Jacob D., Kabat P., Ludwig F. (eds.) Climate Change Scenarios for the Congo Basin. Climate Service Centre Report No. 11, Hamburg, Germany, ISSN: 2192-4058. Marlier, G. (1973), Limnology of the Congo and Amazon Rivers, inTropical Forest Ecoystems in Africa and South America: A Comparative Review, edited by B. J. Meggers, E. S. Ayensu, and W. D. Duckworth, pp. 223–238, Smithsonian Institution Press, Washington, D. C. Martinez, J.-M., and T. Le Toan (2007), Mapping offlood dynamics and vegetation spatial distribution in the Amazonfloodplain using multitemporal SAR data,Remote Sens. Environ., 108, 209–223. Mbala, S.M., Karsenty, A. 2010. Forest Revenue Decentralization and profits Redistribution in the Democratic Republic of congo. In: German, L., Karsenty, A., and tiani, A-M (eds). Governing Africa’s Forests in a Globalized World. 8. Earthscan, London. Melack, J. M., and L. L. Hess (2010), Remote sensing of the distribution and extent of wetlands in the Amazon basin, in Amazonian Floodplain Forests: Ecophysiology, Ecology, Biodiversity and Sustainable Management, Ecol. Stud., edited by W. J. Junk et al., pp. 43–59, Springer, Dordrecht, Netherlands. Mertes, L.A., Daniel, D.L., Melack, J.M., Nelson, B., Martinelli, L.A. and Forsberf, B.R. (1995). Spatial patterns of hydrology, geomorphology, and vegetation on the floodplain of the c Amazon River in Brazil from a remote sensing perspective. Geomorphology, 13(2), 215-231.
84
Chapter 6. Forest Management and Water in the Democratic Republic of Congo Musampa Kamungandu, C. et al. 2012. Cartographie des bénéfices potentiels liés à la biodiversité dans le cadre de REDD+. République Démocratique du Congo. Préparé par UNEP-WCMC, Cambridge, Royaume-Uni; Ministère de l’Environnement, conservation de la Nature et tourisme de la RDC et l’observatoire Satellitaire des Forêts d’Afrique centrale. Programme ONU-REDD, Kinshasa. National Council for Air and Stream Improvement, Inc. (NCASI). 2009. Effects of forest management on water resources in Canada: A research review. Technical Bulletin No. 969. Research Triangle Park, N.C.: National Council for Air and Stream Improvement, Inc Neary, D., Hayes, D., Rustad, L., Vose, J, Gottfried, G., Sebesteyn, S. et al., (2012). US Forest Service Experimental Forests and Ranges Network: a continental research platform for catchment-scale research. Revisiting Experimental Catchment Studies in Forest Hydrology, 49-57. Nelson, J., Kipalu, p., Vig, S. The Forest Dialogue: Field Dialogue on Free and Informed Consent. Bas Congo and Kinshasa the Democratic Republic of Congo. Background Paper, Forest peoples programme, Moreton-in-Marsh, 21-25 May 2012 Nepstad, D., Lefebvre, P., Lopes da Silva, U. et al, 2004. Amazon drought and its implications for forest flammability and tree growth: A basin-wide analysis. Global change biology, 10(5), 704-717. Nobrega, R.L.B., Guzha, A.C., Torres, G.N., Kovacs, K., Lamparter, G., … & Gerold, G. (2016), Identifying hydrological responses of micro-catchments under contrasting land use in the Brazilian Cerrado. Hydrol. and Earth System Sci. Discuss., 12, 9915-9975, 2015. OSFAC, 2010. Forêts d’Afrique centrale évaluées par télédétection FACET. Étendue et perte du couvert forestier en république démocratique du Congo de 2000 à 2010. Publié par l’université d’État du dakota du sud, Brookings, dakota du sud, États-unis d’Amérique. ISBN: 978-0-9797182-5-0. Site web: http://osfac.net. Pereira, H.C., 1962. Hydrological effects of changes in land use in some South African catchment areas. East Afr. Agric. For. J., Spec. Iss, 27, 131pp. Putzel, J., Sefan, L., Schouten, c. 2008. Drivers of Change in the Democratic Republic of Congo: The Rise and Decline of the State and Challenges for Reconstruction. Working Paper No 26, Destin Development Studies Institute, London. Ruprecht, J.K., Schofield, N.J., Crombie, D.S., Vertessy, R.A. and Stoneman, G.L. (1991). Early hydrological response to intense forest thinning in southwestern Australia. Journal of hydrology, 127(1), 261-277. Samndong, R.A. and Nhantumbo, I., 2014. Natural resources governance in the Democratic Republic of Congo: Breaking sector walls for sustainable land use investments. IIED Country Report. IIED, London. http://pubs.iied. org/13578IIED, ISBN 978-1-78431-132-2 Saudi, K. K. (2005). National Nile Basin Water Quality Monitoring Baseline Report for the Democratic Republic of Congo. Nile Basin Initiative - Transboundary Environmental Action Project. Final version: 5/8/2005 Sonwa D.J., Nkem J.N., Idinoba M.E., Bele M.Y. and Jum C., 2012a. Building regional priorities in forests for development and adaptation to climate change in the Congo Basin. Mitigation and Adaptation Strategies for Global Change, 17(4): 441-450. Doi0.1007/s11027-011-9335-5. Tchatchou B, Sonwa DJ, Ifo S and Tiani AM. 2015. Deforestation and forest degradation in the Congo Basin: State of knowledge, current causes and perspectives. Occasional Paper 144. Bogor, Indonesia: CIFOR. DOI: 10.17528/ cifor/005894, ISBN 978-602-387-021-9. The forests of the Congo Basin – State of the Forest 2013. Eds: de Wasseige C, Flynn J., Louppe D., Hiol Hiol F, Mayaux Ph, - 2014. Weyrich. Belgium. 328 p. ISBN 978-2-87489-299-8, DOI: 10.2788/47210 Tslefac, M., Hiol Hiol, F., Mhe, G., Laraque, A., Sonwa, D., … & Doumenge, C. (2015) Climate of Central Africa: Past, present and future. In de Wasseige C, Tadoum M., Eba’a Atyi R and Doumenge C. (ed), The Forest of the Congo 2015– Forests and climate change. Weyrich. Belgium. 128 p. ISBN: 978-2-87489-355-1. Tshimanga, R.M., D.A. Hughes, and E. Kapangaziwiri (2011), Initial calibration of the Pitman rainfall-runoff model for the Congo River basin, Phys. Chem. Earth, 36, 14 – 15. Tshimanga, R.M., Hughes, D.A. Climate change and impacts on the hydrology of the Congo Basin: The case of the northern sub-basins of the Oubangui and Sangha Rivers. J. Phys. Chem. Earth (2012), http://dx.doi.org/10.1016/j. pce.2012.08.002 Tshimanga, R.M., and D.A. Hughes, (2014), Basin-scale performance of a semi-distributed rainfall-runoff model for hydrological predictions and water resources assessment of large rivers: The Congo River. Water Resour. Res., 50, 1174-1188, doi:10.1002/2013WR014310.
85
Forest management and the impact on water resources: a review of 13 countries UNFCCC (2009). Executive Summary report : ″La Communication Nationale Initiale sur les changements climatiques/ RDC″ (@ www.unfccc.int/resource/docs/natc). Van der Zel, D.W. (1974) Catchment research at Zachariashoek. For. in S. Africa. 15:23 -30. Van Wilgen, B.W. (1982) Some effect of post-fire age on above ground plant biomass of fynbos (macchia) vegetation in South Africa. J. of Ecology, 70: 217-225. Van Wyk, DB. (1987) Some effects of afforestation on streamflow in the Western Cape Province, South Africa. Water SA, 13(1) 31-36. Verhegghen A., defourny P., 2010. A new 300 m vegetation map for Central Africa based on multi-sensor times series. In: sobrino J.A. (ed.), Third recent Advance in Quantitative remote sensing. Publicaciones de la universitat de Valencia, Valencia, spain. Wicht, C.L. (1967) Forest hydrological research in S. Afr. Republic. In W.E. Sopper and H.W. Lull (eds) Proceedings of Intern. Symp. on Forestry Hydrology. Penn. State Univ. Pennsylvania, USA. 75-84. West, T.L. 1990. Research in the USDA Forest Service: A historian’s view. Paper presented at the Third Symposium on Social Science in Resource Management, College Station, TX, May 1990. WRI, 2010. Atlas forestier interactif de la république démocratique du Congo. Version 1.0 – données 2009. Document de synthèse. WRL, MECNT. Washington D.C. 68p. Wright, K.I. (2016). Long-term effects of forestry best management practices on the hydrology and water chemistry in three appalachian headwater catchments. Yamba, p.K., 2009. Congo Basin-DRC: Case study on the Ngiri-Tumba-Maindombe Wetland Landscape Environmental Security. Institute for Environmental Security, The Hague. Yanggen d., Angu K. and Tchamou N. (eds), 2010. Landscape-scale Conservation in the Congo Basin: Lessons Learned from the Central African Regional Program for the environment (CARPE). Gland, Switzerland: IUCN. Xiv +262 p.
86
Chapter 7. Forest Management and Water in India Jagdish Krishnaswamy21 (
[email protected])
7.1 Introduction India underwent a major transformation of its landscape and land-cover after approximately 1860, when large parts of the country came under the British Colonial rule (Gadgil and Guha, 1993; Goldewijk and Ramankutty, 2004; Kumar, 2010), spurred by demands for timber destined to shipbuilding, railways, expansion of agriculture, and plantations for tea, further continuing in the postindependence period for dams and reservoirs, agricultural expansion, and refugee resettlement. It is estimated that in the period 1875-1900, roughly one-third of India was cultivated, an equal expanse was forested, and about twenty percent of the land was grassland and savannah-woodlands (Lynch and Talbott 1995; Sivaramakrishnan, 2009). Overall estimates of deforestation are between 40%-50% of original cover lost between 1860s and 1990s. However, according to Laurance 2007, India has already lost nearly 80% of its original native forest cover. Using the best available datasets, his analyses suggest that the remaining native forests in India are declining at a rapid pace, from 1.5% to 2.7% per year. According to data from Global Forest Watch (www.globalforestwatch.org), approximately 100,000 hectares of forest were lost from Arunachal Pradesh, between 2001 and 2013, representing more than one percent of the State’s entire area. A report on the forest cover of Arunachal Pradesh, which is India’s last remaining massive forest landscape, noted that 70 percent of the state was forested in 1988. By computing projected population growth and its resultant resource extraction pressures, the study estimated 50 percent of the State’s forests would be lost by 2021 (Menon et al. 2001).
Regional case: The Western Ghats land-cover change The Western Ghats is one of the global biodiversity’s hotspots and it is an area where some rigorous estimates of forest loss and conversion are available. Menon and Bawa (1997) estimated that out of 81,870 km2 of the southern Western Ghats in Karnataka, Kerala and Tamil Nadu, there was a loss of 40% of the original forest and scrub between 1920 and 1990. Jha et al. (2000) estimated changes in forest cover between 1973 and 1995 in the southern part of the Western Ghats using satellite data. The study area of approximately 40,000 km2 showed a loss of 25.6% in forest cover over 22 years. The dense forest was reduced by 19.5% and open forest decreased by 33.2%. As a consequence, degraded forest increased by 26.64%. By the 1990s, estimated forest cover in India was 20%. According to FAO (2006), the area under forests and other wooded land in India has increased from 63.93 mha in 1990 to 67.70 mha in 2005. Thus, FAO estimates do not significantly differ from the Forest Survey of India (fsi.nic.in) estimates.
State of India’ forests Periodically, the Forest Survey of India publishes statewide forest cover estimates based on automated algorithms using remotely sensed data. A study by Puyravaud et al. (2010) suggests that India has some of the globally most imperiled forests. They state that even as the Forest Survey of India recently announced that forest cover in India had expanded by nearly 5% over the past 21
Suri Sehgal Centre for Biodiversity and Conservation, Ashoka Trust for Research in Ecology and the Environment (ATREE)
87
Forest management and the impact on water resources: a review of 13 countries
decade, this is misleading. They state that methodology fails to distinguish native forests from tree plantations, which are often monocultures of exotic species. They estimate that, since the early 1990s, tree plantations have expanded in India at an estimated rate of roughly 15,400 km2/year. Subtracting plantations from total forest cover shows that native forests in India have declined by 1.5%–2.7% per year.
7.2 Literary Review The large scale transformation of India and loss of forest cover raised concerns about the hydrological consequences of these, and while the early discourse was dominated by the effects of this on rainfall, increasingly the effects of land-cover and land-use change within forests on stream flows and sediment load became an area of policy and management interventions by the colonial Forest department. As loss of forest cover mounted, earlier discussions were dominated by the “dessicationist” discourse, a concern about how loss or degradation of forests could reduce rainfall and was also articulate about the “sponge” functions of intact forests (Saberwal, 1999). The first empirical enquiry into the role of forest cover on sub-surface flows was a “space for time” type of substitution study by Pearson (1907), who measured depth to groundwater in wells located inside and outside forests, and found that depth was 4.74 deeper under forests than outside (Figure 1), perhaps the first empirical study of evapotranspiration by forests in India, even though its value was not recognized as such at that time, even by the author (Saberwal, 1999). Pearson’s study took place in Ghodra Forest Range in Panchmahals, what is now “Gujarat”. As previously mentioned, the depths to groundwater was shallower under the non-forest site (100m outside a forest) compared to the well in the forest (1200m inside a mixed teak forest) and was much more responsive to rainfall as well. The measurements were taken early in the morning to avoid any effects of water abstraction by local people. The difference in depths to groundwater between forest and non-forest Wells from Pearson’s data (Pearson, 1907) was used as a crude index of forest evapotranspiration and the results are consistent with what we know about phenology and evapotranspiration of a dry deciduous forest, with least ET during dry months (January through June), when moisture is limiting, leaves are progressively being shed, and ET is highest during the Monsoon and early post-Monsoon period (July-December), when moisture is available (Figure 2).
Figure 1. The firstfirst forest hydrology (Pearson,1907). 1907). Figure 1. The forest hydrologyobservations observations in India (Pearson, 88
Figure 1. The first forest hydrology observations in India (Pearson, 1907).
Chapter 7. Forest Management and Water in India
Figure 2. Evapotranspiration response of a deciduous forest, Data source: Pearson, 1907.
Figure 2. Evapotranspiration response of a deciduous forest, Data source: Pearson, 1907. 96
The second study was done by E. Benskin on the Indian Forest Service, and consisted of comparative soil moisture measurements under “poor quality” forest and a denuded site in the Monsoon of 1930 in the Chota Nagpur area in what is now Jharkand state (Benskin, 1930). The author made measurementsThe atsecond two depths: 22.86 cm (9 inches) and 68.58 cm (27 inches), the latter depth would study was done by E. Benskin on the Indian Forest Service, and consisted of comparative thus correspond active root activity of“poor treesquality” (Figure 3).and a denuded site in the Monsoon of 1930 in soil to moisture measurements under forest the Chota Nagpur area in what is now Jharkand state (Benskin, 1930). The author made measurements at two depths: 22.86 cm (9 inches) and 68.58 cm (27 inches), the latter depth would thus correspond to active root activity of trees (Figure 3).
Figure 3. Benskin’s soil moisture measurement at two depths under forest and non-forest in the Monsoon of 1930. Data
source: Benskin, 1930. Figure 3. Benskin’s soil moisture measurement at two depths under forest and non-forest in first the researcher Monsoontoof 1930. Data source: Benskin is probably the recognize transpiration by Benskin, forest trees 1930. as a process. He
attributed the difference in soil moisture largely to transpiration demand of the forest and also noted that even in high intensity rains, the forest soil was less prone to saturation compared to the denuded sites, and linked this to possible benefits for flood-regulation (Benskin, 1930).
Benskin is probably the first researcher to recognize transpiration by forest trees as a process. He India’s first forest hydrology experiment attributed the difference in soil moisture largely to transpiration demand of the forest and also noted The consolidation of British colonial administration over the hill and mountain forests of what is now that even in high intensity rains, soil wasthe less prone to saturation compared the denuded Himachal Pradesh soon the after forest 1865 empowered government revenue and forest departmentsto with their separate and often conflicting agendas and interests to manage forest resources. This invariably sites, and linked this to possible benefits for flood-regulation (Benskin, 1930). resulted in control over those dependent on them for their needs. One such group of people is the nomadic pastoral communities that ascended with their flocks of sheep and goats to grazing areas near and above the tree line in summers, descending to lower elevation forests during winters. In 1923, a hydro-electric project was constructed at Barot on Uhl River, in what was then the Punjab Himalayas (Saberwal, 1999; and references therein).
97
89
Forest management and the impact on water resources: a review of 13 countries
India’s first forest hydrology experiment The consolidation of British colonial administration over the hill and mountain forests of what is now Himachal Pradesh soon after 1865 empowered the government revenue and forest departments with their separate and often conflicting agendas and interests to manage forest resources. This invariably resulted in control over those dependent on them for their needs. One such group of people is the nomadic pastoral communities that ascended with their flocks of sheep and goats to grazing areas near and above the tree line in summers, descending to lower elevation forests during winters. In 1923, a hydro-electric project was constructed at Barot on Uhl River, in what was then the Punjab Himalayas (Saberwal, 1999; and references therein). Upstream of this site was the Chota Bangahal catchment in The Western Himalayas, in what is now Himachal Pradesh, covering approximately 283 km2 between 2133 m.o.s.l. to over 4900 m.o.s.l., largely forested with high elevation meadows, and some permanent snow cover was the site of an Upstream of this site was the Chota Bangahal catchment inand The Western Himalayas, in what grazing is now interesting forest hydrologic experiment between 1934 1947. In this period, by over 2 Pradesh, covering approximately 283 km between 2133 to over 4900 m.o.s.l., 95,000 sheepHimachal and goats was stopped, and river discharge andm.o.s.l. rainfall gauged (see Figure 4). It largely forested with high elevation meadows, and some permanent snow cover was the site of an model to this data and annual rainfall 40% of the variability was fitted a regression interesting forest hydrologic experiment between 1934winter and 1947. In this explained period, grazing by over in winter discharge (p40
>84
Protected area
Table 3.4. Water resource elements included in the Forest Management Certification Program (Source: [MC&I (Natural Forest), 2011]. Principle
Criterion
Indicator
Principle #5: Benefits from Forest 5.5 Forest management operations shall recognize, maintain, and, where appropriate, enhance the value of forest services and resources such as watersheds and fisheries.
5.5.1 Implementation of guidelines and/ or procedures to identify and demarcate sensitive areas for the protection of soil and water, watercourses, and wetlands. 5.5.2 Implementation of management guidelines, where appropriate, to maintain and/or enhance the value of forest services and resources.
Principle #6: Environmental Impact 6.5 Guidelines shall be prepared and implemented to: control erosion; minimize forest damage during harvesting, road construction, and all other mechanical disturbances; and protect water resources.
6.5.1 Availability and implementation of harvesting procedures to protect the soil from compaction by harvesting machinery and erosion during harvesting operations. 6.5.2 Implementation of reduced/low impact logging to minimize damage to the environment.
118
6.5.4 Availability and implementation of guidelines for conservation of buffer strips along streams and rivers.
Chapter 8. Forest Management and Water in Malaysia
The Malaysian Criteria and Indicators for Forest Management Certification (Natural Forest) [MC&I (Natural Forest)] have been used as the standard for assessing forest management practices at Forest Management Units (FMUs) for the purpose of certification. The certification program was established in 2002 with MC&I (2002). There are nine principles in that version of the MC&I; Principle #1 was the requirement to comply with all relevant national and local laws, regulations, and policies related to forest management. Table 3.4 shows the criteria and indicators for the management of production forests that are closely related to the protection water resources. In addition to the MC&I (Natural Forest) for forest management, the “MC&I Forest Plantation v2” was published in February 2015 as the standard for forest plantation management certification. The criteria and indicators applicable to water resource management are similar to those in MC&I (Natural forest).
8.4 Climate change and the future of forestry & forest research 8.4.1 Possible effects of climate change on water resources in Malaysia The National Hydraulic Research Institute of Malaysia (NAHRIM) conducted a study in collaboration with the California Hydrologic Research Laboratory (CHRL) on the impact of climate change on the hydrologic regime and water resources in the country. The first part of the study was conducted for Peninsular Malaysia from 2002 to 2006, and the second part for Sabah and Sarawak from 2007 to 2010 (Nahrim, 2006). This study stemmed from the National Water Resources Study in 2000,which recommended the development of a regional climate model. The Regional Hydroclimate Model (RegHCM) developed from this study was used to predict the impact of climate change until the year 2050. The RegHCM-PM of Peninsular Malaysia was validated by historical atmospheric data (rainfall and temperature) and hydraulic data (streamflow) for a 10-year period (1984–1993). The future hydroclimate simulations were carried out for two periods (2025–2034 and 2041–2050) and then compared with the corresponding data from the 1984–1993 periods. The parameters used in the assessment were air temperature, rainfall, ET, soil water storage, and river flow. The results were shown as graphic displays spatially distributed over Peninsular Malaysia at monthly and annual intervals, and also in terms of their areal averages over 11 defined subregions of Peninsular Malaysia at monthly intervals. An assessment was also conducted of the water balance of monthly river flows at selected watersheds in Klang, Selangor, Terengganu, Kelantan, Pahang, Perak, and Kedah of Peninsular Malaysia. The comparisons were also shown by graphic displays of monthly flow values. Then the statistical tests of significance were carried out for the periodic mean monthly flows corresponding to the historical and future periods. The results of the analyses indicated an expected increase in inter-annual and intra-seasonal variability, with increased hydrologic extremes (higher high flows, and lower low flows) in the Kelantan, Pahang, Terengganu, and Kedah watersheds in the future. The statistical tests indicated that the differences between past and future in high monthly flows during October and November at watersheds located in Terengganu, Kelantan, Pahang, and Perak are statistically significant at the 95% level. In these watersheds the trend is toward higher flows during the already high flow months of October and November. The report noted the high reliability of these inferences due to the low signal to noise ratios obtained for the differences between future and past monthly periodic mean flows. The low signal to noise ratios were due to the shortness of the simulation period (20 years). A similar study method was also applied for the implementation of the hydroclimate model (RegHCMSS) in Sabah and Sarawak (Nahrim, 2010). The findings indicated that there will be an increase of about 4oC in air temperature throughout Sabah and Sarawak by year 2050. In terms of annual rainfall, Sabah was expected to experience some dry and wet years, but the trend was not clear for Sarawak. There were no clear differences between the historical and future periods identified in Sabah and Sarawak. 119
Forest management and the impact on water resources: a review of 13 countries
The study also suggested that the impact of global climate change on the streamflows in the Sabah and Sarawak regions would vary by location within the region. The impact is also predicted to vary with seasons and time intervals. Kinabatangan, Padas, and Kadamaian Watersheds in Sabah are expected to have water supply problems in the future, while a significant flooding problem is expected throughout Sabah and Sarawak.
8.4.2 Effects of extreme weather events of flood and drought to water resources In the past, the Northeast (NE) Monsoon (November – February) was a standard annual event in the eastern part of Malaysia. But in 2014, Malaysia experienced changes in the weather pattern that affected the water supply in the country especially in Selangor state. The drought started in January and continued to the end of March. In the Selangor Dam the water level gradually decreased from 206 to 190 m (16 m difference). Some rainfall was received in April (inter-monsoon) that increased the water level, but it slowly dropped in June because the Southwest (SW) Monsoon also brought less rainfall than usual. Water levels in the dam almost reached a critical stage (185 m) in September. The rainfall started to increase in October (due to the NE Monsoon), but extreme rainfall occurred in December causing severe floods in the northeastern areas of Peninsular Malaysia (Kelantan, Perak, Pahang, and Terengganu) and also in Sabah. The flood had a considerable impact on the people who lived near riverbanks in those states. A year before that, in October 2013, mud floods occurred in the Cameron Highlands following the release of water from the Sultan Abu Bakar Dam, which threatened to burst after heavy rainfall. Scientists observed that the extreme weather events are modulated by natural climate phenomena such as El-Nino, La Nina, the Madden-Julian Oscillation (MJO), and cold surges (Fredolin, 2015). The Madden-Jullian Oscillation contributed to the severe wet season during NE Monsoon of 2014. It is also predicated that the extreme weather events will be more frequent and severe as the climate warms due to anthropogenic climate change.
8.4.3 Changes in natural forests and forest plantation areas in Malaysia Based on forestry statistics from the FDPM, Sabah, and Sarawak (Statistics on Commodities 2010), the total forested area in Malaysia is 18.03 million ha, including the areas considered stateland, forest plantation, and wildlife reserve. Sarawak has the largest forested area of (7.86 million ha) followed by Peninsular Malaysia (5.87 million ha) and Sabah (4.30 million ha). In 2012, the forested area designated PRF in Peninsular Malaysia covered 4.89 million ha, with 3.60 million ha in Sabah and 6.00 million ha in Sarawak. The PRF in Peninsular Malaysia at that time represented an expansion of 210 thousand ha from the previous eight years (Table 4.1). Table 4.1. Forested area (ha) by land status -- PRF, stateland forest (SLF), wildlife reserve (WR), and outside forest reserve (OFR) -- between 2004 and 2012 in Peninsular Malaysia (Source: Forestry Statistics Peninsular Malaysia 2013). Year
PRF
SLF
WR
OFR
Total
a) 2004
4,683,505
413,664
769,641
66
5,866,876
b) 2012
4,893,613
304,907
585,119
4,884
5,788,523
(+) 210,108
108,757
184,522
4,818
78,353
Changes from a) to b)
The FRIM conducted a project on forest change mapping in 2012 for Peninsular Malaysia using images datasets. It showed that within 15 years (1995–2010), the total forested area decreased by 28,498 ha/yr, which is equivalent to 0.44 % per year (Table 4.2). These changes in spatial distribution are shown in Figure 4. 120
Chapter 8. Forest Management and Water in Malaysia Table 4.2 The changes in forested area (ha) based on forest types for a 15-year-period (1995–2010) in Peninsular Malaysia (Source: MFRD FRIM Annual Report 2014).
1995 (a)
2010 (b)
(c) = (a) – (b)
Rate of changes (ha/yr)
6,054,384.47
5,690,815.57
363,568.90
24,237.93
0.4
Peat swamp forest
336,959.15
290,038.47
46,920.68
3,128.05
0.93
Mangrove forest
132,168.76
115,180.60
16,988.16
1,132.54
0.86
6,525,507.38
6,098,044.64
427,477.74
28,498.52
0.44
Forest Type Inland forest
Total
Year
Changes (ha)
Rate of Changes (%/yr)
Based on approvals for forest plantation development, the forest plantation areas in Peninsular Malaysia increased from 75,055 ha in 2004 to 324,417 ha in 2013 (Figure 5). In 2013, Kelantan state had the largest area devoted to forest plantations (162,485 ha) followed by the states of Perak (56,503 ha), Johor (45,544 ha), Pahang (31, 831 ha), and Selangor (11,381 ha). The other eight states have small areas, ranging from 36 to 9,131 ha.
Figure 4. Spatial distribution of changes in forest cover in Peninsular Malaysia 1995in and 2010cover (Source: MFRD FRIMMalaysia Annual Report 2014). Figure 4. Spatial distributionbetween of changes forest in Peninsular between 1995 and 2010 (Source: MFRD
FRIM Annual Report 2014).
75,055 ha (2004)
71,283 ha (2005)
121
Figuremanagement 4. Spatial distribution changes forestresources: cover in Peninsular between 1995 and 2010 (Source: MFRD Forest and theofimpact oninwater a reviewMalaysia of 13 countries FRIM Annual Report 2014). 75,055 ha (2004)
71,283 ha (2005)
324,417 ha (2013)
83,464 ha (2006) 104,541 ha (2007)
101,069 ha (2008) 197,829 ha (2012)
108,752 ha (2009)
185,794 ha (2011)
108,657 ha (2010)
Figure 5. Forest plantation areas Peninsular Malaysia (hectares). Source:Malaysia Forestry Statistics Peninsular Malaysia 2013. Figure 5.inForest plantation areas in Peninsular (hectares). Source: Forestry Statistics Peninsular Malaysia 2013.
Palm oil has become an important commodity for134 this country. Most oil palm plantations are planted in Sarawak, followed by Sabah and Peninsular Malaysia. Malaysia’s total land area is 32.996 million ha; oil palm plantations cover about 16.3%, while rubber plantations cover about 3.23%. As can be seen, the plantation areas are increasing over the last 5 years (2010–2014), and oil palm plantations and rubber plantations have increased about 9.98% and 3.53%, respectively (Table 4.3). One issue surrounding this change is the possible relationship between the conversion of land to oil palm plantations and climate changes. Table 4.3. Area planted with tree crops (oil palm and rubber) in Malaysia (ha) (Source: Statistics on Commodities, 2010 and http://www.kppk.gov.mywebsite). Year
2010
2011
2012
2013
2014
Oil palm
4,853,766
5,000,109
5,076,929
5,229,739
5,392,235
Rubber
1,028,000*
1,027,042
1,041,187
1,057,271
1,065,631
Note: * = estimated.
The Water Catchment Forests (WCF) have been gazetted (i.e., approved by law) within the PRF by the FDPM. These forests function as water resources areas (Figure 6). Pahang has the largest area with 258,707 ha, followed by Perak with 159,866 ha and Johor with 85,598 ha. As of year 2014, 734,731 ha out of 880,538 ha identified have been gazetted as WCF (Figure 7). For water quality monitoring, the FDPM has established monitoring stations in five states in Peninsular Malaysia. Kedah, Terengganu, Johor, and Pahang each established one station, and Pahang established five stations. The parameters observed are used to determine the Water Quality Index (WQI) from forested areas. The WQI is also monitored all over the country by the Department of Environment (DOE) Malaysia at the down-stream ends of the catchments. There are 464 rivers involved in the monitoring.
122
Chapter 8. Forest Management and Water in Malaysia
8.4.4 Climate change and the future of forestry & forest hydrology research in Malaysia In Malaysia more than 50% of the total land area is still maintained as forest. Forestry Statistics 2013 shows that 44.23% or 5,831,101 ha of Peninsular Malaysia are still covered by forest. Values for Sabah and Sarawak are not available. Under the Malaysian Constitution (Article 74(2)), land that includes forest is under the jurisdiction of the respective state governments. As such, each state has its own right to govern and manage its own forest resources. The forestry sector continues to contribute significantly to socio-economic development in Malaysia with emphasis on the practice of sustainable forest management. The current issue is that forest harvesting has moved to higher altitudes (>1000m). It is necessary to measure the impact of this shift to the hydrological parameters, as this is an environmentally sensitive area. As the importance of climate change is realized, both international and national efforts to address it have increased, and forests are shown to be critical to alleviating the effects of climate change. Malaysia is involved in the establishment the program launched by the United Nations Framework Convention on Climate Change (UNFCCC), Reducing Emissions from Deforestation and Forest Degradation (REDD+). This program focuses on conservation, sustainable management of forests, and enhancement of forest carbon stocks in developing countries (REDD+). The objective is to provide incentives to developing countries to protect, better manage, and wisely use their forest resources. Malaysia is in the process of developing its National REDD+ Strategy. The implementation of REDD+ inprovide this country result incountries the protection of water that from forested incentiveswill to developing to protect, better manage,resources and wisely use theiroriginate forest catchments. resources. The Ministry Resources and Environment (NRE) has also proposed the Malaysiaof is inNatural the process of developing its National REDD+ Strategy. The implementation of REDD+ in this country will Change result in the Center, protection which of water resources that originate from forested establishment of National Climate will handle the issues of climate change catchments. The Ministry of Natural Resources and Environment (NRE) has also proposed the and disaster establishment risk management -such as extreme floods -in this country. of National Climate Change Center, which will handle the issues of climate change and disaster risk management -- such as extreme floods -- in this country.
Per
Permanent Reserve Forest (PRF) Water Catchment Forest (Identified) Water Catchment Forest (Gazetted)
Figurewithin 6 WCFs within the PRF (Source: Forestry Department, 2014). Figure 6 WCFs the PRF (Source: Forestry Department, 2014).
123
Forest management and the impact on water resources: a review of 13 countries
Selangor (44,543 ha)
Terengganu (61,376 ha)
Johor (85,598 ha) Kedah (30,222 ha)
P.Pinang ( 3,121 ha) Perlis (4,380 ha)
Kelantan (35,898 ha) N.Sembilan (51,020 ha)
Perak (159,866 ha)
Pahang (258,707 ha)
Figure 7. WCFs (ha) that have been gazetted in Peninsular Malaysia (Source: FDPM, 2014). Figure 7. WCFs (ha) that have been gazetted in Peninsular Malaysia (Source: FDPM, 2014).
TheManagement ManagementPlan PlanofofWater WaterCatchment CatchmentForest Forest prepared forestry department each The is is prepared by by thethe forestry department for for each respectivestate statetotoensure ensure that forest is managed for resources. its resources. of Selangor and respective that thethe forest is managed for its The The statesstates of Selangor and Perak have already management plans, which on the management and conservation Perak have already adoptedadopted management plans, which focus onfocus the management and conservation of forest of forest resources, enforcement, activitymonitoring control, monitoring of waterand quality and quantity, and water resources, enforcement, activity control, of water quality quantity, and water revenue. revenue.on Research on hydrology, especially on water yields andcharacteristics discharge characteristics from Research hydrology, especially on water yields and discharge from this type of this type of forest, can be conducted to assess the benefits of non-timber forest. Besides the state-based forest, can be conducted to assess the benefits of non-timber forest. Besides the state-based WCF WCF management plans, the management water has bodies been addressed in the Management management plans, the management of waterofbodies beenhas addressed in the Management Prescriptions for Non-Production Functional Classes of Forest (Shamsudin et al., 2003). Prescriptions for Non-Production Functional Classes of Forest (Shamsudin et al., 2003). Forest plantations were developed with the expectation of declining in timber supply from natural
Forest plantations were developed with the expectation declining in timber natural of The development of large-scale forests. commercialofforest plantations is supply under from the Ministry forests. The Industries development large-scale commercial plantations is Cabinet under theinMinistry of this Plantation andofCommodities, which wasforest mandated by the 2005. Under Plantation and which mandated by theanCabinet 2005. Under program, Industries 375,000 ha of Commodities, forest plantation will was be developed with annualinplanting rate ofthis 25,000 ha (http://mtib.gov.my). According to Forestry have been identified for program, 375,000 ha of forest plantation will beStatistics developed2013, with 324,417 an annualha planting rate of 25,000 ha approved development as forest plantations, so only 50,583 ha more need toidentified be identified. (http://mtib.gov.my). According to Forestry Statistics 2013, 324,417 ha have been for The private sector establishes the plantations, forest plantations; andneed Acacia are theThe twoprivate main approved development as forest so only rubberwood 50,583 ha more to bespp. identified. species planted, the in addition to other fast-growing species. hydrological study needs to be sector establishes forest plantations; rubberwoodtimber and Acacia spp.A are the two main species conducted to assess large scaletimber of forest plantation development effects and planted, in addition to how otherthe fast-growing species. A hydrological study needswater to bequality conducted quantity. The state governments should monitor and address the environment issues related to the to assess how the large scale of forest plantation development effects water quality and quantity. The establishment of forest research componentsissues should be included in the planning state governments shouldplantations, monitor andand address the environment related to the establishment of and development processes. Research also can be conducted at the research stations and at other forest plantations, and research components should be included in the planning and development research sites established in Peninsular Sabah, or processes. Research also caneither be conducted at theMalaysia, research stations andSarawak. at other research sites established either in Peninsular Malaysia, Sabah, or Sarawak.
8.5 Acknowledgments The authors would like to thank the HQ Forestry Department Peninsular Malaysia, for providing some of the current data used to write this chapter.
137
124
Chapter 8. Forest Management and Water in Malaysia
8.6 References Abdul Rahim, N. 1988. Water yield changes after forest conversion to agricultural land use in Peninsular Malaysia. Journal of Tropical Forest Science. 1(1): 67–84. Abdul Rahim, N. and Harding, D. 1992. Effects of selective logging methods on water yield and streamflow parameters in Peninsular Malaysia. Journal of Tropical Forest Science. 5(2): 130–154. Abdul Rahim, N. and Yusop, Z. 1994. Hydrological response to selective logging in Peninsular Malaysia and its implications on watershed management. In: Proceedings of the International Symposium on Forest Hydrology, Tokyo. pp. 263–274. Anonymous. 1999. Malaysian Criteria, Indicators, Activities and Standard of Performance (MC&I) for Forest Management Certification, Peninsular Malaysia. Forestry Department, Kuala Lumpur (Unpublished). Baharuddin, K. 1995. Effects of logging on soil physical properties and soil erosion in hill dipterocarp forest of Peninsular Malaysia. Research Pamphlet 119. Forest Research Institute Malaysia. Baharuddin, K., Mokhtaruddin, A.M., and Nik Muhamad, M. 1995. Surface runoff and soil loss from a skid trail and a logging road in a tropical forest. Journal of Tropical Forest Science 7: 558–569. Brown, S. and Lugo, A.E. 1990. Tropical secondary forest. Journal of Tropical Ecology,
6: 1–32.
Bruijnzeel, L.A. 1990. Hydrology of Moist Tropical Forests and Effects of Conversion: a State of Knowledge Review. UNESCO IHP, Amsterdam. Bruijnzeel, L.A. 2004. Hydrological functions of tropical forests: not seeing the soils? Agriculture Ecosystem and Environment, 104: 185–228. Chan, N.W. 2002. Review Paper on Chapter 18 of Agenda 21: Protection of the Quality and Supply of Freshwater Resources: Application of Integrated Approach to the Development, Management and Use of Water Resources. Background Paper for NGO Perspectives for Advancing Sustainable Development in Malaysia, Malaysian NGO Forum Rio+10, Kuala Lumpur. Chappell, N., Tych, W., Yusop, Z., Abdul Rahim, N. and Baharuddin, K. 2005. Spatially- significant effects of selective tropical forestry on water, nutrient and sediment flows: a modelling-supported review. In M. Bonell and the Humid Tropics. Cambridge Press. pp. 513-532. ISBN-10: L.A. Bruijnzeel (eds) Forests-Water-People in 0521829534. Chong, M.H. 2008. Comparison of rainfall runoff characteristics and evaporation in oil palm catchments. M.Sc thesis, Universiti Teknologi Malaysia. DID. 1986. Sungai Tekam Experimental Basin. Transitional Report July 1980 to June 1983. Water Resources Publication, No. 16. Drainage and Irrigation Department, Ministry of Agriculture, Kuala Lumpur, Malaysia. DID. 1989. Sungai Tekam Experimental Basin Final Report, July 1977 to June 1986. Water Resources Publication Kuala Lumpur, Malaysia. No. 20. Drainage and Irrigation Dept., Ministry of Agriculture, Douglas, I. 1972. Impact of urbanization on the Klang River, Selangor, Malaysia. Paper presented at the 44th. Congress Australian and New Zealand Association for the Advancement of Science, Sydney, Australia. Douglas, I., Spencer, T., Greer, T., Bidin, K., Sinun, W. and Meng, W.W. 1992. The impacts of selective commercial logging on stream hydrology, chemistry and sediment loads in Ulu Segama rain forest. Philosophical Transaction of Royal Society (London), B335: 397–406. Douglas, I., Greer, T., Bidin, K. and Spilsbury, M. 1993. Impacts of rainforest logging on river systems and communities in Malaysia and Kalimantan. Global Ecology and Biogeoraphy Letters 3: 245–252. Fauzi, A. S. 2003. Water: Future Outlook. Paper Presented at the Dialogue on Food, Water and Environment, Sectoral Level. Organised by Malaysian Water Partnership, Putrajaya. Fauzi, A.S. 2000. Towards Realising the National Water Vision. Paper presented at the Workshop on Malaysian National Water Vision, 23–24 May 2000, Kuala Lumpur, Forestry Statistics Peninsular Malaysia 2012. Forestry Department Peninsular Malaysia. Ministry of Natural Resources and Environment Malaysia. Forestry Statistics Peninsular Malaysia 2013. Forestry Department Peninsular Malaysia. Ministry of Natural Resources and Environment Malaysia. Fredolin T., 2015. Coping with Greater Frequency and Severity of Weather Extremes (Especially Flooding). Paper presented at the Climate Change and Water Dialogue 2015, 22 May 2015, Petaling Jaya Selangor, Malaysia.
125
Forest management and the impact on water resources: a review of 13 countries MFRDB FRIM Annual Report 2014. Forest Research Institute Malaysia 2015. Ministry of Natural Resources and Environment. Fritsch, J. 1993. The hydrological effects of clearing tropical rain forest and the implementation of alternative land uses. International Association of Hydrological Science Publication. 216: 53–66. Geoffery, J. 2013. Partitioning of rainfall and flowpath processes in small oil palm catchments. PhD Thesis, Universiti Teknologi Malaysia. Gomi, T., Sidle, R., Noguchi, S., Negishi, J., Abdul Rahim, N. and Sasaki, S. 2006. Sediment and wood accumulations in humid tropical headwater streams: Effects of logging and riparian buffers. Forest Ecology and Management. 224: 166-175. Hanapi, M.N. 2015. Water and Industry. Paper presented at the Climate Change and Water Dialogue 2015, 22 May 2015, Petaling Jaya Selangor, Malaysia. Hensen, E. 1999. Note on oil palm oil productivity: Carbon dioxide gradients and fluxes and evapotranspiration, above and below the canopy. Journal of Oil Palm Research, 2(1): 30–40. Kuraji, K. and Paul, L.L.1994. Evapotranspiration estimates of tropical rain forested watersheds using the short-time period water-budget method. Proceedings of Annual Meeting Japan Society of Hydrology & Water Resources. In 1994, pp. 588–598. Lai, F.S. 1993. Sediment yield from logged, steep upland catchments in Peninsular Malaysia. International Association of Hydrological Science Publication. no 216: 219–229. Leigh, C.H. 1978. Slope hydrology and denudation in the Pasoh forest reserve I. Surface wash; experimental techniques and some preliminary results. Malayan Nature Journal, 30: 179–197. Low, K.S. 1971. Rainfall and Runoff on the Sungai Lui Catchment, West Malaysia. Ph.D. Thesis, University of Hull. Maite G-C, Troch, P., Ziegler, A., Giambelluca, T., Durcik, M., Vogler, J. and Nullet, M. 2010. Hydrologic effects of the expansion of rubber (Hevea brasiliensis) in a tropical catchment. Ecohydrology. 3, 306–314. Doi: 10.1002/Eco.110. Malaysian Criteria and Indicators for Forest Management Certification for Natural Forest [MC&I (Natural Forest)]. 2011. Malaysian Timber Certification Council , Unit C-8-5, Block C, Megan Avenue 2, No. 12 Jalan Yap Kwan Seng 50450 Kuala Lumpur, Malaysia . Malaysian Criteria and Indicators for Forest Plantation Management Certification (MC&I Forest Plantation. v2). 2015. Malaysian Timber Certification Council , Unit C-8-5, Block C, Megan Avenue 2, No. 12 Jalan Yap Kwan Seng 50450 Kuala Lumpur, Malaysia. Malmer, A. 1992. Water yield changes after clear-felling tropical rainforest and establishment of forest plantation in Sabah, Malaysia, Journal of Hydrology, 134: 77–94. Malmer, A. 1993. Dynamic of Hydrology and Nutrient Losses as Response to Establishment of Forest Plantation - a Case Study on Tropical Rainforest Land in Sabah, Malaysia. Ph.D. Thesis, Swedish University of Agricultural Science, Umeå, Sweden, 181 pp. Malmer, A., Murdiyarso, D., Bruijnzeel, L. and Ilstedt, U. 2009. Carbon sequestration in tropical forests and water: a critical look at the basis for commonly used generalizations. Global Change Biology, Doi: 10.1111/j.13652486.2009.01984.x. National Water Resources Policy (NWRP), 2012. Ministry of Natural Resources and Environment Malaysia. ISBN 978-967-0250-08-3. National Hydraulic Research Institute of Malaysia (NAHRIM). Ministry of Natural Resources and Environment Malaysia. 2006. Study of the Impact of Climate Change on the Hydrologic Regime and Water Resources of Peninsular Malaysia. California Hydrologic Research Laboratory (CHRL). National Hydraulic Research Institute of Malaysia (NAHRIM). Ministry of Natural Resources and Environment Malaysia. 2010. Study of the Impact of Climate Change on Hydrologic Regime and Water Resources of Sabah and Sarawak. California Hydrologic Research Laboratory (CHRL). Negishi, J., Sidle, R., Zieglar, A., Noguchi, S. and Abdul Rahim, N. 2008. Contribution of intercepted subsurface flow to road runoff and sediment transport in a logging- disturbed tropical forest. Earth Surface Processes and Landforms. 33: 1174–1191. Negishi, J., Noguchi, S., Sidle, R., Ziegler, A. and Abdul Rahim. N. 2007. Stormflow generation involving soil pipes in a tropical zero-order basin of Peninsular Malaysia. Hydrological Processes 21: 789-806. Noguchi, S., Baharuddin, K., Yusop, Z., Tsuboyama, T. and Tani, M. 2003. Depth and physical properties of soil in forest and rubber plantation, Peninsular Malaysia. Journal of Tropical Forest Science. 15(4): 513–530. 126
Chapter 8. Forest Management and Water in Malaysia Noguchi, S., Abdul Rahim, N., Baharuddin, K., Tani, M., Sammori, T. and Morisada, K 1997a. Soil physical properties and preferential flow pathways in tropical rain forest, Bukit Tarek, Peninsular Malaysia. Journal of Forest Research, 2: 115–120. Noguchi, S., Abdul Rahim, N., Yusop, Z., Tani, M. and Sammori, T. 1997b. Rainfall-runoff responses and roles of soil moisture variations to the response in tropical rain forest, Bukit Tarek, Peninsular Malaysia. Journal of Forest Research. 2: 125–132. Ohnuki, Y., Abdul Rahim, N., Noguchi, S. and Sasaki, S. 2010. Sediment discharge through buffer zones in a tropical rainforest of Peninsular Malaysia. Japan Agricultural Rsearch Quarterly. 44: 187-196. Quarterly Water Services Statistics, 2014. Suruhanjaya Perkhidmatan Air Malaysia (SPAN). Statistics on Commodities, 2010. 24th Edition. Ministry of Plantation and Commodities. Rahmid, K. and Blake, G. 1979. Forest hydrology study at Jengka and Berembun hill forest. Paper presented at the ASEAN Workshop on Watershed Conservation and Management Research Program, Kuala Lumpur, 3–7 September 1979. Sidle, R.C., Sasaki, S., Otsuki, M., Noguchi, S., Abdul Rahim, N. 2004. Sediment pathways in a ropical forest: effects of logging roads and skid trails. Hydrological Processes 18: 703–720. Saifuddin, S., Abdul Rahim, N. and Muhammad Farid, A. 1991. Watershed research in forest plantation: 1. Establishment and physical characteristics of Bukit Tarek Watershed. FRIM Research Pamphlet No. 110. FRIM, Kuala Lumpur. Salam, M. 1998. Integrated Coastal and Estuarine Areas Management. (Hand book 1–5). WWF-Malaysia, Selangor, Malaysia. Salleh, M., Abdul Rahim, N. and Mushrifah, I. 1983. The effect of logging on sediment yield in two forested catchment areas. In: Khamis, A., Lai, F., Lee, S., and Abd Rahman, M.D. (eds), Regional Workshop on Hydrological Impacts of Forestry Practices and Reaforestation. Serdang, Selangor: Universiti Pertanian Malaysia, pp. 61–69. Sammori, T., Zulkifli, Y., Baharuddin, K., Noguchi, S. and Tani, M. 2004. Suspended sediment solids discharge from a small forested basin in the humid tropic. Hydrological Processes 18, 721–738. Shamsuddin, I., Abd. Razak, O., Noor Azlin, Y., Samsudin, M., Safiah, M., Baharuddin, K. and Siti Aisah, S. 2003. Management Prescriptions for Non-Production Functional Classes of Forest. Forest Research Institute Malaysia, Malayan Forest Records No. 46. 154 pp. Doi.org/10.1155/2014/408409. Sist, P., Dykstra, D. and Fimbel, R. 1998. Reduced-impact logging guidelines for lowland and hill dipterocarp forests in Indonesia. Occasional paper 15.CIFOR 19 pp. Siti Aisah, S., Yusop, Z. and Noguchi, S. 2014. Influence of Pplantation establishment on discharge characteristics in a small catchment of tropical forest. International Journal of Forestry Research, Volume 2014, 10 pg. http://dx.Doi. org/10.1155/2014/408409. Siti Aisah, S., Yusop, Z., Noguchi, S. and Abd Rahman, K .2012. Rainfall partitioning in a young Hopea Odorata plantation. Journal of Tropical Forest Science. 24(2): 147–161. Tan, Z-H., Zhang, Y-P., Song, Q-H., Liu, W-J., Deng, X-B., Tang, J-W., Deng, Y., Zhou, W-J., Yang, L-Y., Yu, G-R., Sun, X-M. and Liang, N-S. 2011. Rubber plantations act as water pumps in tropical China. Geophysical Research Letters. 38, L24406: 1–3. Doi:10.1029/2011GL050006. Walsh, R., Bidin, K., Blake, W., Chappell, N., Clarke, M., Douglas, I., Ghazali, R., Sayer, A., Suhaimi, J., Tych, W. and Annammala, K.V. 2011. Long-term responses of rainforest erosional systems at different spatial scales to selective logging and climatic change. Philosophical Transaction of Royal Society (London). B. 366, 3340–3353. Doi:10.1098/rstb.2011.0054. Yusop, Z. 1996. Nutrient Cycling in Secondary Rain Forest Catchments of Peninsular Malaysia. PhD. Thesis, University of Manchester. Yusop, Z., Abdul Rahim, N. and Douglas, I. 2006. Dissolved and undissolved nutrient loading from secondary forest catchments of Malaysia. Forest Ecology and Management. 224: 26–44. Ziegler, A., Negishi, J., Sidle, R., Gomi, T., Noguchi, S. and Abdul Rahim, N. 2007.Persistent of road runoff generation in a logged catchment in Peninsular Malaysia. Earth Surface Processes and Landforms. 32: 1947–1970. Doi: 10.1002/esp. 1508.
127
Chapter 9. Forest Management and Water in Peru Chapter 9. Forest Management and Water in Peru Carlos A. Llerena11 (
[email protected]), Rosa M. Hermoza11 (
[email protected]), Sara R. , Rosa M. Hermoza (
[email protected]), Sara 4R. CarlosChapter A. Llerena (
[email protected]) 9. Forest Management and Water in Peru Yalle22(
[email protected]), Florencio Flores33 (
[email protected]) , and Norma Salinas 4 Yalle (
[email protected]), Florencio Flores (
[email protected]), and Norma Salinas (
[email protected]) (
[email protected])
1 25 La Molina (UNALM), Lima 1Universidad Nacional Agraria Llerena25 (
[email protected]), Rosa M. Hermoza (
[email protected]),
Carlos A. Universidad Nacional Agraria La Molina (UNALM), Lima 2 26 273 Servicio Nacional Forestal Fauna Silvestre Silvestre (SERFOR), Ministerio Agriculturay yRiego Riego 2 Sara R. Yalle (
[email protected]), Florencio FloresMinisterio (
[email protected]), Servicio Nacional Forestal yy de de Fauna (SERFOR), dedeAgricultura 3 284 la Investigación y el Desarrollo Forestal (ADEFOR), Cajamarca 3Asociación Civil para and Norma Salinas (
[email protected]) Asociación Civil para la Investigación y el Desarrollo Forestal (ADEFOR), Cajamarca 4 4 University of Oxford University of Oxford
9.1 Introduction 9.1 9.1Introduction Introduction 9.1.1 Peru: main climate and physiographical settings 9.1.1 Peru: main climate andand physiographical settings 9.1.1 Peru: main climate physiographical settings Peruis is the third largest country in South America Brazil and Argentina; itlocated is located Peru third largest country in South America afterafter Brazil andArgentina; Argentina; thein the Peru isthe the third largest country America after Brazil and ititisislocated ininthe km². The Andes central-westernpart partofofthe thesub-continent sub-continent andoccupies occupies a land area of 1,285,215.60 central-western land area of1,285,215.60 1,285,215.60 km². The Andes central-western part of the sub-continent and occupies aa land area of km². The Andes mountains, located longitudinally, divides the country into three “natural regions”: the Pacific coast mountains, country into intothree three“natural “naturalregions”: regions”:the thePacific Pacificcoast coast mountains,located located longitudinally, longitudinally, divides the country (very arid, covering 10% of the territory), the high Andean range of mountains (semi-arid and sub (very high Andean Andeanrange rangeofofmountains mountains(semi-arid (semi-aridand andsubsub(veryarid, arid,covering covering 10% 10% of of the territory), the high -humid, 30%), and the Amazon jungle, the upper Andean Amazon and the lower plain (very wet and humid, upper Andean Andean Amazon Amazonand andthe thelower lowerplain plain(very (verywet wetand and humid,30%), 30%),and and the the Amazon Amazon jungle, the upper wet, 60%). From the hydrographic point of view, considering the continental divide and the drainage wet, view, considering consideringthe thecontinental continentaldivide divideand andthe thedrainage drainage wet,60%). 60%).From Fromthe the hydrographic hydrographic point of view, basins main stems end, there are three watershed systems: the Pacific Ocean system, with 53 basins basins main stems end, there watershed systems: the Pacific Ocean system, with 53 basins basins main stems end, there are three watershed systems: the Pacific Ocean system, with 53 basins (22 % of the territory), the Atlantic system with the only one and vast Amazon basin (74%), and the (22 % of the territory), the Atlantic system with the only one and vast Amazon basin (74%), and the (22 % of the territory), the Atlantic with the only one and vast Amazon basin (74%), and the lake Titicaca system with 9 basins (and 4% of the Peruvian land area). Peru is one of the ten most lake Titicacacountries system with with basins 4% ofofthe land Peru ofofthe lake Titicaca system 99 basins the Peruvian landarea). area). Peruisand isone one theten tenmost most biodiverse in the world,(and because It is as itsPeruvian wide diversity of species ecosystems. biodiverse countries in the world, of its wide diversity of species and ecosystems. It is biodiverse countries in the world, because its wide diversity of species and ecosystems. It isasaswell well well a country geographically diversified with contrasting landscapes, local cultures, and abundant countryresources. geographically diversifiedrange contrasting landscapes, local cultures, and aanatural country geographically diversified with of contrasting landscapes, local cultures, andabundant abundantnatural natural The latitudinal Peru goes in between 0° and 18°, with elevations from 0 resources. The latitudinal range goes in between 0° and 18°, with elevations from 0 to almost resources. The latitudinal range of Peru in between 0° and 18°, with elevations from 0 to almost to almost 6,800 m.a.s.l. The position of the Andes and the high marine influence through cold and 6,800 m.a.s.l. The position of the the Andes and the cold warm 6,800 position of Andes andcoastline, the high high marine marineainfluence influence through coldand and warm oceans warmm.a.s.l. oceansThe currents along 3,000 km of create variety ofthrough local climates and lifeoceans zones, currents along3,000 3,000 Peru. km of ofFigures coastline, create aa variety local climates life currents along km coastline, create variety of local climatesand andand lifezones, zones,which which which characterize 1 and 2 show theof main geographical climatic characteristics characterize Peru. Figures and 22 show show the of Peru, andPeru. its basin systems. characterize Figures 11 and the main main geographical geographicaland andclimatic climaticcharacteristics characteristicsofofPeru, Peru, and its basin systems. and its basin systems.
Figure 1. Geography and climate Figure 1. 1. Geography Geography and Figure andclimate climate
Figure 2. Basin systems Figure 2. Basin Figure Basinsystems systems
144 144 Universidad Nacional Agraria La Molina (UNALM), Lima Servicio Nacional Forestal y de Fauna Silvestre (SERFOR), Ministerio de Agricultura y Riego 27 Asociación Civil para la Investigación y el Desarrollo Forestal (ADEFOR), Cajamarca 28 University of Oxford 25 26
129
Forest management and the impact on water resources: a review of 13 countries
The Peruvian coast is extremely dry, especially from Ica (300 km south of Lima) to the south, due to the influence of the Atacama Desert, the driest in the world. In this region there is a clear and direct relationship between altitude and precipitation, and climate conditions are mainly identified by the variations in temperature and humidity. In the mountains, valleys, hills, and plateaus of the Andes rainfall is higher than in the coast. In the north, most mountains can even exceed 1,200 mm of annual rainfall. Temperatures in this region show a wider range. In the upper Andean Amazon jungle occur the highest rainfall records in Peru (7,500 mm/year), in the small city of Quincemil (Quispicanchis Province, Department of Cusco) on the Araza river basin. In much of this region, between 1,500 and 3,500 masl (yungas) there is also an important additional water supply from the mist condensation. The Amazon lowlands show relatively less precipitation values, shorter temperature ranges, but with higher maximum values. However, in this area annually some episodes of so-called friajes (cold spells) occur for a few days decreasing the minimum temperature as a result of icy winds originate in Antarctica. All this “normal” or natural climate variability, national climate performance is impaired when events “El Niño” occur (ENSO, El Niño Southern Oscillation) which in the most recent decades show higher frequency and intensity, apparently due to the climate change. In the mountains (especially in the eastern slopes of the Andes) and in the lower jungle, rainfall seasonality is marked with a dry period that take place depending on the site latitudinal and altitudinal variations, from May to October and a rainy one from November to April. These variations have a greater contrast in the lowlands. In the Amazon basin the rain depends on the forests.
9.1.2 Forests and forest resources of Peru Peru forests cover more than 72 million hectares. Peru is the second Latin American country in forest area, the fourth largest one in tropical forests extension, and is among the 10 countries worldwide with more extensive wooded mass. This large area of predominantly woody natural Amazon vegetation cover, also include extensive palm dominated wetlands, and grasslands and bamboo association patches. In addition, legally and administratively are forest resources about 20 million hectares of high Andean prairies, located between the treeline and glaciers that correspond to the regional appellations of paramo, jalca, puna, and highlands moors. All these natural formations or naturalized extensive coastal, Andean and Amazonian areas produce timber, various other non-timber forest products (NTFP) and also provide important ecosystem services. Only the humid Amazon forests cover 67.98 million hectares while the dry and Andean forests reach 4.02 million hectares (MINAM 2010). Forest types differ in both, tree species composition and climatic conditions, especially seasonal water availability. Figure 3 shows the main locations of forest types described below. Table 1 shows Peru’s main natural forests and their extensions.
Coastal dry forests Mostly located in northern Peru, the dry forests extend along the coast through the departments of Tumbes, Piura, Lambayeque, northern La Libertad, and along the lower Maranon basin valley, covering about 4 million hectares. The two areas are interconnected through the Porculla Pass (2,100 masl), the lowest Andean depression in Peru. The most conspicuous species in the dry forests at the lowest elevations is algarrobo carob tree or mesquite (Prosopis spp.), also known as huarango in Ica, of great local value in the rural economy for timber, fruits and other benefits, such as protection against desertification, beekeeping and providing shade for people and their domesticated animals. The higher areas the forest is dominated by the deciduous ceibo or kapok (Ceiba sp.) tree, which turns green with summer rains, and due to the shrubs and low vegetation it becomes almost impenetrable. These forests were strongly impacted by the high demand for firewood, charcoal, and other local wood uses, and fine hardwoods like guayacán (Tabebuia sp.) and hualtaco (Loxopterygium huasango), very appreciated for flooring, have been subjected in the past
130
ood uses, and fine hardwoods like guayacán (Tabebuia sp.) and hualtaco (Loxopterygium uasango), very appreciated for flooring, have been subjected in the past decades to a logging ban hich has allowed its partial recovery. All of these formations are heavily dependent on seasonal ains. Another important type of forest in the north of the country despite its small extension Chapter 9. Forest Management and Water in Peru is mangrove, located atathe mouth thehas Tumbes near the border withformations Ecuador.areMangroves are decades to logging ban of which allowed River its partial recovery. All of these heavily dependent on seasonal rains. Another forest in the north wetlands, of the country despite efined by the RAMSAR convention as animportant area of type richofand productive made upitsof islands small extension is mangrove, located at the mouth of the Tumbes River near the border with Ecuador. nd channels saturated by fine textured sediments carried by the river brackish water and controlled Mangroves are defined by the RAMSAR convention as an area of rich and productive wetlands, y the tides.made They the channels accumulated sediment, prevent soil erosion and the valley of up stabilize of islands and saturated by fine textured sediments carried by theprotect river brackish andThese controlled by the tides. Theystrongly stabilize the accumulated sediment, prevent soil erosionventures. umbes of water floods. forests have been affected and occupied by aquaculture and protect the valley of Tumbes of floods. These forests have been strongly affected and occupied long the Pacific coasts and at the floodplains from the river mouth to higher elevations, there are by aquaculture ventures. Along the Pacific coasts and at the floodplains from the river mouth to so naturalhigher riparian foreststhere mainly salix or sauce and molle serrano (Schinus elevations, are also natural riparian(Salix forests humboldtiana), mainly salix or sauce (Salix humboldtiana), and molle the serrano (Schinus molle) overcoming the urban and agriculturalSeveral development olle) overcoming urban and agricultural development pressures. smallpressures. green patches Several small green patches along the Pacific coast and feed by seasonal mist from the ocean are ong the Pacific coast and feed by seasonal mist from the ocean are the hillocks or lomas, some of the hillocks or lomas, some of them legally protected due to their ecological and economical value. hem legally protected due to their ecological and economical value.
Figure 3. Forest types. Sources: http://www.infobosques.com/bosques-del-peru.php; MINAM (2012) Figure 3. Forest types. Sources: http://www.infobosques.com/bosques-del-peru.php; Ministerio del Ambiente (MINAM 2012)
146
131
Forest management and the impact on water resources: a review of 13 countries Table 1. Forest types (Source: http://www.infobosques.com/bosques-del-peru.php; Ministerio del Ambiente MINAM 2012) Forest type
Area (ha)
Coastal dry forests
3,928,063
Algarrobo forests
2,627,031
Mountainl forests
163,629
Ceibo forests Inter-Andean dry forests Mangroves
1,137,404 335,688 4,918
Tumbes tropical forests
24,317
Upper Amazon forests
16,683,071
Lowland Amazon forests
50,928,757
Flooded forests
3,988,046
Alluvial forests
8,235,262
Hill forests Aguaje wetland forests
1,529,400
Paca forests
4,320,708
High Andean forests Total
32,865,933
101,268 72,006,083
Andean forests They are conformed by remaining relics of large tracts of two main species: quinual (Polylepis spp.) and colle (Buddleia spp.), probably the world´s highest wodlands, as well as smaller stands of other species as chachacomo (Escalonia resinosa); aliso (Alnus acuminata); molle (Schinus molle), pisonay (Erythrina edulis), etc., adapted and distributed in the Peruvian Andes. These forests were strongly cleared for expansion of the agricultural frontier, firewood and charcoal production, and for extensive mining purposes since pre-colonial times. There are only about 101000 hectares of these forests left, at between 3000 and 4500 masl, and in remote areas protected by their inaccessibility and also as protected areas. Andean forests in the more humid and sheltered areas are often covered by epiphytes. In the undergrowth are species of grasses and herbs, wild potatos, other Andean tubers and other species of the Andean flora. The quinual is a tree adapted to very cold weather, with an external bark in multiple thin layers. It plays an important role for protecting headwaters, streams upper reaches, and hillsides. It is locally used as firewood. The most important Andean forests are located in dispersed relic stands along the heights of the Andean region. The Andean species thriving in drier conditions are mostly located in the headwaters, hillsides and valleys of the following river basins: Marañon (Ancash, La Libertad, Cajamarca and Amazonas), Huancabamba (Piura), Chamaya (Cajamarca), Pampas (Apurimac and Ayacucho) and Pachachaca and Abancay (Apurimac).
Upper Amazon forests These Eastern Andean Amazon forests cover more than 17 million hectares in between 800 and 3500 masl. They are highly diverse, moist and mist forests, support a rich epiphyte population. High commercial value species such as walnut or nogal (Juglans spp.), cedar or cedro (Cedrela montana), 132
Chapter 9. Forest Management and Water in Peru
ulcumano (Podocarpus oleifolius), romerillo or intimpa (Podocarpus glomeratus), among others, are or have been presented in these forests, growing on sandy soils with a deep humus layer and high infiltration capacity. Rainfall is generally above 1000 mm/year at its driest areas, and may exceed 7000 mm/year. These forests have been felled and the land being occupied for many decades by migrant farmers and illegal coca (Erythroxylum coca) growers. At present there are important permanent crops in this region such as coffee (Coffea arabica), cocoa (Theobroma cacao), passion fruit or granadilla (Passiflora ligularis), some of them like rocoto (Capsicum pubescens), cultivated on steep slopes, induce to serious soil erosion problems. Because of their location at headwaters, its climate, and soils of high storage capacity, these forests are important suppliers of environmental services, especially clean water and more stable streams and river regimes that maintain steady streamflows during the dryer months at lower elevations.
Lowland Amazon forests Encompassing more than 50 million hectares, these forests are the largest in the country, very important as production forests. Its upper limit is around 800 meters and extend to the Peruvian Amazon eastern borders. Average rainfall values are in between 1500 to 3500 mm/year. Their terrestrial ecosystems show the dominance of trees at several layers and are formed by flooded, terraced, and hill forests. They present a great diversity of trees with presence of other plants such as shrubs, vines, bamboo or paca (Guadua spp.), ferns, and many palm trees, especially the aguaje (Mauritia flexuosa) predominant in hydromorphic soils, with very high carbon storage capacity. Aquatic ecosystems, lakes, ponds, oxbows or cochas, white and black water rivers, and wetlands are important components of the landscape and a a large hydro-biological wealth. In more accessible areas these forests have been heavily exploited selectively since the rubber (Hevea brasiliensis) boom to extract from them the most valuable species as mahogany or caoba (Swietenia macrophylla), cedar or cedro (Cedrela odorata), rosewood or palo rosa (Aniba rosaeodora) ishpingo (Amburana cearenssis), tornillo (Cedrelinga catenaeformis) lupuna (Ceiba pentandra), and lately high demand hardwoods, especially shihuahuaco (Dipteryx spp.) and others. Lowland forest are impacted by the establishment of industrial monocultures such as oil palm or palmera aceitera (Elaeis guineensis) over large areas, and land use and cover changes for agricultural purposes, as well as hydrocarbon and mining exploitation.
Forest plantations The first Eucalyptus globulus were planted in Peru about 1860, at a Franciscan monastery in Concepcion, Junin. Probably the first Pinus ssp. were planted during the decade of 1950 in marginal lands, in Sunchubamba, Cajamarca, on private grounds of the large Hacienda Casagrande, very important by its sugar cane production. Further plantations were tested and sponsored for protection and production purposes at small stands and agricultural land borders by the Forest Service and since the seventy´s. international cooperation mainly from Belgium, Germany, Switzerland, Japan, USA, Netherlands and Finland, as well as FAO, supported several forestation efforts with public agencies as PRONAMACHCS, AGRORURAL, FONDEBOSQUE, INIA, IIAP, and private NGOs. During the last two decades private planting on relatively small properties has increased. At present, Cusco and Cajamarca are the departments with the largest areas of planted forests. And the new legislation pushed by private entrepreneurs, and institutions like INIA, CIP-CD Lima, UNALM, among others are trying to give new impulse to the commercial forest plantations. Growing demand for forest products makes sense out of expanding planted forests. They may reduce pressure on natural forests, support biodiversity conservation, and contribute to climate change mitigation and adaptation actions. In Peru, planted forests for production or protection purposes contain mostly exotic species: eucalyptus (E. globulus ) and pinus (P. radiata and P. patula). Among the most important native species in reforestation programs are quinual (Polylepis spp.) in the Andean region, and tara or taya (Caesalpinea spinosa) in the coastal and Andean region. Bolaina blanca 133
Forest management and the impact on water resources: a review of 13 countries
(Guazuma crinita), capirona (Calycophyllum spruceanum) and tornillo (Cedrelinga catenaeformis), among others, have been planted in the Amazon region. The official statistics (2012) of planted forest in Peru exceeds 1million hectares. However, there are reasons to believe that such number is an overestimation because its calculation is based on the number of plants produced in the nurseries and taken to the field for final planting (at 3m x 3m), without considering the effective replacement of lost plants by a mortality rate which in some cases can exceed 50%. In addition, no information on the maintenance and monitoring actions to ensure planting survival is available. However, the extension suitable to be reforested in Peru is considered to be larger than 10 million hectares (INRENA 2005). At present we would be only using less than 10% of it, which makes only for about 14 % of the deforested area until 2005. During the past seven years less than 40000 hectares/year have been planted although the goals of the National Reforestation Plan 2005 indicated minimum annual targets for 2012 of 26500 hectares planted for commercial and industrial production and 32500 ha for environmental protection and watershed management purposes (INRENA 2005). Porcón, Cajamarca, at the northern Andean region, with rainfall regimes of more than 1100 mm/ year, is a project originated more than 30 years ago which became the most successful forest plantation model in Peru, with large timber resources in an originally area of 14000 hectares of prairies (paramo or jalca). The new Porcón beautiful landscape (see fig. 4), the microclimate, the restored infiltration capacity of the degraded prairie, the fungus production, and the added value given to its wood products, demand an important working force and provide important income to the local community. However, not all Andean watersheds are as Porcón. Most of the mountains in the central and southern Andes are located in semiarid zones with annual rainfall in between 200 and 700 mm, and more seasonal regime (short rains season and prolonged dry season), where the population and economic growth of the past years makes increasingly difficult to get water to meet other needs. New trees planted in these areas, depending on the chosen species, the forested area, its density, and the planting site, will increase the water demand to volumes still not calculated and could create social conflicts (Llerena et al 2011). However, as it was stated before, there is an increased interest in Peru to invest in forest plantations looking for the best locations for this activity. New regulations have been proposed and enforced (September 2014) in order to facilitate and promote tree planting for commercial aims. It is expected to plant four million hectares of commercial plantations looking for reaching the first US$ 1000 million in timber and wood exports in the short-term (Gestión newspaper, October 5th 2014, Economics section, e-version). In the same way, one of the objectives of the Strategic Action Plan for Adaptation and Mitigation presented by MINAM points out to the increase of forest cover for carbon sequestration. It is importantIttoisnotice that beyond initial watering demands of planted forests, water impacts sequestration. important to noticethe that beyond the initial watering demands of planted forests,are rarely an important issue dealing with planting trees. water impacts are rarely anwhen important issue when dealing with planting trees.
134
9.1.3 Forest management
Figure 4. Porcón, Cajamarca (Photo: U. Pajares)
Chapter 9. Forest Management and Water in Peru
9.1.3 Forest management This concept includes the use of social, environmental and economic criteria that help to maintain the long-term flow of forest goods and services without significant degradation over time and preserving natural capital. Forest management is encouraged by the presence of enabling conditions: national and regional legal, policy and institutional frameworks (FAO 2015). Decades ago Dourojeanni (1987) pointed out that there are few natural forests undergoing management and that the problem was not scientific or technical knowledge but social, political and institutional problems. The more conspicuous and successful management experiences seem to be those carried out in forests owned by native people (Gaviria and Sabogal 2013, Cossio et al 2014). Despite several studies, proposal and wellplanned experiences looking for a more productive forest management in Peru this fundamental forestry activity is not developed as it should be in such a wooded country (Dourojeanni 1987, Figueroa et al 1987, Llerena 1989, Lombardi and Llerena 1991, Nalvarte et al 1993, Zarin et al 2004, Sabogal et al 2004, Sabogal y Casaza 2010, IICA 2012, Guariguata 2013). The new forestry legislation in Peru defines several forest management practices according to forest type and land use, as follows: management of dry, Andean, Amazon, secondary, local (peasant and native communities), and planted forests as well as for agroforestry activities (Peru 2015a). Forest management plans are in some cases not implemented due to lack of compliance enforcement. Better control is expected with the new legislation, which has just been enforced. In the Peruvian forestry laws and operational rules, there are some points relating forest management and water, like riparian forests care, wetlands considerations, logging practices, and streams and forest roads crossings. There is also a general related review publication on hydrological impacts of forestry operations available (Stadtmuller 1994) and a Peruvian fieldwork guide (Sabogal et al 2004).
9.1.4 Deforestation and degradation impacts Forest loss and degradation are the main threats faced by the Peruvian forests. The average annual deforestation in the Amazon rainforest since this process began to be measured is almost 175000 hectares. Between 75% and 90% of deforestation is due to the slash and burning of forests to agricultural activities of small scale (less than 5 hectares) and often is associated with lowincome populations that migrate to the jungle. During the last decade opening of new roads and the improvement of old ones increased the accessibility to new forest and so the deforestation by expansion of rural settlements and entrepreneurs. Production of the goods demanded by the market, such as cocoa, coffee and palm oil, local alluvial mining and hydrocarbon exploitation are important deforestation drivers; as well as illegal logging activities which without destroying the whole forest cover, during the last decades has almost erased out of the accessible Amazon forests the most valuable species like palo rosa (Aniba roseodora), kapok or lupuna (Ceiba pentandra), cedar or cedro (Cedrela odorata), mahogany or caoba (Swietenia macrophyla). The highest deforestation pressureover the period 2000 - 2013 occurred in those forests that do not fit into any category of forest formal use and, therefore, do not have an authority to be responsible for its administration or care. As a result of decades of deforestation and degradation the extension of secondary forest in Peru at present reachs about 8 million hectares. About the short term fate of the Peruvian Amazon region, Dourojeanni et al (2011) point out that the way political decisions are taken for the unplanned infrastructure development and the exploitation of the Amazonian natural resources is a serious threat to the future of the region and Peru. Instead of promoting good development, it is causing a situation in which everyone loses except those few who make profits from the unsustainable exploitation activities. The development of the region should be governed by a broad democratic planning and participatory process, which is yet to be created and improved in Peru. It is advisable to establish a moratorium on decisions for the start or implementation of new large projects. The issues of environmental and social responsibility must be much more elaborate and in the terms of reference of each project, the whole externalities and other costs should be clearly included. In addition, the role of the environmental sector in the process of 135
Forest management and the impact on water resources: a review of 13 countries
project approval needs to be enforced. Unfortunately this seems not to be the case in Peru where for the sake of facilitate investments some environmental rules have been weakened.
9.1.5 Water resources of Peru Peru is among the ten countries with the largest reserves of water in the world, taking into account its potential surface water and groundwater. However, it is a country of extreme hydrological differences as shown in table 2 and figure 2. The Atlantic slope, the great Amazon basin, which represents more than 70% of the Peruvian territory, receives high annual precipitation and yield abundant water resources (about 98% of available water in the Peru), but has a low population density and little industrial development. On the other hand, the Pacific slope has 53 basins that concentrate lest than 2% of water resources of the country, but is home of about 65% of the national population, the most populous cities of the country and the largest concentration of economic activity which provides over 80% of GDP. A third separate basin system is that of Lake Titicaca, which contains about 0.5% of available water in 9 basisns, and provides to 5% of the population. That is why, despite the apparent abundance of water, Peru is among the five countries most vulnerable to climate change (ANA et al 2015). Table 2. Distribution of Area, Population and Water Resources in Peru. Modified from Kuroiwa 2012, based on ANA 2009. Basin systems
Area
Population
Water availability
(103 km2)
People
%
M m3/year
%
m3/person/ year
Pacific
279.5
18,315,276
65
37,363
1.8
2,040
Atlantic
958.5
8,579,112
30
1,998,752
97.7
232,979
Titicaca
47.2
1,326,376
5
10,172
0.5
7,669
1,285.2
28,220,764
100
2,046,268
100
*72,510
Total *National average
9.2 Literature review According to Gilmour (2014), concerns about the hydrological impact of forest management go back more than a century and continue to the present day. These concerns have tended to focus on the effects of forests and forest management on various streamflow parameters (total water yield, low flows, flood flows), soil erosion, sedimentation, water quality, landslides and the water use of different vegetation types and species. There is now a solid body of scientific information for understanding and interpreting the relationships between forests and water in both temperate and tropical regions. However, there is also a parallel and deeply entrenched “popular narrative” that often runs counter to the consensus views of the forest hydrology scientific community. The same author (Gilmour 2014), points out that the primary general elements of this popular narrative are as follows: 1. 2. 3. 4. 5. 6. 7.
136
Forests increase rainfall (conversely, removal of forests: decreases rainfall). Forests increase water yield (removal of forests decreases water yield). Forests reduce floods (removal of forests increases floods). Forests increase baseflows (removal of forests decreases baseflows). Forests regulate high and low flows (removal of forests unregulate streamflows). Forests reduce erosion (removal of forests increases erosion). Forests prevent/mitigate landslides (removal of forests increases landslides).
Chapter 9. Forest Management and Water in Peru
In Peru the forests-water issues are mostly dealt with only in academic circles and around some forestry and related schools. Most of the policy makers working on topics closely related to these themes and located in forested regions have not clear concepts about such relationships. Thus, the problem to face first is to improve the communication practices and facilitate the understanding of scientific knowledge, trying to increase the applied research in each Peruvian forest type if possible. However, there is at least one interesting point to be emphasized considering the Peruvian reality (as well as others in Andean and Amazon countries), having in mind that the element 1 indicated above by Gilmour (2014) was originally developed for temperate forests. In Peru, accepting that “forests do not increase rainfall” would at least require an explanation for two exceptions to this rule. First, the case of the extensive and continuous Amazon dense forests (6.5 million km2, about 15% in Peru) whose evapotranspiration process puts some 20 billion tons of water into the atmosphere each day (Nobre 2014) and could generate more than 50% of its own rainfall which is kept in the catchment by the high Andean mountains. This huge volume of rain water even reaches other adjacent subbasins of La Plata river watershed and influence the continent and the world as shown in figure 5 (Salati 1986, Victoria et al 1992, Marengo 2006, Makarieva and Gorshkov 2007, Nobre 2014). The second one is thet well known mountain cloud forest scenario in which the “horizontal precipitation” is intercepted and the ever present mists condensed by the tree canopy on the hillsides and drips to the soil (Hamilton et al 1993, Gómez-Peralta 2008, Bruijnzeel et al 2010, Llerena et al 2010, Catchpole 2004, 2012). About the other Gilmour (2014) elements, from 2 to 7, the popular and not so popular confusion is still prevalent among much people.
al 1992, Marengo 2006, Makarieva and Gorshkov 2007, Nobre 2014). The secon nown mountain cloud forest scenario in which the “horizontal precipitation” is in er present mists condensed by the tree canopy on the hillsides and drips to the soil et al 1993, Gómez-Peralta 2008, Bruijnzeel et al 2010, Llerena et al 2010, Catch out the other Gilmour (2014) elements, from 2 to 7, the popular and not so popula is still prevalent among much people.
Figure 5. Amazon rains
137 al cycle of the northern dry forests are strongly controlled by the seasonal regimes ctuations of the water table. These forests domain is defined by extreme events li
Forest management and the impact on water resources: a review of 13 countries
The natural cycle of the northern dry forests are strongly controlled by the seasonal regimes of rains and the fluctuations of the water table. These forests domain is defined by extreme events like the ENSO related floods after which the dry forests dormant natural regeneration thrive and increase their surface cover. The upper Andean natural and planted forests are strongly depending to its latitude and elevation which fairly correlate with rains and temperature. Northern latitude locations are much more watered than central or southern ones and the extended debate over planting trees and using native or exotic species (Hamilton and King 1983, Bruijnzeel 1990, 2004, Lima 1993, Farley et al 2005, Calder et al 2007, Buytaert et al 2007, Hamilton et al 2008, CIFOR 2012, Gilmour 2014) in Peru, arouse mainly in these areas. Trees adapted to higher elevations could reach more than 4000 masl, and grow on grass dominated areas, wetlands and peatlands. Main threats to these special ecosystems are associated to glaciers reduction and a warmer climate (Bradley et al 2006). At the eastern side of the Andes, going down from the high Andean prairies, the heath and the cloud forest benefit from abundant rains and the ever present fog. The lowlands are the realm of different types of riparian seasonal flooded, alluvial and hill forests along and around big meandering and braided rivers. Despite that there are a few spots of drier forest in the Peruvian Amazon region, water has not been a real problem. However the last big Amazon drought episodes during 2005 and 2010 followed by record flood events, meant a very serious problem to the Amazon flora and fauna (Nepstad et al 2007, Phillips et al 2009, Espinoza et al 2011, Lewis et al 2011, Marengo et al 2011, Gloor et al 2013, Bodmer et al 2014, Espinoza et al 2014, Meir et al 2015, Marengo and Espinoza 2015). At present a promising approach to the forest-water relationship is the concept of ecosystem hydrological services (Dudley and Stolton 2003, FAO 2004, Llerena 2005, Hamilton et al 2008, Quintero 2010, Meier et al 2011, Hayek and Martínez de Anguita 2012, Gilmour 2014). Currently there are ventures and projects aimed at giving back to the people of the higher basins that conserve their wetlands, grasslands and forests, and by keeping them in good condition generate more and better water for downstream residents, who should reward such service. The main attempts to implement on forested watersheds what the concepts and the hydrological theory clearly support are mostly related to natural protected areas and are located in the following basins: Rumiyacu, Mishquiyacu and Almendra, Protected Forest of Alto Mayo, San Martín; Cañete, Nor YauyosCochas Landscape Reserve; San Alberto, Yanachaga-Chemillén National Park, Oxapampa, Pasco; Cumbaza, Cordillera Escalera Regional Conservation Area, San Martín; Tilacancha, Private Conservation Area, Chachapoyas, Amazonas (Llerena and Yalle 2014). During the last 40 years several institutions and projects, national and from abroad, individually and in association, have contributed in Peru to the forest and water knowledge. Some of these contributions are from UDEP (Tume et al 1989, Palacios y Tume 1991), which studied the dry forests; CONDESAN, iMHEA and ECOBONA (Buytaert et al 2007, Ochoa-Tocachi, in press, Tobón 2008) worked on Andean grasslands and forests. Important research at the upper and lower Amazon forests was or is done by: TROPSOILS (Elsenbeer 1989, Elsenbeer et al 1994, 1995); CAMREX (Aufdenkampe et al 2001, 2007); AARAM (McClain and Llerena 1998, Glauber 2001, McClain et al 2001, Molina 2001, Moll 2001, Ordoñez 2001, Sánez 2001, Ramos 2002, Rodríguez 2002, McClain and Cossio 2003, Alemany 2004, McClain et al 2007); LBA (Werth and Avissar 2002, Llerena 2007a); HYBAM (IRD 2014, Espinoza et al 2014); RAINFOR (Malhi et al 2008, 2009, 2010, Brienen et al 2015); UNALM (Ruiz 1985, Ormachea and Llerena 1992, Marmillod et al 1992, Velásquez 2002, Zanabria and Llerena 2003, Roncal 2006, Llerena 2007, Llerena 2007b, Llerena et al 2007, 2010, 2011, Llerena and Yalle 2014, Reyes 2014); UTU-ART (Salo 1988, Kalliola 1992).
9.3 Politics In response to internal demands of forest stakeholders and international commitments, Peru is undergoing a reform process of its public forestry administration. There is a new national policy framework, the Forest and Wildlife Act, that has just been regulated and by which the National Forest and Wildlife Service (SERFOR) was created as the national forestry and wildlife authority, 138
Chapter 9. Forest Management and Water in Peru
governing body of the National System of Forest and Wildlife Management, constituting at a national level the technical-regulatory authority. However, at a regional level, the Regional Governments, through the Organic Law of Regional Governments, assume the responsibility of forest control and management, as well as granting access rights (authorization certificates) to forest resources within its scope of action. The new forestry administration includes new principles and approaches such as, the ecosystem, the landscape, the sustainability, and the climate change approach; by which it seeks an integrated management of forestry resources and wildlife, including ecosystems services and its contribution to relief and adjustment of ecosystems and populations faced with the impacts of climate change. The National Forest and Wildlife Policy, adopted in August 2013, is another important tool within the reform of public administration. It establishes the core policy by honoring the treaties, international agreements and contracts ratified by Peru. The principles of the forestry administration include intersectoral approaches and incorporates the principles related to sustainability, competitiveness and ecology; understood as the integrated management of land, water and living resources, promoting conservation and sustainable use in an equitable way, recognizing the importance of wild ecosystems as a space of life, wildlife habitat and water source, and its contribution to food security and welfare of rural population who depend of it. For the implementation of the new approaches to the forestry administration, the direct and indirect causes of deforestation and forest degradation have been identified. The forestry policy guides the lines of action towards conservation, protection, maintenance, improvement and sustainable use of the forest resources and wildlife of the nation, among them the different types of forests: Amazon Rainforest, dry forest, relict, bogs, moors, other threatened Andean ecosystems, and wild plant formations according to ecological characteristics and goods and services they provide. It also promotes the establishment of forest plantations on private or communal lands for multi purposes with public and private investment. To manage ecosystems that are threatened or in process of degradation lines of action and recovery options have been established, primarily using native species, especially in the basins headwaters and riparian strips. These actions consider the provisions in the Regulations of Water Resources Act, which establish coordinated work with the forestry and national wildlife authority and Regional and Local Governments, in its framework of action, and water user organizations for the promotion of programs and projects of forestation in marginal strips to avoid the erosive action of the water. The National Water Resources Plan recognizes the basin headwaters reforestation as a strategy to increase the availability of water resources, although the role of forest and tree plantations are not considered for water quality, it does consider the recovery and protection of the quality of water resources in natural sources and ecosystems. In regards to forest plantations, 2014 saw the approval of the Board of Promotion of Forest Plantations for private land to promote private investment in the development of forest plantations on private land, dictating favorable measures and incentives for simplifying the registration procedure for forest plantations and for the transport of its products. Plantations in public land are governed by a different kind of law. However, some important issues remain to be addressed, such as legal security, tax incentives, financing mechanisms, technological innovation, among others already identified in the National Reforestation Plan, approved in 2006. It is important to note that in this plan it is indicated erroneously that forest plantations increase the river flow. Moreover, Peru is developing the National Strategy for Forests and Climate Change and the national strategic document on REDD + in order to coordinate, integrate and complement existing sectoral and subnational approaches related to the conservation and sustainable use of forests including protected areas, indigenous lands, and all categories of the system of the forest heritage. It is intented to have involvement of the private sector for investment in forest plantation projects that involve mechanisms for environmental payment services; however, there are still barriers and constraints, such as property rights, illegal activities (mining, illegal crops), access to formal finance, value chain development, the technological gap, among others. The State recognizes that a substantial element, even though not shown in the economic figures, is the role of forests as providers of livelihoods 139
Forest management and the impact on water resources: a review of 13 countries
for rural people of the Amazon, as one of the major terrestrial drains of greenhouse gases (GHG) contributing to the removal of about 53 Gg of CO2 equivalent per year; however, responsible for 40% of total GHG emissions, considering that the total net GHG emissions in the country is estimated at 138 million tons of CO2 equivalent, mainly attributed to the change in land use. In this context, comprehensive intervention logic comprises transverse actions generating enabling conditions (governance, certification) which allow investments aimed at reducing the pressure on forests and restoring degraded areas, as well as investments aim to increase the competitiveness of the forests. With these changes generated by the new administration, research plays an important role in all lines of action for forestry management, because it generates knowledge and scientific basis for decision-making within a framework of sustainable development that contributes to conservation, forestry management and wildlife and generating resources value for the welfare of the population. In this way the new structure involves the Studies and Investigation Research as part of the General Policy and Competitiveness Directorate, and General Management Knowledge Directorate, that cowork with other Directorates as well as with the National Institute for Agrarian Innovation (INIA), other research institutions like the Peruvian Amazon Research Institute (IIAP), universities; and maintain relations with national and international institutions involved in related activities to support and achieve the strategic objectives and functions of the SERFOR.
9.4 Climate change and the future of forestry & forest research The impact of climate change on natural and forested ecosystems have been widely covered and well documented during the last years in the world and in the Americas (Llerena 1991b, Locatelli et al. 2009, Sebastian et al 2011, Cuesta et al. 2012a, 2012b, Nobre 2014). In Peru the National Strategy on Forests and Climate Change has just been delivered for public opinion and criticism (Peru 2015b), and project reports, reviews and publications are due to the special biophysical complexity of its territory, projections beyond the general trends on future higher temperatures (i.e. precipitation projections) are difficult to point out. However, working on the perceptions of the senior local people, consulting with the regional authorities and checking their institutional awareness; looking at useful research, and consulting climate specialists Llerena et al. (2014a) were able to provide some insights on the present situation and its perspectives at dry forests in Piura, planted forests in Porcón, Cajamarca, and in an extensive lower Amazon forestry concession on the right border of the Ucayali river, near Atalaya, working with native people of the villages Galilea and Nueva Esperanza, sharing part of its communal lands. Piura was the region with the best institutional framework, orderly teamworking with several regional and national organizations, public, private, and international, including universities, with a good climate database as well as instrumentation and even early alert systems, with good communication stablished with the general public and the rural communities. The leaders of the rural village visited were also well prepared persons able to deal with the demands of local people supported in great part by the carob tree, mesquite or algarrobo (Prosopis pallida) which are dominant forests; and mainly their goat herds. Local research carried out with international support, showed a clear trend towards a growing thermal amplitude of the maximum and minimum temperatures which seems to affect the carob trees and other local species (Cajusol 2013). In Porcón, the community involved in the climate change exploration was more distant from the main city and more controlled by the local leaders under a strict religious regulation. The senior people could clearly see the differences the new planted forests had made in contrast to the original degraded, moist and windy grasslands. Their perceptions of the positive environmental, social, and economical influences of the new landscape with in between 20 and 30 years old, 12000 ha of planted forests (60% Pinus patula) were evident. They have a meteorological station but there were not visible interest in doing any kind of research or invest in additional instrumentation to face possible climate demands.
140
Chapter 9. Forest Management and Water in Peru
The native people at Galilea and Nueva Esperanza are, general speaking, the ethnic group with deeper roots in their lands. So, the perceptions of the senior citizens could be more clearly contrasted with the older times. Perceptions of the population indicate that the climate is changing in recent years. They fell that at present the temperatures are higher and rains more frequent. It is reported that during the last 10 years the dry season has been temporarily extended one month, beginning the month of June. Most people clearly remember that in previous years rains normally declined from July to October. Concerning flooding, it currently occur between January and April and presented before between February and May. About the cold fronts or friajes, they use to present only in winter (July to September) and now they also occur in autumn (April to June) and much more frequently. There used to be a meteorological station at the forestry concession but since the company retired data gathering has been neglected. It is interesting to notice how the local people check and control their environment simply paying attention to the phenological stages of their local trees and shrubs. These three different Peruvian cases provide interesting insights on each forest situation facing possible climate changes, taking advantage of the local knowledge. In addition, Espinoza (2015) briefly presents a very complete information about the impacts and projections in the Amazon basin, based upon modern research done during the last years. He points out that, consistent to the tropical region warming, the Peruvian Amazon has encountered an temperature increase of 0.09 °C per decade since 1965 (Lavado et al 2013), while recent studies show a decline in rainfall from 1970 (Espinoza et al 2009, Lavado et al 2012) with a significant increase of the dry season from 1980 (Fu et al 2013). In relation to this, more frequent and severe droughts have occurred in the past decade (Espinoza et al 2011, Marengo et al 2011) producing forest fires (Fernandes et al 2011) and it is estimated that tree mortality during these droughts increased 400% compared with normal years (Brando et al 2014). An increase in the mortality rate of the Amazonian biomass has been observed over the past three decades (Brienen et al 2015), consistent with a reduced capacity of the forest to absorb CO2. The authors suggest that climate variability, including extreme droughts, could be responsible for these changes (Brienen et al 2015, Lewis et al 2011). Just between 2005 and 2014 there have been two historic droughts and three catastrophic floods. Extreme droughts are mainly associated with warm conditions of the sea surface temperature of the tropical Atlantic Ocean and El Niño events, while severe floods are associates primarily (not exclusively) to La Niña events (Marengo et al 2015). The projections of the models CMIP5 at a regional scale for the end of the twenty first century show a consensus on warming in the Amazon region. A possible increase of up to 2°C for RPC2.6 emissions scenarios and up to 5.2°C for RCP8.5 scenario is estimated (Blázquez et al 2013, Jones et al 2013). Precipitation projections range from +10% to -25% with a huge discrepancy of the models results. Recent studies project a slight increase in volume during high flows season and a significant decline of volume during low flows season (Guimberteau et al 2013), coinciding with a lengthier dry season in the future (Fu et al 2013). Warmer and drier conditions could result in irreversible impacts to the Amazon rainforest (Cox et al 2004, Nobre et al 2009), which reinforces the hypothesis of a possible “Amazonian savannization” (Oyama et al 2003, Salazar et al 2007, Malhi et al 2008). Indeed, the models linking climate with vegetation projected a shift from a tropical forest ecosystem to a savannah for the second half of the twenty first century (Oyama et al 2003, Salazar et al 2007). Even though a possible collapse of the tropical rainforest, in terms of its intensity and extension is still highly uncertain; studies show that the projected increase of water stress during the dry season towards the end of the twenty first century and the increase of evapotranspiration could favor the Amazon region climate to be more conducive to the development of seasonal forest rather than tropical forest as we currently know it (Malhi et al 2009, Costa et al 2010). This is a high-risk scenario considering the important role of the Amazon rainforest in regulating moisture transport at a regional level (including the Andes) (Makarieva et al 2013, Zemp et al 2014) and in carbon balancing for the planet (Cox et al 2004). However, these projections could worsen by potential changes in land use in the Amazon induced by human activities such as deforestation, agricultural expansion, etc. (Nobre et al 1991, Sampaio et al 2007, Costa et al 2007, Coe et al 2009, Georgescu et al 2013, Moore et al 2007). 141
Forest management and the impact on water resources: a review of 13 countries
The diverse forests ecosystems including water resources are indeed threatened by climate change, but decades before this present threat arose, all the forests of the world have been seriously depleted by the human beings. So, it will not be too outrageous to say that we need to give each problem its right treatment and priority, while we find ways to clarify our doubts and uncertainties and made the best possible decisions on our forestry management and water practices. On this regard communication is very important as well as to take into consideration each kind of useful knowledge. Forestry practices alone are not any longer a good reply to the present situation. Now is very important, and maybe the only effective answer, to the more pressing land use problems to integrate forest management with other land uses, like on-farm conservation land management for preserving and enhancing ecosystem services in agricultural and forested landscapes together as Thorn et al (2015) point out now in the same way Lal and Russell (1981) did almost 35 years ago. The Faculty of Forest Sciences of the Universidad Nacional Agraria La Molina (FCF UNALM) in Lima, is just dealing with a real life problem at the Dantas experimental forest (Marmillod et al 1992, Nalvarte et al 1993). This unit used to be a very active research an education center, until the years of socio-political unrest in the zone took everyone out of there. New people migrated into the premises, a new road was built, and part of the forest was destroied and even converted to illegal crops. FCF UNALM wants to regain the property and the first steps with the local people were already taken successfully. At present, the organization of multidisciplinary teams with agronomists, economists, agricultural engineers, animal husbandry, fisheries, and food and social science specialists, among others, is underway in order to properly deal with the local demands and pressures, restore the ecosystem potential, improve the local livelihood and governance, reclaim the space, and share the experience.
9.5 Acknowledgments To Beatriz Llerena and Adriana Hermoza, for their very important last minute support with English translations and review, as well as tables and figures design and improvement. To Michael Valqui for sharing useful information. To Pablo García-Chevesich, for his consideration, patience and kind support.
9.6 References Alemany N. C. 2004. Erosión hídrica y usos de la tierra en la cuenca del río Llamaquizú, Oxapampa, Perú. Trabajo de Fin de Carrera de Licenciado en Ciencias. Ambierntales, Universidad Politécnica de Valencia - UNALM, La Molina, 45 pp. + anexos. Aufdenkampe A.K., Hedges J., Richey J.E., Krusche A.V., Llerena C.A. 2001. Sorptive fractionation of dissolved organic nitrogen and amino acids onto fine sediments within the Amazon Basin. Limnology and Oceanography 46 (8): 1921-1935. Aufdenkampe A.K., Mayorga E., Hedges J.I., Llerena C.A., Quay P.D., Gudeman J., Krusche A.V., Richey J.E. 2007. Organic matter in the Peruvian headwaters of the Amazon: Compositional evolution from the Andes to the lowland Amazon mainstem. Organic Geochemistry 38: 337-364. ANA. 2009. Política y Estrategia Nacional de Recursos Hídricos del Perú. Autoridad Nacional del Agua, Lima, 85 p. ANA, COSUDE, WWF. 2015. Huella Hídrica del Perú. Sector Agropecuario. Autoridad Nacional del Agua, Agencia Suiza para el Desarrollo y la Cooperación, Fondo Mundial para la Naturaleza, Lima, 58 p. Blázquez J., Nuñez M.N. 2013. Analysis of uncertainties in future climate projections for South America: comparison of WCRP-CMIP3 and WCRP-CMIP5 models. Climate Dynamics 41(3-4), 1039-1056. Bodmer R.E., Fang T.G., Puertas P.E., Antúnez M., Chota K. y Bodmer W.E. 2014. Cambio climático y fauna silvestre en la Amazonia peruana. Impacto de la sequía y de las inundaciones intensas en la Reserva Nacional Pacaya Samiria. Fundación Latinoamericana para el Trópico Amazónico (Fundamazonia). Lima, 254 p. Bradley R.S., Vuille M., Díaz H.F., Vergara W. 2006. Threats to Water Supplies in the Tropical Andes. Science 312: 1755-1756. 142
Chapter 9. Forest Management and Water in Peru Brando P.M., Balch J.K., Nepstad D.C., Morton D.C., Putz F.E., Coe M.T., Silvério D., Macedo M.N., Davidson E., Nóbrega C.C., Alencar A., Soares-Filho B.S. 2014. Abrupt increases in Amazonian tree mortality due to drought-fire interactions. Procedings of the National Academy of Sciences doi: 10.1073/pnas.1305499111. Brienen R.J.W., Phillips O., Feldpausch T.R., Gloor E., Baker T.R., Lloyd J., López-González G., MonteagudoMendoza A., Malhi Y., Lewis S.L., Vásquez-Martínez R., Alexíades M., et al 2015. Long-term decline of the Amazon carbon sink. Nature 519: 344-348. doi:10.1038/nature14283. Bruijnzeel L.A. 1990. Hydrology of moist tropical Forests and effects of conversion: a state of knowledge review. UNESCO, IAHS, Free University Amsterdam, 224 p. Bruijnzeel L.A. 2004. Hydrological function of tropical forests: not seeing the soil for the trees. Agriculture Ecosystems & Environment 104: 185-228. Bruijnzeel, L.A., Scatena F.N., Hamilton L.S. (edits.). 2010. Tropical Montane Cloud Forests. Science for Conservation and Management, Cambridge University Press, 740 p. Buytaert W., Iñíguez V., De Bievre B. 2007. The effects of afforestation and cultivation on water yield in the Andean paramo. Forest Ecology and Management 251 (1-2): 22-30. Cajusol C.G. 2013. Impactos del cambio climático y medidas de adaptación para la conservación del bosque seco y sostenibilidad de la cadena de valor de derivados de algarroba en la Región Piura. GIZ, PerúBiodiverso, Gobierno Suizo, Ministerio de Comercio Exterior y Turismo, GORE Piura. Calder I., Hofer, T., Vermont, S., Warren, P. 2007. Towards a new understanding of forests and water. Unasylva 58 (229): 3-10. Catchpole D. 2004 Ecology of vascular epiphytes on a Ficus L. host, Moraceae, in a Peruvian cloud forest, Tesis M.Sc. Geografía y Estudios Ambientales Universidad de Tasmania, 166 pp. Catchpole D. 2012. Orographic gradients in climate and forest cover at the cordillera Yanachaga, Peru, Tesis Ph.D., Geografía y Estudios Ambientales Universidad de Tasmania, 252 pp. CIFOR. 2012. Forests and water: What policy maker should know? Factsheet N°6. Coe M.T., Costa M.H., Soares-Filho B.S. 2009. The influence of historical and potential future deforestation on the stream flow of the Amazon River. Land surface processes and atmospheric feedbacks. Journal of Hydrology 369 (1–2): 165-174. Cossio R., Menton M., Cronkleton P., Larson A. 2014. Manejo forestal comunitario en la Amazonia peruana. Una revisión bibliográfica. Documento de trabajo 140. CIFOR, Lima, 25 p. Costa M. H., Yanagi S.N.M., Souza P.J.O.P., Ribeiro A., Rocha E.J.P. 2007. Climate change in Amazonia caused by soybean cropland expansion, as compared to caused by pastureland expansion, Geophysical Research Letters 34: L07706. Costa M.H., Biajoli L., Sanches A.C.M., Malhado L.R., Hutyra H.R., da Rocha H., Aguiar R.G., de Araujo A.C. 2010. Atmospheric versus vegetation controls of Amazonian tropical rain forest evapotranspiration: are the wet and seasonally dry main forests any different?. Journal of Geophysical Research 115: G04021, doi: 10.1029/2009JG001179. Cox P.M., Betts R.A., Collins M., Harris P.P., Huntingford C Jones C.D. 2004. Amazonian forest dieback under climate-carbon cycle projections for the 21st century. Theoretical Applied Climatology 78 (1–3): 137–156. Cuesta F., Bustamante M., Becerra M.T., Postigo J., Peralvo J. (Eds.) 2012a. Panorama andino de cambio climático. Vulnerabilidad y adaptación en los Andes tropicales. CONDESAN, SGCAN, Lima, 335 p. Cuesta F., P. Muriel, S. Beck, R. I. Meneses, S. Halloy, S. Salgado, E. Ortiz y M.T. Becerra. (Eds.) 2012b. Biodiversidad y Cambio Climático en los Andes Tropicales. Conformación de una red de investigación para monitorear sus impactos y delinear acciones de adaptación. Red Gloria-Andes, Lima-Quito, 180 p. Dourojeanni M.J. 1987. Manejo de bosques naturales en el trópico americano: situación y perspectivas. Revista Forestal del Perú 14 (1): 91-108. Dourojeanni M.J. 2009. Crónica Forestal del Perú. UNALM, UNMSM, Lima, 727 p. Dourojeanni M.J., Barandiarán A., Dourojeanni, D. 2009. Amazonia Peruana en 2021. Explotación de recursos naturales e infraestructura: ¿Qué está pasando? ¿Qué es lo que significa para el futuro?. ProNaturaleza, SPDA, DAR, ICAA, Lima, 162 p. Dudley, N., Stolton S. 2003. Running Pure: The importance of forest protecred areas to drinking water. World Bank/ WWF Alliance for Forest Conservation and Sustainable Use, Washington D.C., 112 p. Elsenbeer H. 1989. Hillslope hydrological processes and their controls in a tropical rainforest environment, Tesis Ph.D., NCSU, Raleigh, 207 p. 143
Forest management and the impact on water resources: a review of 13 countries Elsenbeer H., Lack A., Cassel D.K. 1995. Chemical fingerprints of htdrological compartments and flow paths at La Cuenca, western Amazonia. Water Resources Research 31 (12): 3051-3058. Elsenbeer H., Cassel D.K., Zúñiga L. 1994. Throughfall in the terra firme forest of Western Amazonia. Journal of Hydrology (NZ), 32 (2): 30-44. Espinoza J.C., Guyot J-L., Ronchail J., Cochonneau G., Filizola N., Fraizy P., Labat D., de Oliveira E., Ordoñez J., Vauchel P. 2009. Contrasting regional discharge evolutions in the Amazon basin (1974-2004). Journal of Hydrology 375 (3-4): 297-311. Espinoza J.C., Ronchail J., Guyot J.L., Junquas C., Vauchel P., Lavado W., Drapeau G., Pombosa R., 2011. Climate variability and extreme drought in the upper Solimões River (western Amazon Basin): Understanding the exceptional 2010 drought. Geophysical Research Letters 38 (13): L13406. Espinoza J.C., Ronchail J., Guimberteau M., Guyot J.L., Lavado W., Santini W. 2014. Eventos hidrológicos extremos en la cuenca amazónica peruana: presente y Futuro. In: El Perú frente al cambio climático. Resultados de investigaciones franco-peruanas. IRD, MINAM, Embajada de Francia. 47-57. Espinoza J.C. 2015. Finding observed impacts and future projections in the Amazon basin. Brief review about the state of the art on the Amazon and climate change for MINAM (unpublished) 4 p. FAO. 2004. Sistemas de pago por servicios ambientales en cuencas hidrográficas, Land and Water Discussion Paper 3, Roma 74 p. + CD. FAO. 2015. Global Forest Resources Assessment 2015. How are the world´s forests changing?, Roma, 56 p. Farley K.A., Jobbágy E.G., Jackson R.B. 2005. Effects of afforestation on water yield: a global synthesis with implications for policy. Global Change Biology 11:1565–1576. Fernandes K., Baethgen W., Bernardes S., DeFries R., DeWitt D.G., Goddard L., Lavado W., Eun Lee D., Padoch C., Pinedo-Vasquez M., Uriarte M. 2011. North Tropical Atlantic influence on western Amazon fire season variability. Geophysical Research Letters. 38: L12701, doi:10.1029/2011GL047392 Figueroa C., Wadsworth, F.H., Branham S. 1987. Management of the Forests of Tropical America: Prospects and Technologies. ITF, UPR, USAID, USDA FS & OICD, 469 p. Fu R., Yin L., Li W., Arias P.A., Dickinson R.E., Huang L., Fernandes K., Liebmann B., Fisher R., Myneni R.B. 2013. Increased dry-season length over southern Amazonia in recent decades and its implication for future climate projection. Procedings of the National Academy of Sciences 110: 18110–18115. Gaviria, A., Sabogal C. 2013. Sistematización de seis experiencias de manejo forestal comunitario en la Amazonia peruana. FAO, INF, MINAM, MINAGRI, Lima, 89 p. Georgescu M., Lobell, D.B., Field C.B., Mahalov A. 2013. Simulated hydroclimatic impacts of projected Brazilian sugarcane expansion. Geophysical Research Letters 40 (5): 972-977. Gilmour, D. 2014. Forests and water: A synthesis of the contemporary science and its relevance for community forestry in the Asia–Pacific region. RECOFTC Issue Paper No. 3. The Center for People and Forests, Bangkok, 30 p. Glauber A.J. 2001. Landslide effects on litterfall to Amazonian montane headwater streams, Tesis M.Sc. Universidad de Washington, Seattle, 42 p. + anexos. Gloor M., Brienen R.J.W., Galbraith D., Feldpausch T.R., Schöngart J., Guyot J.L., Espinoza J.C., Lloyd J., Phillips O.L. 2013. Intensification of the Amazon hydrological cycle over the last two decades. Geophysical Research Letters 40: 1–5. Gómez Z.P. 2001. Variabilidad espacio-temporal del nitrógeno e iones mayores en la cuenca del río Pachitea, Perú, Tesis M.Sc. EPG-UNALM, La Molina, 124 pp. + anexos. Gómez P.D. 2000. Composición florística en el bosque ribereño de la cuenca alta San Alberto, Oxapampa, Perú, Tesis Ing. For. UNALM, La Molina, 159 pp. + anexos. Gomez-Peralta D., Oberbauer S.F., McClain M.E., Philippi T.H. 2008. Rainfall and cloud-water interception in tropical montane forests in the eastern Andes of Central Peru. Forest Ecology and Management 255 (3-4): 1315-1325. Guariguata M. (Edit.) 2013. Avances y perspectivas del manejo forestal para uso múltiple en el trópico húmedo. CIFOR, Bogor, 281 p. Guimberteau M., Ronchail J., Espinoza J.C., Lengaigne M., Sultan B., Polcher J., Drapeau G., Guyot J.L, Ducharne A., Ciais P. 2013. Future changes in precipitation and impacts on extreme streamflow over Amazonian sub-basins. Environmental Research Letters 8 (1): 014035. Hamilton L.S., King P.N. 1983. Tropical forested watersheds, Hidrologic and soils response to major uses or conversions, East-West Center/UNESCO-MAB, Westview Press, Boulder,168 pp. 144
Chapter 9. Forest Management and Water in Peru Hamilton L.S., Juvik J.O., Scatena F.N (Edits.). 1995. Tropical Montane Cloud Forests, Ecological Studies Vol.110, Springer-Verlag, Ann Arbor, 407 pp. Hamilton, L.S. 2008. Forest and water. FAO Forestry Paper 155. Roma, 78 p. Hayek F., Martínez de Anguita P. (Edits.) 2012. ¿Gratis?: los servicios de la naturaleza y cómo sostenerlos en Perú. Servicios Ecosistémicos Perú, Lima, 428 p. Herzog S., Martínez R., Jorgensen P., Tiessen H. (Edits.). 2012. Cambio climático y biodiversidad en los Andes tropicales. IAI, SCOPE, París, 426 p. IICA. 2012. Manejo Forestal Sostenible en la Región Andina. Catálogo de Proyectos del Programa MFS. Instituto Interamericano de Cooperación para la Agricultura, Ministerio de Asuntos Exteriores de Finlandia, Lima, 53 p. INRENA. 2005. Plan Nacional de Reforestación. Perú 2005-2024. Lima, 88 p. IRD. 2014. El Perú frente al cambio climático. Resultados de investigaciones franco-peruanas. MINAM, Embajada de Francia, Lima, 156 p. Jones C., Carvalho L.B. 2013. Climate change in the South American Monsoon System: present climate and CMIP5 projections. Journal of Climate 26 (17): 6660-6678. Kalliola R. 1992. Abiotic control of the vegetation in Peruvian Amazon floodplains: environment change and pioneer species. UTU-ART, Ph.D. thesis. Kuroiwa, J. 2012. Recursos hídricos en el Perú. Una visión estratégica. In: Diagnóstico del Agua en las Américas, B. Jimenez and J.G. Tundisi (Coords.), IANAS, FCCT, AC, Mexico DF, 405-219 p. Lal R., Russell E.W. (Edits.). 1981. Tropical Agricultural Hydrology. Watershed Management and Land Use. John Wiley & Sons Ltd., 482 p. Lavado W., Ronchail J., Labat D., Espinoza J.C., Guyot J.L. 2012. Basin-scale analysis of rainfall and runoff in Peru (1969-2004): Pacific, Titicaca and Amazonas drainages. Hydrological Sciences Journal - Journal Des Sciences Hydrologiques 57 (4): 625-642. Lavado W., Labat D., Ronchail J., Espinoza J.C., Guyot J.L. 2013. Trends in rainfall and temperature in the Peruvian Amazon-Andes basin over the last 40 years (1965-2007). Hydrological Processes 41: 2944-2957. doi:10.1002/ hyp.9418 Lewis S.L., Brando P.M., Phillips O.L., van der Heijden G.M.F., Nepstad D. 2011. The 2010 Amazon Drought. Science 331 (6017): 554-554. Lima W. de P. 1993. Impacto ambiental do eucalipto, Edusp, Sao Paulo, 301 pp. Llerena C.A. 1989. Antecedentes sobre Manejo del Bosque Húmedo Tropical. En: Experiencias de Manejo del Bosque Húmedo Tropical en Perú. FAO/Japón, Documento 20, Lima, 20-43. Llerena C.A. 1991a. Contaminación atmosférica, efecto invernadero y cambios climáticos: sus impactos forestales. Revista Forestal del Perú 18 (2): 101-135. Llerena C.A. 1991b. El manejo de Cuencas en el Trópico Húmedo del Perú, Revista Forestal del Perú 18 (1): 63-77. Llerena C.A. 2005. Conceptos sobre cuencas hidrográficas e hidrología forestal relacionados a servicios ambientales y producción de agua. Debate Interinstitucional: Enfoques y Mecanismos de Valoración Multidimensional del Agua y del Pago por Servicios Ambientales. Curso Gestión Integrada de Recursos Hídricos, CAMAREN-Ecuador, IPROGAPerú, Lima, 11 p. Llerena C.A. 2007a. El Proyecto LBA, Xilema 19: 14-18. Llerena C.A. 2007b. El agua y la forestación en las cuencas de la sierra. Xilema 18: 7-13. Llerena C.A., Cruz Z., Durt E., Marcelo-Peña J.L., Martínez K. y Ocaña J.C. 2010. Gestión Ambiental de un Ecosistema Frágil. Los bosques nublados de San Ignacio, Cajamarca, cuenca del río Chinchipe, UNALM, Soluciones Prácticas ITDG, Lima, 130p. Llerena C.A., Hermoza R.M. 2010. ¿Cuántas cuencas hidrográficas hay en el Perú? Xilema 23: 24-26. Llerena C.A., Hermoza R.M. y Llerena C.M. 2011. Las plantaciones forestales y el agua en las cuencas, Xilema 24: 55-59 p. Llerena C.A., Hermoza R.M., Llerena L.M. 2007. Plantaciones forestales, agua y gestión de cuencas, Debate Agrario Nº 42: 79-110. Llerena C.A., Yalle S.R. 2014. Servicios ecosistémicos en el Perú. Xilema 27: 62- 75 p.
145
Forest management and the impact on water resources: a review of 13 countries Llerena C.A., Yalle S.R., Sabogal C. 2014a. Aplicación de las directrices sobre cambio climático para los responsables de la gestión forestal. Planes de ejecución de acciones de adaptación y mitigación priorizadas frente a los impactos del cambio climático en tres áreas del Perú en Piura, Cajamarca y Ucayali. FAO, Lima, 77 p. Llerena, C.A., Yalle S.R., Silvestre E. 2014b. Los bosques y el cambio climático en el Perú: situación y perspectivas. FAO, Lima, 73 p. Llerena L.M. 2007. Evaluación del efecto de tubos protectores con capacidad de condensación de neblinas en el crecimiento inicial de plántulas de col de monte (Tetrorchidium rubrivenium) en Oxapampa, Perú, Tesis Ing. For. UNALM La Molina, 66 p + anexos. Locatelli B., Kanninen M., Brockhaus M., Pierce Colfer C.J., Murdiyarso D., Santoso H. 2009. Ante un futuro incierto. Como se pueden adaptar los bosques y las comunidades al cambio climático. Perspectivas Forestales N° 5 CIFOR, Bogor, 90 p. Lombardi I. y Llerena C.A. 1991. Recopilación y análisis de trabajos de Silvicultura y Manejo Forestal en el bosque húmedo tropical del Perú (Proyecto FAO/Japón). Makarieva A.M. and Gorshkov V.G. 2007. Biotic pump of atmospheric moisture as driver of the hydrologic cycle on land. Hydrology & Earth Systems Science 11: 1013-1033. Makarieva A.M., Gorshkov V.G., Sheil D., Nobre A.D., Li B.L. 2013. Where do winds come from? A new theory on how water vapor condensation influences atmospheric pressure and dynamics. Atmospheric Chemistry and Physics 13: 1039–1056, doi:10.5194/ acp-13-1039-2013. Malhi Y., Roberts J., Betts R., Killeen T., Li W., Nobre C. 2008. Climate change, deforestation, and the fate of the Amazon, Science, 319: 169-172. Malhi Y., Aragão L., Galbraith D., Huntingford C., Fisher R., Zelazowski P., Sitch S., Mcsweeney C., Meir P. 2009. Exploring the likelihood and mechanism of a climate-change-induced dieback of the Amazon rainforest. Procedings of the National Academy of Sciencies 106: 20610–20615. Malhi Y., Silman M., Salinas N., Bush M., Meir P., Saatchi S. 2010. Introduction: Elevation gradients in the tropics: laboratories for ecosystem ecology and global change research. Global Change Biology 16: 3171-3175. Marengo J.A. 2006. Mudanças climáticas globais e seus efeitos sobre a biodiversidade: caracterizaçào do clima atual e definiçào das alteraçôes climáticas para o territorio brasileiro ao longo do século XXI. Biodiversidade 26, Brasilia, MMA, 212pp. Marengo J.A., Tomasella J., Alves L.M., Soares W.R., Rodriguez D.A. 2011. The drought of 2010 in the context of historical droughts in the Amazon region. Geophysical Research Letters 38: L12703. Marengo J.A., Espinoza J.C. 2015. Review Article. Extreme seasonal droughts and floods in Amazonia: Causes, trends and impacts. Intenational Journal of Climatology 19 p. DOI: 10.1002/joc.4420 Marmillod D., Nalvarte W. y Llerena C.A. 1992. La Unidad Modelo de Manejo y Producción Forestal Dantas. Revista Forestal del Perú 19 (1): 7-17. McClain M.E., Aparicio L.M., Llerena C.A. 2001. Water use and protection in rural communities of the Peruvian Amazon basin. Water International 26 (39): 400-410. McClain M.E., Cossio R.E. 2003. The use of riparian environments in the rural Peruvian Amazon. Environmental Conservation 30 (3): 242-248. McClain M.E., Galarraga R., Llerena C.A. y Ruiz J.E. 2007. Linking Global Change Research to Improved Policies and Management for Amazonian Rivers. En: Communicating Global Change Science to Society, editores: H. Tiessen, M. Brklacich, G. Breulmann y R. S.C. Menezes, Publicación SCOPE 68, Island Press, Washington DC, pp. 171-178. McClain M.E., Llerena C.A. 1998. El Manejo de Cuencas en Perú: de los Andes a la Amazonia. Agua y Riego (IPROGA), vol. 12. Meir, P., Mitchell, A., Marengo, J., Young, C., Poveda, G., Llerena, C.A., Rival, L., Meneses, L., Hall, A., Betts, R., Farley, J., Fordham, S., Trivedi, M. 2011. Ecosystem Services for Poverty Alleviation in Amazonia. Global Canopy Programme y Universidad de Edimburgo, UK, 195p. Meir P., Wood T.E., Galbraith D., Brando P., Da Costa A.C.L., Rowland L., Ferreira, L. 2015. Threshold responses to soil moisture deficit by trees and soil in tropical rain forests: Insights from field experiments. BioScience 65 (9): 882-892. MINAM. 2012. Memoria Descriptiva. Mapa de cobertura Vegetal del Perú. Lima, 75 p. MINAM. 2014. Peru Kingdom of Forests. Lima COP20, CMP10. German Cooperation, Swiss Cooperation, Lima, 303 p. 146
Chapter 9. Forest Management and Water in Peru Molina J.A. 2001. Caracterización hidrológico-forestal de dos microcuencas con diferente cobertura vegetal en la cuenca del río San Alberto, Oxapampa, Perú, Tesis M.Sc. EPG-UNALM, La Molina, 91 p. + anexos. Moll M.E. 2001. Estudio de la infiltración en las dos microcuencas experimentales del proyecto AARAM-Perú (Wara y Killa) en San Alberto, Oxapampa, Ejercicio de Fin de Carrera de Ing. Técnica Forestal, Universidad Politécnica de Valencia, Gandía - UNALM, La Molina, 108 pp. + anexos. Moore N., Arima E., Walker R., Ramos da Silva R. 2007. Uncertainty and the changing hydroclimatology of the Amazon. Geophysical Research Letters 34 (14). Nalvarte W., Kroll B., Lombardi I. 1993. Plan Maestro. Unidad Modelo de Manejo y Producción Dantas. UNALM, 148 p. Nepstad D.C., Verissimo A., Alencar A., Nobre C., Lima E., Lefebvre P., Schlesinger P., Potter C., Moutinho P., Mendoza E., Cochrane M., Brooks V. 1999. Large-scale impoverishment of Amazonian forests by logging and fire. Nature 398: 505-508. Nepstad D.C., Tohver I.M., Ray D., Moutinho P., Cardinot G. 2007. Mortality of large trees and lianas following experimental drought in an Amazon forest. Ecology 88 (9): 2259-2269. Nobre, A.D. 2014. El Futuro Climático de la Amazonia. Informe de Evaluación Científica. In: Pan-Amazonia: escenarios y desafías de la crisis climática. ARA, Lima, 14-65 p. Nobre C., Sellers P., Shukla J. 1991. Amazonian Deforestation and Regional Climate Change. Journal of Climatology 4: 957–988. Nobre C., Borma L.S. 2009. Tipping points’ for the Amazon forest. Current Opinion in Environmental Sustainability 1: 28–36, doi: 10.1016/j.cosust.2009.07.003. Ochoa-Tocachi B. et al Impacts of land use on the hydrological response of tropical Andean ecosystems. Hydrological Processes, special issue on South American hydrology (in press). Ordoñez J. 2001. Análisis hidrometeorológico y aplicación del modelo IPH-MEN en la cuenca del río Pachitea, Tesis M.Sc. EPG-UNALM, La Molina, 145 pp. + anexos. Ormachea M., Llerena C.A. 1992. Erosión hídrica en el bosque húmedo tropical de Dantas. Revista Forestal del Perú 19 (1): 19-34. Oyama M.D., Nobre C., 2003. A new climate-vegetation equilibrium state for Tropical South America. Geophysical Research Letters 30: 2199. Palacios A., Tume P. 1991. Medición de la transpiración en árboles. Revista Forestal del Peru 18 (2): 45-54. Perú. 2015a. Reglamento de la Ley Forestal, 4 volúmenes: Gestión forestal; Gestión de la fauna silvestre; Gestión de plantaciones forestales y sistemas agroforestales; Gestión forestal y de fauna silvestre en comunidades nativas y campesinas. DS 018, 019, 020, 021-2015-MINAGRI. Diario Oficial El Peruano 30/09/2015, separata especial: 562528-562662. Perú. 2015b. Hacia una estrategia Nacional sobre Bosques y Cambio Climático. Documento preliminar. DS N° 011-2015-MINAM. Comisión Multisectorial: MINAM, MINAGRI, Ministerio de Cultura, MRREE, MEF, Lima, 112 p. Phillips O.L. et al (66). 2009. Drought Sensitivity of the Amazon Rainforest. Science 323: 1344-1347. Quintero M. (Edit.). 2010. Servicios Ambientales Hidrológicos en la Región Andina, IEP, CONDESAN, Lima, 252 pp. + 7 anexos. Ramos O. 2002. Pérdidas de nitrógeno del bosque de neblina en las subcuencas de San Alberto, Oxapampa, Perú, Tesis M.Sc. EPG-UNALM, La Molina, 89 pp + 7 anexos. Reyes R. 2014. Influencia de cuatro sistemas de uso de la tierra (Teca, cítricos y café bajo sombra manejado y en abandono) en la sortividad en el IRD Selva, Fundo La Génova, Chanchamayo, Junín, Tesis Ing. Forestal, UNALM, La Molina, 117 p. Rodríguez M.E. 2002. Estudio comparativo de la influencia de la vegetación en el ciclo hidrológico en dos microcuencas experimentales del río San Alberto, Oxapampa, cuenca del Pachitea, Proyecto AARAM-Perú, Ejercicio de Fin de Carrera de Ing. Técnica Forestal, Universidad Politécnica de Valencia, Gandía - UNALM, La Molina, 93 p + 7 anexos. Roncal W. 2006. Influencia de las plantaciones forestales sobre la escorrentía superficial y la erosión hídrica en Porcón, Cajamarca, Perú. Tesis M.Sc., EPG-UNALM, 138 p. Ruiz G.R.A. 1985. Evaluación de la influencia del bosque de protección en la conservación del suelo y agua en Oxapampa, Perú, Tesis M.Sc., EPG-UNALM ,La Molina, 148 p.
147
Forest management and the impact on water resources: a review of 13 countries Sabogal C., Carrera F., Colán V., Pokorny B., Louman B. 2004. Manual para la planificación y evaluación del manejo forestal operacional en bosques de la Amazonia peruana. INRENA, CIFOR, FONDEBOSQUE, CATIE, Lima, 279 p. Sabogal C., Casaza J. 2010. Standing tall: Exemplary cases of sustainable forest management in Latin American and the Caribbean. FAO, Junta de Castilla y León, Rome, 276 p. Salazar L.F., Nobre C., Oyama M.D. 2007. Climate change consequences on the biome distribution in tropical South America. Geophysical Research Letters. 34: L09708. Salo, J. 1988. Rainforest diversification in the western Amazon basin: the role of river dynamics. UTU-ART, Ph.D. thesis. Sampaio G., Nobre C., Costa M.C., Satyamurty P., Soares-Filho B.S., Cardoso M. 2007. Regional climate change over eastern Amazonia caused by pasture and soybean cropland expansion, Geophysical Research Letters 34, L17709 Sánez P.J.M. 2001. Use of the BMWP system for assessing water quality in San Alberto river (Oxapampa, Peru), Tesis M.Sc., IHE, Delft, 44 pp. + anexos. Saunders T.J., McClain M.E. y Llerena C.A. 2006. The biogeochemistry of dissolved nitrogen, phosphorus, and organic carbon along terrestrial-aquatic flowpaths on a montane headwater catchment in the Peruvian Amazon. Hydrological Processes 20: 2549-2562. Sebastian K. Herzog, S.K., Martínez, R., Jørgensen, P.M., Tiessen, H. (Edits.) 2011. Climate Change and Biodiversity in the Tropical Andes. Inter-American Institute for Global Change Research (IAI) and Scientific Committee on Problems of the Environment (SCOPE), 348 p. Stadtmuller T. 1994. Impacto Hidrológico del Manejo Forestal de Bosques Naturales Tropicales: Medidas para Mitigarlo, una revisión bibliográfica, CATIE-COSUDE, Colección Silvicultura y Manejo de Bosques Naturales Nº 10, Turrialba, 62 p. Thorn J., Snaddon J. Waldron A., Kok K, Zhou W., Bhagwat S., Willis K., Petrokofsky G. 2015. How effective are on-farm conservation land management strategies for preserving ecosystem services in developing countries? A systematic map protocol. Environmental Evidence 4:. DOI 10.1186/s13750-015-0036-5 Tobón C. 2009. Los bosques andinos y el agua, ECOBONA-INTERCOOPERATION, CONDESAN, Serie investigación y sistematización #4, Quito, 122 p. Townsend-Small A., McClain M.E., Hall B., Llerena C.A., Noguera J.L. y Brandes J.A. 2008. Contributions of suspended organic matter from mountain headwaters to the Amazon River: A one-year time series study in the central Peruvian Andes. Geochimica et Cosmochimica Acta 72: 732-740. Tume P., Cárdenas M., Calderón W. 1989. Efecto de la napa freática en el crecimiento y enraizamiento de Prosopis pallida en Piua. Revista Forestal del Perú 16 (19: 65-71. UNESCO. 1993. Hydrology and Water Management in the Humid Tropics, Edits.: M. Bonell, M. Hufschmidt y J.S. Gladwell, Cambridge University Press, 590 pp. Velásquez D.F. 2002. Estudio de la dinámica fluvial del río Ucayali y su influencia en la sucesión forestal en el área de Pucallpa, Tesis M.Sc., EPG-UNALM, 138 pp. Victoria R.L., Martinelly L.A., Mortatti J., Richey J. 1991. Mechanisms of Water Recycling in the Amazon Basin: Isotopic Insights. Ambio 20 (8): 384-387. Werth D., Avissar R. 2002. The local and global effects of Amazon deforestation. Journal of Geophysical Research 107D20, 8087, LBA 55, doi:10.1029/2001JD000717 Zanabria P., Llerena C.A. 2003. Los bosques nublados de la Amazonia andina y su influencia en la precipitación neta: quebrada Torohuaca, San Ignacio, Cajamarca, Perú. Revista Forestal del Perú 26 (1-2): 37-49. Zarin D., Alavalapati J.R.R., Putz F.E., Schmink M. (Edits.). 2004. Working Forests in the Neotropics. Conservation through sustainable management. Columbia University Press, NY, 437 p. Zemp D.C., Schleussner C.F., Barbosa H.M.J., van der Ent R.J., Donges J.F., Heink J., Sampaio G., Rammig A. 2014. On the importance of cascading moisture recycling in South America. Atmospheric Chemistry and Physics 14: 13337–13359.
148
Chapter 10. Forest Management and Water in Romania Niță Mihai Daniel1 (
[email protected]) and Clinciu Ioan291 (
[email protected])
10.1 Introduction Romania’s relief is split threefold: 31% mountainous, 36% hills/plateaus, and 33% plains. The Carpathian ring is part of the Alpine chain, connected to the Alps in the west and the Balkans in the south. Beyond this are the Transylvanian Depression, which fills the Carpathian ring, hills, plains, and the Dobrogea Plateau, plus the plains of the Lower Danube and Banat-Crisana. Romania’s climate is mild, temperate-continental with four distinct seasons, most precipitation in the warm season and some Mediterranean influence to the south. Mean annual precipitation is 400-800 mm in the main agricultural area and over 1,200 mm in the Carpathians. Severe drought occurs every 15-25 years, especially in the plains. Total forest area in Romania consists of 6,339,000 hectares, from which 6,245,000 hectares are covered with forest vegetation (27% of total land area of the country). Forest composition is varied; conifers represent 31% of the total forested area (23% spruce, 5% fir-tree, and other conifers 3%), beech 31%, oaks l8%, other hard broad-leaves 15% and soft broad-leaves 5% (Giurgiu, 2010). In terms of tree cover, the area is larger (approximately 8 million hectares), being the difference given mostly by reforestation of abandoned agricultural land. The Romanian forests have a very interesting history due to the influences of different policies from the neighboring empires (Austrian-Hungarian, Ottoman, and Russian). This history revealed drastically changes in landscapes, especially in the portion of forests lost for agricultural land (Figure 1). Cutting age research results showed that “Over the last century humans have altered the export of fluvial materials leading to significant changes in morphology, chemistry, and biology of the coastal ocean. Here we present sedimentary, paleoenvironmental and paleogenetic evidence to show that the Black Sea, a nearly enclosed marine basin, was affected by land use long before the changes of the Industrial Era. Although watershed hydroclimate was spatially and temporally variable over the last ~3000 years, surface salinity dropped systematically in the Black Sea. Sediment loads delivered by Danube River, the main tributary of the Black Sea, significantly increased as land use intensified in the last two millennia, which led to a rapid expansion of its delta. Lastly, proliferation of diatoms and dinoflagellates over the last five to six centuries, when intensive deforestation occurred in Eastern Europe, points to an anthropogenic pulse of river-borne nutrients that radically transformed the food web structure in the Black Sea” (Giosan et al., 2012). Between 1864 and First World War, the increasing agricultural business in Romania put pressure on forests, causing losses up to 25% of forest cover. Due to this drastic change of land use, the period between the two world wars is dominated by the “Land Reclamation Law” (1930), which governed the legal framework for inventory of degraded lands, establishing the perimeters for afforestation of degraded lands and torrents. Based on this law, Romania’s politics intend to increase forest cover, but due to the lack of finance and focus, and constant pressure from societal needs, the approximate increase of forest cover with planted forests was 100,000 hectares, meaning a 2% increase (Figure 2).
29 Transilvania University of Brașov, Department of Forest Engineering
149
between twoand world is dominated by the "Land Reclamation Law" (1930), which governed Betweenthe 1864 Firstwars World War, the increasing agricultural business in Romania put pressure on the legal causing framework forup inventory of forest degraded lands, thechange perimeters foruse, afforestation forests, losses to 25% of cover. Dueestablishing to this drastic of land the period of degraded and torrents. on this by law, politics intend increase forest cover, but between lands the two world wars Based is dominated theRomania’s "Land Reclamation Law"to (1930), which governed due the framework lack of finance and focus, constant pressure from societal needs, the theto legal for inventory ofand degraded lands, establishing the perimeters for approximate afforestation of increase of forest cover with planted forests was 100,000 hectares, meaning a 2% increase 2). degraded lands and torrents. Based on this law, Romania’s politics intend to increase forest (Figure cover, but Forest management and the impact on water resources: a review of 13 countries due to the lack of finance and focus, and constant pressure from societal needs, the approximate increase of forest cover with planted forests was 100,000 hectares, meaning a 2% increase (Figure 2).
Figure 1. Forest coverevolution evolution in in Romania Romania (Giosan et et al.,al., 2012) Figure 1. Forest cover (Giosan 2012) Figure 1. Forest cover evolution in Romania (Giosan et al., 2012)
Figure 2. Forest cover distribution in Romania’s major basins.
Figure 2. Forest cover distribution in Romania’s major basins.
In terms of priority functions performed by forests, according to forest management plans drawn up in In terms of priority functions performed by forests, according to forest management plans drawn up in recent years, forests coverage with special protection functions (functional group I) is 53.1%. The recent years, forests coverage with special protection functions (functional group I) is 53.1%. The forests category are assigned withby an important role in stopping and, especially,plans preventing In termsinin ofthis priority functions performed according to forestand, management drawn up forests this category are assigned with anforests, important role in stopping especially, preventing in recent years, forests coverage with special protection functions (functional group I) is 53.1%. The forests in this category are assigned with an important role in stopping and, especially, preventing degradation phenomena and the occurrence of 171 torrential floods. Managed as living shields against soil degradation and pollution of water sources, 171 24.1% of the forests are primarily managed for soil protection, and 14.5% are designed with water protection functions (Table 1).
150
Chapter 10. Forest Management and Water in Romania Table 1. Forest protection functions on basins and utilizable water resources
degradation phenomena and the occurrence of torrential floods. Managed as living shields against Usable Watersoil Protection Forests (%) degradation and pollution of water sources, 24.1% of the forests are primarily managedResources for soil Basin Name protection, and 14.5% are designed with water protection functions (Table 1). Water protection Soil protection Other protection Total (BCM/year) Tisa
9.4
22.6
10.6
42.6
Table7.4 1. Forest protection13.5 functions on basins and resources 14.3utilizable water35.2
Someş Crişuri Basin Name Mureş
11.5 Water 8.2 protection 9.7 9.4 7.5 7.4
Timiş Tisa Nera - Cerna Someș JiuCrișuri Mureș Olt Timiș Vedea Nera - Cerna Argeş Jiu Olt Ialomiţa Vedea Siret Argeș Prut Ialomișa Dunăre Siret Prut Litoral Dunșre Total Litoral Total
Protection Forests (%) 8.1 13.8 Soil 21.3 protection 19.4 22.6 32.8 13.5
33.4
16.9 Other protection
46.4 Total
16.7 10.6 29.6 14.3
45.8 42.6 69.9 35.2
8.19.4
6.24 Usable Water 2.87 Resources 5.77 (BCM/year)
3.56 6.24
11.5 9.5 8.2 26.9 9.7 2.5 7.5
13.8 34.8 21.3 22.8 19.4 52.4 32.8
16.9 10.6 16.7 15.3 29.6
33.4 53.7 46.4 60.3 45.8 70.2 69.9
2.87 3.47 5.77 5.3
19 9.5
44.2 34.8
9.421.1
84.3 53.7
26.9 18.9 2.5 13.9 19 5.3 18.9 34.8 13.9 5.3 0 34.8 14.5 0
22.8 28.4 52.4 23.6 44.2 11.5 28.4 30.2 23.6
10.6 32.6 15.3 11.4 21.1 8 32.6 25.7 11.4
60.3 79.9 70.2 48.9 84.3 24.8 79.9 90.7 48.9
11.5 19.6 30.2 24.1 19.6
8 20 25.7 14.5 20
24.8 39.6 90.7 53.1 39.6
1.76 0.11 40.41 0.11
14.5
24.1
14.5
53.1
40.41
3.56 2.39 3.47 5.3 1.39
7.54 2.39 1.76 1.39 7.54 -
The main forest products in Romania are represented by roundwood (Figure 3), which increased up
The main forest products in in Romania are represented by roundwood which increased to to 18 million cubic meters 2013. This increasing wood production(Figure yielded3), a higher demand inupthe 18 millionputting cubic meters in on 2013. This increasing wood production yielded a higher demand in the market, pressure forest resources. market, putting pressure on forest resources. 20
Million m³
15
Wood production
Roundwood production Sawnwood production
10 5 0 2000 2001 2002 2003 2004 2005 2006 2007 2008 2009 2010 2011 2012 2013
Figure 3. Wood production (Source: Eurostat)
Romania’s surface water endowment consists of internal river basins as well as the Danube, which is a trans-boundary river basin shared by 19 countries. The natural surfaceaswater of Romania’s surface water endowment consists of internal river basins well potential as the Danube, Romania is 127 Billion Cubic Meters (BCM)/year, with the internal river basins contributing 40 which is a trans-boundary river basin shared by 19 countries. The natural surface water potential of Romania is 127 Billion Cubic Meters (BCM)/year, with the internal river basins contributing 40 BCM and the Danube contributing 87 BCM per year. The groundwater endowment is estimated to be 10 BCM/year172 (Stanciu et al., 2011). 151
Forest management and the impact on water resources: a review of 13 countries
Water resources • Reservoirs: 1,449 from which 400 are very important • Accumulated volume: 13,070 million cubic meters
Main water uses • 3,110 drinking water intakes with an installed flow of 171 cubic meters/second, from which 67 cubic meters/second are ground sources intakes. • 3,838 industrial water intakes with an installed flow of 1082 cubic meters/second, from which 49 cubic meters/second are intakes from ground sources. • 363 hydroelectric power stations in function, with 692 power groups.
With a current population of 20.2 million, the average water availability in Romania is about 2,000 cubic meters per capita per year. While this value is above the thresholds generally defined for water stress (1,700 cubic meter per capita per year) (Falkenmark, 1989), it is lower than the average value for Europe (4,500 cubic meters per capita per year), and underscores the need for good management to ensure resource conservation and sustainability. Water demands have steadily decreased in Romania since the 1990s, mainly due to structural changes in the economy: • Economically unviable irrigation schemes have closed. • Industrial production has reduced, and the remaining industries have significantly reduced water consumption in production processes. • Utilities have reduced losses and introduced tariffs, which have helped reducing water consumption in the domestic sector, even though the provision of water supply and sanitation services has expanded to an increasing fraction of the population.
Water resource key issues directly related to the forest changes • Flash Floods: The high-intensity and short-duration floods (flash floods) are also becoming increasingly common in the mountain areas, mainly due to increasing frequency of highintensity precipitation events, but also exacerbated by land use changes, especially forest loss and gain on high slopes. Even though the National Meteorological Administration and Institute of Hydrology developed new waring systems for floods, the warning time for small mountainous catchments, which are prone to flash floods, is about 2 hours, leaving the communities in these areas highly vulnerable to risk. • Drought: Due to increasing temperature and decreasing river flows (see the following section on climate change) the frequency of droughts is increasing in Romania. • Climate change: regional and local studies revealed that the climate in the country is shifting. It is uncertain whether the climate heads to a warming or cooling, but what is observable is the fact that the amplitude of the floods and droughts is increasing.
152
10.2 Literature review
Chapter 10. Forest Management and Water in Romania
10.2 Literature review
Research in forest hydrology started in 1969, when several representative basins have been equipped Research in forest hydrology started in 1969, when several representative basins have been equipped with a minimum of facilities specific to the study: pairs of rain gauges or pluviographs, in the open with a minimum of facilities specific to the study: pairs of rain gauges or pluviographs, in the open and under the canopy of trees, to study canopy retention as part of the fallen precipitation, devices for and under the canopy of trees, to study canopy retention as part of the fallen precipitation, devices determining sap tree flows and evaporation. The main goal of this research was to determine the for determining sap tree flows and evaporation. The main goal of this research was to determine factors and how they influence the water balance in forested basinsbasins (see Figure 5 ahead). the factors and much how much they influence the water balance in forested (see Figure 5 ahead). Usingthese thesebasins, basins,the theresearchers researchers from NationalInstitute InstituteofofHidrology Hidrology and and Watershed WatershedManagement Management Using from National determinedflow flowcoefficients coefficients values valuesin inmany manyriver river basins, basins,with with varying varying degrees degreesof ofafforestation. afforestation.Fund Fund determined data accumulated through time created the possibility of determining the maximum flow of data accumulated through time created the possibility of determining the maximum flow of such such probability rates, rates,which whichled ledto to development a relationship between specific discharge probability thethe development of aofrelationship between specific discharge and and watershedarea area(Giurgiu (Giurgiuand andClinciu, Clinciu,2008). 2008).Figure Figure 55 shows shows this this type type of of relationship watershed relationship for forthe theMoldavian Central Plateau river; they were based on small areas, especially in peak flow values 1% exceedance Moldavian Central Plateau river; they were based on small areas, especially in peak flow values 1% probability, determined within the representative basin Tinoasa-Ciurea (no. 13 in Figure 4). exceedance probability, determined within the representative basin Tinoasa-Ciurea (no. 13 in Figure 4).
Figure 4.4.Geographic of representative representative basins Figure Geographic distribution distribution of basins
Due to the forest hydrology research in Romania is emphasized that maximum flow calculation at Due to the1% forest hydrology research is aemphasized that maximum flow calculation probability in small watershedd can in beRomania done using flow coefficient. The coefficient is based onat probability 1% in small watershedd can be done using flow coefficient. Theofcoefficient is based data from representative basins, values depending on theavariation coefficient afforestation: 0% toon data from representative basins, values depending on the variation coefficient of afforestation: 100%, in accordance with the amount of rainfall corresponding to various parts of the country, for 0% this to 100%, in accordance with the amount of rainfall corresponding to various parts of the country, for this probability. These values were included in a summary table (Table 2), which is particularly useful in the practice of hydrology. 174
153
probability. These values were included in a summary table (Table 2), which is particularly useful in
Forest management and the impact on water resources: a review of 13 countries the practice of hydrology.
Figure 5. Relation between specific maximum flow and the basin area Table 2. Flow coefficient based on Forest Coeficient (Cp) and Watershed slope (Ib) taking (1% intoprobability) consideration forest percentage. Cp(%)
Ib(%)
0-20
20-40
40-60
60-80
80-100
10-May
0,55
0,53
0,51
0,49
0,47
20-Oct (1% probability) 0,57 0,55 0,53 0,51 Table 2. Flow coefficient based on Forest Coeficient (Cp)0,49 and Watershed slope (Ib)
20-30
0,59
0,57
0,55
0,53
0,51
30-40
0,62
0,60
0,58
0,55
0,53
0,62
0,60
0,57
40-50
0,64
Cp(%)
0,55
Ib(%)
0-20
20-40
40-60
60-80
80-100
30-40
0,62
0,60
0,58
0,55
0,53
40-50
0,64
0,62
0,60
0,57
0,55
An important work for increasing water yield and improving water quality was the implication of forestry specialists in managing torrential valleys, where massive deforestation was produced in the 10-May 0,55 0,53 0,49the benefits of 0,47 past. At the beginning of the XIX century, more and more 0,51 scientists demonstrated forests for water and for flood regulation. Starting with that period, the Romanian forest engineers 0,57 0,55 20-Oct 0,53 0,51 degraded lands 0,49 begun their campaign in developing and putting into practice mapping and restoring and managing torrential valleys (Giurgiu and Clinciu, 2008). The benefits of that period can be seen 20-30 0,59 0,57 Valley (Ialomita 0,55 nowadays in several watersheds like Bogdan Basin) or Sșrii 0,53 Valley (Siret Basin)0,51 (Figure 6).
175
a)
b)
c)
d)
Figure 6. Increasing water yield and quality by reforestation and watershed management Sării Valley – a) In 1954 (Photo:Costin); b) In 1997 (Photo:Untaru) and Bogdan Valley – c) Map of Romania 1864; d) GeoEye image 2014
10.3 Politics 154
In Romania, environmental laws are established through Acts of Parliament. These Acts provide the general framework for:
Chapter 10. Forest Management and Water in Romania
An important work for increasing water yield and improving water quality was the implication of forestry specialists in managing torrential valleys, where massive deforestation was produced in the past. At the beginning of the XIX century, more and more scientists demonstrated the benefits of forests for water and for flood regulation. Starting with that period, the Romanian forest engineers begun their campaign in developing and putting into practice mapping and restoring degraded lands and managing torrential valleys (Giurgiu and Clinciu, 2008). The benefits of that period can be seen nowadays in several watersheds like Bogdan Valley (Ialomita Basin) or Sării Valley (Siret Basin) (Figure 6).
10.3 Politics In Romania, environmental laws are established through Acts of Parliament. These Acts provide the general framework for: • Regulation of economical and social activities having an environmental impact; • Protection of natural resources and conservation of biodiversity; • Pollution control.
But from legal frames to facts there is a very long way with a lot of issues such as illegal extraction of sediments from riverbed, river contamination with garbage or industrial waste, intensive harvesting near water storages, extracting logs using the watershed valley network, and intensivebelongs grazing.to The large responsibility for preparing more detailed requirements, regulations, and standards
the Ministry of Waters, Forests, and Environmental Protection. The environmental legislative system
Another legal frametofor through forests is FSC standard implementation. has beenimportant revised according theprotecting Europeanwaters legal system. It provides laws for different parts of the Logging directly disturbs forests and waters, but the FSC standard requires operators to minimize environment: air, water, and soil. It also provides laws related to these environments: dangerous forest damagethe during and road construction, well asactivity. to protect forest ecosystems substances, fight harvesting against floods, forestry, food, andasnuclear (Macicuca and Diaconescu, 2013). Romania has good implementation of FSC standards and approximately 50% of Romanian forests are certified (Figure 7).
Figure 7. FSC Certified Forests in Romania (source: http://www.certificareforestiera.ro) . Figure 7. FSC Certified Forests in Romania (source: http://www.certificareforestiera.ro)
10.4 Climate change and the future of forestry & forest research There are quantitative estimates for Romania related to climate change, which come from two 155 categories of sources (World Bank, 1999): (1) Climate change studies of Europe and (2) local studies aimed at assessing climate change impacts for specific selected river basins of Romania. The results
Forest management and the impact on water resources: a review of 13 countries
Today the Romanian environmental legislation is based on two fundamental laws that guide the whole environmental protection at the national level: the Environmental Protection Law (EPL) and the Water Law (WL). Both laws provide an excelent legislative frame for applying strong strategies to improve water yield and water quality. According to WL, all rivers have a buffer zone between 20 and 100 m, for protection. The protection of waters can be found in EPL and the same in the Forest Law, which defines a category of forests that should remain in basins stabilizing soil erosion and maintaining a constant water flow. But from legal frames to facts there is a very long way with a lot of issues such as illegal extraction of sediments from riverbed, river contamination with garbage or industrial waste, intensive harvesting near large water storages, extracting logs using the watershed valley network, and intensive grazing. Another important legal frame for protecting waters through forests is FSC standard implementation. Logging directly disturbs forests and waters, but the FSC standard requires operators to minimize forest damage during harvesting and road construction, as well as to protect forest ecosystems (Macicuca and Diaconescu, 2013). Romania has good implementation of FSC standards and approximately 50% of Romanian forests are certified (Figure 7).
10.4 Climate change and the future of forestry & forest research There are quantitative estimates for Romania related to climate change, which come from two categories of sources (World Bank, 1999): (1) Climate change studies of Europe and (2) local studies aimed at assessing climate change impacts for specific selected river basins of Romania. The results of the continental-scale studies include relevant findings for Romania. Observed changes in climate over Europe in the 20th century show that Southern and South-Eastern Europe has experienced decreases in annual precipitation of up to 20%. Precipitation has decreased at a rate of about 30 mm per decade in Romania, between 1961 and 2006. Annual mean precipitation is projected to decrease by 5-20% in southern Europe and the Mediterranean in the period 2071-2100, compared to the period 1961-1990 (Figure 8).
Figure 8. Trends in annual precipitation across Europe between Jan 1960 and Jan 2012 (source: http://www.eea.europa.eu/data-and-maps/figures/observed-changes-in-annualprecipitation-1961-2006) 156
Chapter 10. Forest Management and Water in Romania
In line with the precipitation changes, annual river flows are increasing in the north and decreasing in the south, and this trend is projected to continue in the future. Large changes in seasonality are also projected, with lower flows in summer and higher flows in winter for Romania. As a consequence, droughts and water stress are expected to increase, particularly in summer. Flood events are projected to occur more frequently in many river basins, particularly in winter and spring, although estimates of changes in flood frequency and magnitude remain uncertain. In general, the range of climate change impacts across Romania includes a likely increase in cold spells, heat waves, heavy floods, landslides, formation of ice-dams on watercourses, damaging frost, and avalanches (World Bank, 1999). In terms of climate change, the area occupied by forest plantations is slowly increasing, especially in the southern part of Romania. These are the efforts of community to stop the increase of desertification phenomena. The process is still slow due to the lack of funds and bureaucracy. Future research and management practices should be incorporated in the management of forest to improve water quality and water yield, through increasing forest cover, especially in Southern and Eastern counties. Research should concentrate on the needs of forest managers, which converge into one point: increasing the forest cover by maintaining the harmony between economic needs and ecological demands.
10.5 References Falkenmark, 1989. The massive water scarcity threatening Africa-why isn’t it being addressed. Ambio 18, 112-118. Giosan, L., Coolen, M.J.L., Kaplan, J.O., Constantinescu, S., Filip, F., Filipova-Marinova, M., Kettner, A.J., Thom, N., 2012. Early anthropogenic transformation of the Danube-Black Sea system. Sci. Rep. 2, 582. doi:10.1038/ srep00582 Giurgiu, V., 2010. Consideraţii asupra stării pădurilor României - partea I : Declinul suprafeţei pădurilor şi marginalizarea împăduririlor. Rev. pădurilor. Giurgiu, V., Clinciu, I., 2008. Silvologie VI. Romanian Academy Publishing House. Macicuca, A., Diaconescu, C., 2013. Forest Certification Effects on Sustainable Management of Romanian Forest Ecosystems. Present Environ. Sustain. Dev. 7. Stanciu, P., Oprisan, E., Tecuci, I., 2011. National Water Resources and their Evolution in the Context of Climate Change. National Institute of Hydrology and Water Management. World Bank, 1999. Integrated Water Resources Integrated Water Resources.
157
Chapter 11. Forest management and water in the Republic of South Africa David F Scott30 (
[email protected]) and Mark B Gush31 (
[email protected])
11.1 Introduction South Africa is a semi-arid country with a very limited area of natural forest. The early colonial governments encouraged the establishment of plantations to supply wood for local uses, and South Africa consequently has a long history of plantation forestry. However, the growth of the man-made forests soon led to conflicts with downstream water users, mainly farmers. The simmering debate about the positive and negative effects of plantations of introduced tree species became a highlevel political issue, and this led to the establishment of a large and intensive forest hydrological research program in 1936. The results of the research program were incorporated, between 1970 and 1995 into management policies for these plantations and the humid mountainous catchment areas (watersheds). One policy element was that the extent of the plantations was regulated, based on the estimated effects of the plantations on regional water resources. More recently, a new National Water Act (1998) has further restricted the forest industry, with the result that there has been a stagnation of timber planting over the last twenty years. This chapter outlines the history of the forest industry and associated forest hydrology research in South Africa, and describes the measures that have been taken to control the forest industry because of its effects on water resources.
Water resources in South Africa. South Africa is essentially a semi-arid country, with a mean annual precipitation (MAP) of roughly 460 mm (DWAF 2004), which is greatly exceeded by evaporative demand that ranges between 1400 and 3000 mm/year (Schulze, 2008). The distribution of precipitation though is highly variable, both in space and time, and there are small areas of the country with high rainfall (roughly 20% of the country has an MAP > 800 mm (Dye and Versfeld, 2007), which are largely responsible for sustaining much of the perennial streamflow. The high rainfall zones, known locally as mountain catchment areas, are responsible for 60% of the countries surface water production (Jacobson 2003). Groundwater resources are limited, so the country is dependent on surface water resources. Within South Africa and the neighbouring mountain country of Lesotho, a large capacity to store water has been built to retain water for drier years, and there is a large reliance on inter-basin transfers of water. South Africa has a reservoir storage capacity of 32,412 million m3, which is the equivalent of 66% of the Mean Annual Runoff (MAR) (DWAF 2004). Most water is used by agriculture, with irrigation accounting for 62% of utilizable water. The next biggest user is municipal water use (27%), for residential (urban and rural), commercial and light industrial purposes. Other uses are mining, bulk industrial and power generation, which jointly account for another 8% of utilizable water (DWAF 2004).
30 University of British Columbia, Kelowna, BC, Canada 31 CSIR, Natural Resources and Environment, Stellenbosch, South Africa
159
Forest management and the impact on water resources: a review of 13 countries
Forest Resources
Forest Resources The humid parts of South Africa are scattered along the south and eastern seaboard and along the seaward that runsare upscattered the eastern part the country. Within these regions The humidescarpment parts of South Africa along theofsouth and eastern seaboard andwell-watered along the seaward there is a very small area of native forest, covering approximately 0.4% of the total land area (Figure escarpment that runs up the eastern part of the country. Within these well-watered regions there is a very 1). This and scattered forest area produces a very amount of high quality furniture small arearestricted of native forest, covering approximately 0.4% of the totalsmall land area (Figure 1). This restricted but the trees are slow-growing, the forests are difficult to regenerate, and the majority wood, and scattered forest area produces a very small amount of high quality furniture wood, but the trees areof the forest area is managed rather than are valued slow-growing, the forests for are conservation difficult to regenerate, andproduction. the majority The of thenative forestforests area is managed formostly for their aesthetic and production. ecological values, andforests they are a significant the economy. conservation rather than The native are not valued mostly for part theirof aesthetic and ecological values, and they are not a significant part of the economy.
Figure 1. The distribution of native (indigenous) and timber Figure 1. The distribution of native (indigenous) forest and timberforest plantations in theplantations Republic of South Africa (GEOTERRAIMAGE, 2014).in the Republic of South Africa (GEOTERRAIMAGE, 2014).
Against this background of timber scarcity, the early governments in South Africa encouraged the planting Against this tree background timberfrom scarcity, theasearly governments South Africa encouraged of introduced species foroftimber, as early the late 19th Centuryin(van derthZel, 1995; Kruger andthe planting of introduced tree species for timber, from as early as the late 19 Century (van der Zel, Bennett, 2013). The earliest plantations were of eucalypts to supply fuelwood for trains and timber for 1995; Kruger and Bennett, Thewas earliest were of eucalypts toA.supply fuelwood railroad ties (sleepers). Another2013). early crop wattle,plantations Australian Acacia species (mainly mearnsii), for trains and timber for railroad ties (sleepers). Another early crop was wattle, Australian planted for the production of tannin from its bark. Mining became a major economic activity by the Acacia th mearnsii), planted for the production of tannin from its bark. Mining became a species (mainly beginning of the 20A. Century, and mining companies started planting introduced trees (mainly fast-growing major economic activity beginning of the 20th Century, andGradually, mining companies started planting eucalypts) to supply wood by forthe mine props in the underground mines. a saw-timber industry was introduced trees (mainly fast-growing eucalypts) to supply wood for mine props in the underground developed based on plantations of pines that were thinned and pruned to produce a high quality timber. mines. Gradually, a saw-timber industry was developed based on plantations of pines that were thinned and pruned to produce a high quality timber. Today, the country has a vibrant commercial plantation industry, based on approximately 1.27 million ha of plantations (Figure 2). These plantations are based on a limited number of pine, eucalypt and 181 acacia species, but all are fast-growing, allowing for profitable production of forest products. Most of the saw timber comes from pine plantations which comprise 51% of the plantation area (mainly Pinus patula, followed by P. elliottii, P. radiata and P. taeda). A variety of eucalypt clones, mostly based on Eucalyptus grandis, are grown on short rotations (8-12 years), mostly for pulping and chipping (chips being exported to markets in the Far East are included in the pulpwood category in 160
plantations (Figure 2). These plantations are based on a limited number of pine, eucalypt and acacia species, Today, the country has a vibrant commercial plantation industry, based on approximately 1.27 million ha of but all are fast-growing, for profitable production of forest products. Most of and the saw timber comes plantations (Figure 2).allowing These plantations are based on a limited number of pine, eucalypt acacia species, frombut pine which comprise of theproduction plantationofarea Pinus followed P. all plantations are fast-growing, allowing for 51% profitable forest(mainly products. Mostpatula, of the saw timberby comes elliottii, radiata and P. taeda). A variety clones, Eucalyptus grandis, fromP. pine plantations which comprise 51%of of eucalypt the plantation areamostly (mainlybased Pinuson patula, followed by P. are Chapter 11. Forest management and water in the Republic of South Africa grown on short rotations (8-12 years), mostly for pulping and chipping (chips being exported to in elliottii, P. radiata and P. taeda). A variety of eucalypt clones, mostly based on Eucalyptus grandis,markets are Figure 3). These short-rotation eucalypts are also sawn for mining timber, though this market now the Far East included in(8-12 the pulpwood category in Figure These(chips short-rotation eucalypts are also grown onare short rotations years), mostly for pulping and 3). chipping being exported to markets in makes up only 4% of production. Far East are included in thethis pulpwood in Figure 3). These sawnthefor mining timber, though marketcategory now makes up only 4% ofshort-rotation production. eucalypts are also sawn for mining timber, though this market now makes up only 4% of production.
Figure 2. The area of South African plantations by tree type (FSA, 2014)
Figure 2. The of South African plantations by tree (FSA, Figure 2. The areaarea of South African plantations by tree type type (FSA, 2014)2014)
Figure 3. The main product categories of the South African forest industry (FSA, 2014).
Figure 3. The main product categories of the South African forest industry (FSA, 2014).
Figure 3. The main product categories of the South African forest industry (FSA, 2014)
182
The economic importance of the forest industry The national forest inventory estimates that182 the annual sustainable production of timber from the plantations is 20 million tons, at an average growth rate of 15.8 ton/ha for the whole industry (DAFF 2014). Exports of forest products in 2013 amounted to US$1.7bn, which resulted in a positive trade balance with respect to wood products of $380m (DAFF 2014). Perhaps most significantly in South Africa, the industry as a whole (including processing) employs 170,000 people of which 66,000 are involved in forestry operations (DAFF 2014). The forest industry based on plantations of introduced timber species is therefore an important part of the South African economy, and projections indicate 161
The economic importance of the forest industry The national forest inventory estimates that the annual sustainable production of timber from the plantations is 20Forest million tons, at an and average growth ofresources: 15.8 ton/ha for theofwhole industry (DAFF 2014). Exports of management the impact onrate water a review 13 countries forest products in 2013 amounted to US$1.7bn, which resulted in a positive trade balance with respect to that it needs to grow in order to keep pace with future increases in demand for wood and fibre wood products of $380m (DAFF 2014). Perhaps most significantly in South Africa, the industry as a whole products. (including processing) employs 170,000 people of which 66,000 are involved in forestry operations (DAFF 2014). The forest industry based on plantations of introduced timber species is therefore an important part of the South African economy, and projections indicate that it needs to grow in order to keep pace with future increases demand for wood and fibre products. 11.2inLiterature review 11.2 The Literature review commercial timber plantations are generally confined to areas where MAP exceeds 750 mm (van der Zel, 1995), and growth rates are generally positively related to rainfall. Although the current The commercial timber plantations are generally confined to areasofwhere MAP exceeds 750inmm der area of commercial timber plantations occupies only 1.04% the land area, they are the(van wetter Zel, parts 1995),ofand growth rates are generally positively related to rainfall. Although the current area of the country, and this lead to conflicts over their effects on water resources. As early as commercial timber plantations occupies only 1.04% of view the land they are would in the wetter of the 1915 farmers were contesting the generally held thatarea, forest cover benefitparts the regional country, and thisand leadwere to conflicts over their on water resources. As early 1915 farmers wereby hydrology, complaining that effects their water supplies seemed to beasnegatively affected contesting the generally held view that forest cover would benefit the regional hydrology, and were upstream plantations (van der Zel, 1995). Forestry officials supported the spread of plantations for complaining that their water supplies seemed to be negatively affected by upstream plantations (van der Zel, reasons of timber supply, control erosion for hydrological benefits, believing treesof would 1995). Forestry officials supported theofspread of and plantations for reasons of timber supply,that control erosion regulate flows and humidify their environment (Kruger & Bennett, and for hydrological benefits, believing that trees would regulate flows2013). and humidify their environment (Kruger & Bennett, 2013).
Figure 4. Plantation forests and water: A stream adjacent to a commercial pine plantation in the Magoebaskloof area, South Africa. (photo: M. Gush) Figure 4. Plantation forests and water: A stream adjacent to a commercial pine
plantation in the Magoebaskloof area, South Africa. (photo: M. Gush)
In 1935 the Empire Forestry Conference was held in South Africa. It brought the senior forest scientists from the British Empire together for an extended conference and tour of forestry sites in the country. At the time,InSouth had more plantations than anywas other country in theAfrica. BritishIt Empire. ministers 1935Africa the Empire Forestry Conference held in South broughtGovernment the senior forest challenged the gathered foresters to advise them on the debate regarding the hydrological effects of scientists from the British Empire together for an extended conference and tour of forestry sites in the country. At the time, South Africa had more plantations than any other country in the British Empire. Government ministers challenged the gathered 183foresters to advise them on the debate regarding the hydrological effects of plantations. As the then Minister for Agriculture and Forestry, Denys Reitz, said at the conference; “For more than a century we in South Africa have been planting trees, chiefly pines and eucalypts, under the impression that such plantations were valuable for the conservation of water. It has now been put to me that in this way we are decreasing the humidity and drying the soil.” (Bennett & Kruger, 2013). The conference recommended a serious scientific study to establish evidence of the hydrological influence of trees. In 1936, the Jonkershoek Forestry Research Station was established, under the direction of Dr CL Wicht, a forester with training from Germany and Oxford (Kruger & Bennett 2013). Additional gauged catchment studies that contrasted afforestation with introduced pines or eucalypts with a well-managed native vegetation, were added after the Second World War, at Cathedral Peak, Mokobulaan and Westfalia. As a result of the high political profile of the debate around plantations, there was strong government support for the research
162
more than a century we in South Africa have been planting trees, chiefly pines and eucalypts, under the impression that such plantations were valuable for the conservation of water. It has now been put to me that in this way we are decreasing the humidity and drying the soil.” (Bennett & Kruger, 2013). The conference recommended a serious scientific study to establish evidence of the hydrological influence of trees. In 1936, the Jonkershoek Forestry Research Station was established, under the direction of Dr CL Wicht, a forester with training from Germany and Oxford (Kruger & Bennett 2013). Additional gauged catchment studies Chapter 11. Forest management and water in the Republic of South Africa that contrasted afforestation with introduced pines or eucalypts with a well-managed native vegetation, were programme, and was able to and stick to an As ambitious plan for addedwhich after themaintained Second World its War,funding at Cathedral Peak, Mokobulaan Westfalia. a result of research the high political profile of the debate around plantations, there was strong government support for the research close to five decades. programme, which maintained its funding and was able to stick to an ambitious research plan for close to five decades.
Figure 5. A mosaic of indigenous forest, commercial plantations and grassland in a landscape typical of South Africa forest
Figure A mosaic indigenous forest, commercial plantations and grassland in a landscape growing5. areas. (photo: M.of Gush) typical of South Africa forest growing areas. (photo: M. Gush)
The research programme involved planting gauged catchments to pine or eucalypts that were used in that region of the country, and applying standard silvicultural treatments for saw-timber crops, which included thinnings and pruning of the trees at prescribed intervals. Standard planting was at 3 m by 3 m spacing, The research programme involved gauged catchments to pine or eucalypts that were used giving an initial stocking of roughlyplanting 1360 stems per hectare (spha). Periodic thinnings would have brought in that region and standard crops, stockingof to the belowcountry, 400 spha in mostapplying experiments. Over time silvicultural the experimentstreatments were analysed for by a saw-timber series of
which included thinnings and pruning of the trees at prescribed intervals. Standard planting was at 3 m by 3 m spacing, giving an initial stocking184 of roughly 1360 stems per hectare (spha). Periodic thinnings would have brought stocking to below 400 spha in most experiments. Over time the experiments were analysed by a series of researchers, starting with Wicht (1967) who analyzed the first experiments with Pinus radiata planted into the sclerophyllous scrub (fynbos) in Jonkershoek. Nanni (1970) analyzed the experiments with P. patula plantings into montane grasslands at Cathedral Peak showing that the same trend found in the Mediterranean-type climate of Jonkershoek also occurred in the mountainous summer rainfall region. Van Lill et al. (1980) analyzed the early results of the first experiment with Eucalyptus grandis planted at Mokobulaan, showing a sharper and earlier reduction in flows than observed under pines. Bosch (1979) did more work on the catchments at Cathedral Peak, including the first analysis that showed that dry season flows were impacted to a greater relative extent than annual runoff. Van Wyk (1987) extended the analysis of the replicated experiments at Jonkershoek, confirming the general trend of streamflow reductions caused by the planting of pines. Smith & Bosch (1989) and Bosch & Smith (1989) analyzed the second experiment with eucalypts in sub-tropical Westfalia, showing that when the fast-growing eucalypts replaced mature native forest, there was a highly significant reduction in streamflows within three years of planting. Scott et al. (2000) provide a background and review of the main experiments in the gauged catchment network.
163
by the planting of pines. Smith & Bosch (1989) and Bosch & Smith (1989) analyzed the second experiment with eucalypts in sub-tropical Westfalia, showing that when the fast-growing eucalypts replaced mature native forest, there was a highly significant reduction in streamflows within three years of planting. Scott et al. (2000) provide a background and review of the main experiments in the gauged catchment network. Forest management and the impact on water resources: a review of 13 countries
of Wood SA and Timber Times Photo courtesyPhoto of courtesy Wood SA and Timber Times
Figure 6. View of typical & eucalypt plantation in South Africa Figure 6. View of typical pinepine & eucalypt plantation in South Africa (source: http://www.woodsa.co.za/2014/April/images/WaterUse3.jpg)
(source: http://www.woodsa.co.za/2014/April/images/WaterUse3.jpg)
It had long beenlong standard the riparian zones (a 20zones m wide streams) It had been practice standardfor practice for the riparian (a strip 20 meither wide side stripofeither sidewithin of timber plantations to be exclusion zones. This was done on the basis of early work that showed that streams) within timber plantations to be exclusion zones. This was done on the basis of earlyriparian vegetation hadthat a direct effect streamflow (Rycroft, Subsequently, several experiments have shown work showed thatonriparian vegetation had1955). a direct effect on streamflow (Rycroft, 1955). that the practice of keeping the riparian zones under a native vegetation cover is justified from a water Subsequently, several experiments have shown that the practice of keeping the riparian conservation (Prinsloo & Scott,cover 1999;isScott 1999;from Everson et al., 2007). Van perspective der Zel (1970) and zonesperspective under a native vegetation justified a water conservation Lesch and Scott (1997) looked at the influence of thinnings on2007). water yield. Although thinnings may remove (Prinsloo & Scott, 1999; Scott 1999; Everson et al., Van der Zel (1970) and Lesch as muchand as half the(1997) trees, the remaining plantationoftrees soon occupy whole site so thinnings that any savings Scott looked at the influence thinnings on waterthe yield. Although may in water areremove of shortasduration During 1990’s plantation a series of trees process studies were much as(