la position des partis à chaque point dans le temps durant la campagne. Cet article utilise .... the parties received.7 Much of the media coverage of the UBC-ESM ...
Markets as Predictors of Election Outcomes: Campaign Events and Judgement Bias in the 1993 UBC Election Stock Market
Markets as Predictors of Election Outcomes
329
ROBERT FORSYTHE Department of Economics University of Iowa, Iowa City, Iowa
MURRAY FRANK VASU KRISHNAMURTHY THOMAS W. ROSS Faculty of Commerce and Business Administration University of British Columbia, Vancouver, British Columbia
Les économistes croient que les marchés financiers intègrent l’information de façon efficace. La Bourse des Élections de 1993 de UBC a été conçue pour exploiter cette aptitude en vue de prévoir le résultat de l’élection fédérale tenue en 1993. La prédiction finale du marché concernant les parts des votes allant à chacun des partis était très près des véritables résultats. Le marché a également généré un ensemble de données sur la position des partis à chaque point dans le temps durant la campagne. Cet article utilise une partie de ces données pour étudier deux questions concernant le comportement des contrepartistes. Premièrement, selon les contrepartistes et le marché, quels ont été les événements importants lors de la campagne électorale de 1993? Deuxièmement, est-ce que les contrepartistes ont montré des biais de jugement dans leurs transactions? C’est-à-dire, est-ce qu’ils avaient tendance à détenir des actions dans les partis qu’ils voulaient voir avoir du succès? Economists believe that markets are efficient aggregators of information. The 1993 UBC Election Stock Market was designed to use this ability to predict the outcome of the 1993 Canadian federal election. The final market predictions of vote shares going to the various parties were very close to the actual results. The market also generated a large body of data on the standings of the parties at every point in time during the campaign. This paper makes use of some of these data to study two sets of questions about trader behaviour. First, according to the traders and the Market, what were the significant events of the 1993 election campaign? Second, did UBC-ESM traders exhibit judgement bias in their trading activity? That is, did they tend to hold shares in parties that they wanted to be successful?
C ANADIAN P UBLIC P OLICY – ANALYSE DE POLITIQUES,
VOL . XXIV, NO . 3 1998
330 R. Forsythe, M. Frank, V. Krishnamurthy and T.W. Ross INTRODUCTION
A
s soon as an election is over, analysts set to work trying to determine why it turned out the way it did. This information interests politicians planning for future campaigns and scholars seeking to understand the basic forces that determine election outcomes. Two major approaches have dominated these efforts. Traditionally, well-informed experts have expressed opinions based on their observation of events, and their understanding of the underlying forces at work in the society. In recent years opinion polls of samples of likely voters have played an important role as well.
The drawbacks to both of these methods are wellknown. The apparently well-informed observers do not always agree on which events were crucial, leading to uncertainty as to whose views ought to be taken more seriously.1 Two problems with opinion polls seem to stand out. First, the participants in a conventional opinion poll have little incentive to answer carefully or truthfully. Early in an election campaign, poll respondents may not have very carefully considered the alternatives presented by the various candidates and they may be poorly informed about the central issues. This makes their responses unreliable signals of their true “informed” preferences. As a result, early opinion polls are notoriously unreliable (see Gelman and King 1993). As well, because there is no strong incentive to respond carefully, some of those polled tend to answer in a manner that seems to be “approved” by the pollster, as has been documented, for example, by Traugott and Price (1992). Second, there is evidence of cognitive biases in the way people respond to questions. As shown for instance by Uhlaner and Grofman (1986), some answers seem to exhibit a degree of wish fulfilment, rather than a simple unbiased assessment of the likely results. Given these drawbacks, it is natural to look for other methods to supplement the standard approaches. The idea is that by adding to the set of available tools, cross validation of results from difCANADIAN P UBLIC P OLICY – ANALYSE DE POLITIQUES,
fering imperfect tools might help indicate which events were really crucial.2 We used the 1993 UBC Election Stock Market (UBC-ESM) to study the 1993 Canadian federal election. This was the first market of its kind in Canada. The 1993 UBC-ESM project created a set of markets in which traders, buying and selling contracts identified with political parties, provided predictions of the outcome of the 1993 Canadian federal election. The UBC-ESM attracted over 250 traders from all across Canada and the United States, and investments in excess of $30,000.3 In the UBC-ESM traders bought and sold contracts that were tied to the fortunes of the political parties in a very specific way. LIB contracts for example would be liquidated after the election at a value equal to $1 times the share of seats in the House of Commons won by Liberal candidates. If this market works efficiently, the current price of these contracts throughout the campaign should reflect the market’s expectation of the share of seats to be won; for example, if the current price on LIB contracts is 40¢, the market expects the Liberals to win 40 percent of the seats. This work is based on the “efficient markets” hypothesis of finance theory. According to this theory stock market prices are the best available estimates of the real value of the asset (see, e.g. Brealey et al. 1992, pp. 313-31). This is because traders, acting in their own best interests by making trades that they expect to be profitable, will use all available information and will continue trading and changing prices until they believe prices fully reflect the value of the asset in question. Then there are no more gains to be made buying or selling. As there is not (arguably) any important “inside” information in political stock markets, we maintain that the UBC-ESM was “semi-strong” efficient; that is, the share prices in the market fully reflected all public information. Election stock markets, a relatively new tool for studying elections, have been attracting increasing VOL. XXIV , NO. 3 1998
Markets as Predictors of Election Outcomes attention due to their predictive accuracy, notably in American presidential elections. Forsythe et al. (1991a; 1991b; 1992) documents how the Iowa election stock market predicted vote shares closer to the mark than the traditional opinion polls.4 Partly due to their documented success, the results of election stock markets are increasingly being reported and discussed in the media, for example in The Globe and Mail, The Wall Street Journal, and The Economist, among many others.5 As election stock markets are gradually being taken more seriously, it is important to understand both their strengths and their limitations as clearly as we understand the strengths and the limitations of the traditional approaches. In this paper we do two things. First, we provide an assessment of which events in the 1993 Canadian federal election campaign were apparently crucial, and which were not. The fact that the UBCESM provided a continuous reading on traders’ expectations regarding the election makes it straightforward to measure the effects of events on predicted outcomes. Our results indicate that certain campaign missteps by the Progressive Conservatives were particularly important to the final results. This appears to conform broadly to what other informed commentators have suggested.6 This paper also examines the extent to which the market participants exhibit the cognitive biases that have been found in studies of opinion poll respondents. Specifically, we study the relationship between traders’ portfolio holdings and their preferred outcomes as revealed in surveys conducted during the campaign. If traders are unbiased in their assessments, these should be unrelated. We find that — on average — our market participants, who are in no way a random selection from the voting population, exhibit the same sorts of cognitive biases that have been documented in opinion poll research. However, in this market, as in previous election stock markets, the observed prices did a good job of predicting the shares of votes received by the parties. In other words, the cognitive biases
331
of the average trader did not block the forecasting success of the market price, and this success of the UBC-ESM has not been due to pure luck in finding a group of unusually unbiased market participants or a “representative” group in which different biases cancel each other out. Clearly, this is also important if we are to expect future election stock markets to forecast well. However, this suggests a puzzle; how did accurate market results come from biased market participants? To account for this, it is important to distinguish the average trader from the marginal trader. Not all traders are equally biased. Those traders who exhibit less bias typically have a stronger role in determining market prices. This appears to be due to self-selection. These traders presumably spend more time and effort following the campaign, they are more active in trading, and hence they play a greater than average role in setting market prices. This makes the market prices more accurate than they would otherwise be if all traders had an equal role in price setting. As shown by Forsythe et al. (1992), this effect was also at work in the American presidential markets. The next two sections are a very brief review of the design and basic results of the UBC-ESM 1993 markets. The reader interested in further details should consult Forsythe, et al. (1995). While that paper and this one both report evidence generated from the same election stock market, the substantive questions are quite different. The main focus of the earlier paper was on the basic forecasting ability of the markets, on links across markets, and on certain economic aspects of the market. Here we study the cognitive biases of the traders, and the importance of various campaign events.
THE DESIGN OF THE UBC ELECTION STOCK MARKET The UBC-ESM consisted of three interrelated markets. In the first, the House of Commons Market,
C ANADIAN P UBLIC P OLICY – ANALYSE DE POLITIQUES,
VOL . XXIV, NO . 3 1998
332 R. Forsythe, M. Frank, V. Krishnamurthy and T.W. Ross the traded securities were tied to the fractions of seats won by the major parties. In the second market, the Majority Government Market, the securities were tied to whether the Liberals would win a majority of the seats, the Conservatives would win a majority, or some other result would occur. In the third market, the Popular Vote Market, the securities were tied to the share of the popular vote that the parties received.7 Much of the media coverage of the UBC-ESM focused on the House of Commons Market since it provided a readily observable forecast concerning which party would get political power, and the polls do not directly offer such predictions. We chose to operate three markets for a number of reasons. As reported by Forsythe et al. (1992), in American presidential elections this type of market predicted the popular vote remarkably well. Here we wanted to see if the market could do as well with the (arguably) more difficult task of predicting the shares of parliamentary seats. The House of Commons and Majority Government Markets together give us a lot of data about the distribution of traders’ beliefs about the make-up of the House after the election. The Popular Vote Market allows us to compare our market directly with its American counterpart and to compare market predictions to the shares of popular support reported in opinion polls. We believe that predicting shares of seats in a parliamentary system is more difficult for traders since published polling information is typically related to popular vote shares. As the relationship between popular vote shares and shares of seats is not precisely defined, and is unlikely to be stable at a time when significant new parties are contesting the election, traders in the House of Commons Market had an added challenge.8
Trading in the UBC-ESM The fully computerized UBC-ESM opened for trading on 5 July 1993 and closed at midnight on the night before the election, 25 October 1993.9 Mar-
CANADIAN P UBLIC P OLICY – ANALYSE DE POLITIQUES,
ket participants sent in cheques that were posted into personal accounts on the computer system. Once an account was open, the trader could buy or sell contracts. Each contract had a liquidation value — the payoff that depended upon the election results. After the election the liquidation value of each trader’s portfolio was assessed, and he or she received a cheque for that amount of money by mail.10 Contracts were initially put into circulation through the sale of “unit portfolios” by the UBCESM system. A unit portfolio consisted of one of each of the contracts available in a given market. The computer stood ready to buy or sell unit portfolios for exactly one dollar at any time. If left sitting in a trader’s account, a unit portfolio was the same as a dollar. To bear any risk, and have any chance of a positive return, traders had to hold unbalanced portfolios. There were no commissions or other fees charged for trading, and the design of the market guaranteed that all money invested was paid out. In other words, for traders the market was a zero-sum game: every dollar lost by one trader was a dollar earned by other traders.11 During the time the market was open, traders could buy and sell contracts as they saw fit, subject only to three basic restrictions: they were not allowed to sell contracts they did not own (that is, short sales were not allowed); they could not buy what they did not have the cash to pay for; and they had to sell at prices other traders were willing to pay and buy at prices at which others were willing to sell. 12 As in any market, traders made money by “buying low and selling high.”
The Three Markets House of Commons Market In this market there were six different contracts available. The contracts were: BQ (Bloc Québécois), LIB (Liberal Party), NDP (New Democratic Party), PC (Progressive Conservative Party), REF (Reform Party), and OT (Other Parties and Individuals). The
VOL. XXIV , NO. 3 1998
Markets as Predictors of Election Outcomes unit portfolio in this market consisted of one of each of these contracts. There were 295 seats in the Canadian House of Commons in 1993. In the election, the Reform Party won 52 seats. Since 52 seats is 17.6 percent of the available total of 295 seats, each REF contract had a liquidation value of $0.176. The other liquidation values were calculated analogously. 13
Majority Government Market In the Majority Government Market there were three contracts traded: M.LIB, M.PC, M.NO, where the “M” signifies contracts in the Majority Government Market. The unit portfolio consisted of one of each of these contracts and was available for one dollar. Since there were 295 seats to be filled, the contract M.LIB was to have a liquidation value of one dollar if the Liberals elected at least 148 members of the House of Commons, as actually occurred. It was to have a liquidation value of zero if the Liberals elected fewer than 148 members. The contract M.PC was to have a liquidation value of one dollar if the Progressive Conservatives elected at least 148 members and a liquidation value of zero if it elected fewer than 148 members. The contract M.NO was to have a liquidation value of one dollar if both M.LIB and M.PC had liquidation values of zero and a value of zero otherwise.14 Thus, one and only one contract in this market will have a liquidation value of one dollar. Popular Vote Market In this market there were again six contracts traded; as in the House of Commons Market there was one contract representing each major political party and a sixth representing “Other” parties and individuals contesting the election. Thus the identification of the contracts were P.BQ, P.LIB, P.NDP, P.PC, P.REF and P.OT, where “P” signifies contracts in the Popular Vote Market. The ultimate payoff from owning a contract for a party in this market was a liquidation value determined as one dollar times that party’s share of the national popular vote in the election.
333
DESCRIPTIVE SUMMARY AND FINAL MARKET PREDICTIONS At the close of the market there were 257 registered traders who had collectively invested $30,345.56. This made the average investment about $118, but the amounts invested by individual traders varied considerably. The minimum allowed level of investment was five dollars and there were 20 traders at this level. At the other extreme there were nine traders who invested the maximum allowed, which was $1,000. Trading volumes grew throughout the duration of the market as new traders were added and interest in the election increased, but there were some local peaks in early-to-mid August and just after the televised leaders’ debates. For the last month, trading volumes were between $3,000 and $4,000 per week, about half of which represented trades in the House of Commons Market. Traders participated from locations all across Canada, with a handful trading from the United States.15 In a number of ways our traders were not representative of the Canadian voting population. For example, traders were disproportionately from British Columbia (58 percent); male (90 percent); they were relatively well-educated (about 25 percent had doctorates and 20 percent master’s degrees); and, finally, almost 60 percent of them were university or community college staff members, students, or faculty. As one would expect, some traders made and some lost money. The maximum profit earned by a trader was $755.90, and the largest loss was $773.90. The equally weighted average rate of return to investors was -3.1 percent; however, individual earnings and rates of return varied a great deal.16
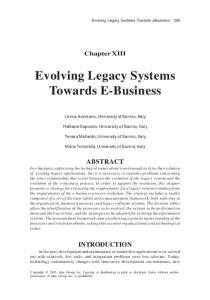
Market Prices and Final Market Predictions Figures 1a and 1b and 2a and 2b illustrate the daily closing prices for the House of Commons and Popular Vote Markets respectively.17 Since the UBC-ESM was open continuously until midnight on the eve of
C ANADIAN P UBLIC P OLICY – ANALYSE DE POLITIQUES,
VOL . XXIV, NO . 3 1998
334 R. Forsythe, M. Frank, V. Krishnamurthy and T.W. Ross FIGURE 1(a) UBC-ESM Daily Closing Prices, House of Commons Markets 0.55 0.50 0.45
Price ($)
0.40 0.35 0.30 0.25 0.20 0.15 0.10 0.05 09/27 10/11 10/25 07/19 08/16 08/30 09/13 08/02 07/05 10/04 10/18 08/23 09/06 09/20 07/12 07/26 08/09 PC
LIB
FIGURE 1(b) UBC-ESM Daily Closing Prices, House of Commons Markets 0.50 0.45 0.40
Price ($)
0.35 0.30 0.25 0.20 0.15 0.10 0.05 0.00 07/05 09/27 07/19 08/02 09/13 10/11 08/16 08/30 10/25 09/06 07/12 07/26 08/09 09/20 10/04 08/23 10/18 BQ
CANADIAN P UBLIC P OLICY – ANALYSE DE POLITIQUES,
REF
NDP
VOL. XXIV , NO. 3 1998
Markets as Predictors of Election Outcomes
335
FIGURE 2(a) UBC-ESM Daily Closing Prices, Popular Vote Market 0.45 0.40
Price ($)
0.35 0.30 0.25 0.20 0.15 0.10 09/13
09/20
10/04
09/27 LIB
10/11
10/18
10/25
10/11
10/18
10/25
PC
FIGURE 2(b) UBC-ESM Daily Closing Prices, Popular Vote Market 0.35 0.30
Price ($)
0.25 0.20 0.15 0.10 0.05 0.00 09/13
09/20
09/27 P.BQ
10/04 P.REF
P.NDP
C ANADIAN P UBLIC P OLICY – ANALYSE DE POLITIQUES,
VOL . XXIV, NO . 3 1998
336 R. Forsythe, M. Frank, V. Krishnamurthy and T.W. Ross the election, there are no actual “daily closing prices.” We used the last trade before midnight on the day as the “close” for the day. 18
The most noticeable error for the public opinion polls was that they were excessively pessimistic concerning OT (other candidates).
From 5 July when the House of Commons market opened, until the election was called on 8 September 1993, the Liberals and the Progressive Conservatives were virtually tied. A gap opened and continued to expand from about 20 September onward. In the Popular Vote Market there was also a progressive erosion in the Conservative contract values starting around 20 September. In the House of Commons Market the price of the LIB shares turned sharply upward following the televised leaders’ debates of 3 and 4 October.
These findings are very much like those reported in Forsythe et al. (1991a; 1991b; 1992) for the American elections where market forecasts also outperformed the public opinion polls. To be fair to the Canadian polling organizations, legal restrictions forced them to report their final poll results on 22 October rather than on the eve of the election. This meant that their sampling had to be done between 17 and 20 October, so their numbers are “older” than the numbers generated through trading on the UBCESM. The important point, however, is that UBCESM traders did more than just trade based on the polls. Even if they found information in the polls (which we assume they did), they evidently brought other valuable information to the market as well.
Much the same pattern can be found in the public opinion polls. The Angus Reid poll of 20 September reported that the Liberal and Progressive Conservative parties were tied at 35 percent.19 The next Angus Reid poll released on 8 October revealed that the Liberals had opened a significant lead, 37 percent to 22 percent, over the Conservatives. Figures 1 and 2 reveal that, by this time, substantial price differences had emerged between Liberal and Conservative contracts in both the House of Commons and Popular Vote Markets. In short, the basic trends reflected in the opinion polls were similar to pricing observed on the UBC-ESM. However, as we show in the next section, for those polls which caused a market reaction, the market did not swing as widely as the polls. The final market predictions in the Popular Vote Market and the actual final results are given in Table 1(a), together with the final Angus Reid and Gallup poll results.20 Note first that the public opinion polls did a good job of forecasting the final vote tallies.21 However, the UBC-ESM generated a mean absolute forecast error that was roughly half the size of the errors of the leading opinion polls. The largest error in the UBC-ESM predictions was in the market’s excessive optimism concerning the number of votes to be received by the New Democratic Party.
CANADIAN P UBLIC P OLICY – ANALYSE DE POLITIQUES,
Final market predictions and actual outcomes for the House of Commons Market are provided in Table 1(b). Here the market did not do as well. UBCESM traders were as surprised as most people by the way votes were distributed in favour of the Liberals and to the disadvantage of the Progressive Conservatives. However, predictions for the new parties, the Bloc Québécois and Reform, were quite accurate. 22 Thus, these results appear to support our conjecture that predicting shares of seats in the House of Commons is a more challenging task for traders than predicting shares of the popular vote. Alternatively, it is possible that traders using what might normally be reliable historical relationships between votes and seats could have been fooled if 1993 was “special.” In Forsythe et al. (1995) we considered whether or not the 1993 election was unusual in terms of historical vote-seat relationships in Canadian federal elections. Our results suggested that while the Liberals seem to have done unusually well in converting their votes into seats, the other results were not so significantly different from historical patterns.
VOL. XXIV , NO. 3 1998
Markets as Predictors of Election Outcomes
337
TABLE 1(a) Final Polls, Popular Vote Market Predictions and Final Outcomes (Percent)
Party
Angus-Reid (Oct 22)
Gallup (Oct 22)
UBC-ESM Popular Vote Market Close (Oct 24)
Acutal Result (Oct 25)
BQ LIB NDP PC REF OT
14.00 43.00 7.00 17.90 17.90 2.90
12.00 44.00 7.00 16.00 19.00 2.00
13.20 41.00 8.80 16.50 18.70 3.40
13.50 41.20 6.90 16.00 18.70 3.70
1.13
1.07
0.53
Mean Absolute Error
TABLE 1(b) Final House of Commons Predictions and Outcomes
share
number
Party
UBC-ESM House of Commons
Actual Result
UBC-ESM House of Commons
Actual Result
BQ LIB NDP PC REF OT
18.0 50.1 4.9 9.7 16.6 0.5
18.3 60.0 3.1 0.7 17.6 0.3
53 148 14 29 49 1
54 177 9 2 52 1
CAMPAIGN EVENTS AND MARKET REACTIONS During the course of an election campaign analysts typically point to certain critical moments as having significant impact. Accordingly we examined whether such dates appear to be associated with a significant change in prices in the UBC-ESM. Here we consider a number of events political commentators focused on during the campaign. Analyzing the effect of particular events on the value of potentially affected securities is a common
task in economics and finance. The working hypothesis is that the market prices reflect the available information. If so, when new information arrives, the market price must adjust to reflect the newly available facts. The idea is to look at price changes on those dates when new information arrives. If the new information is unimportant to the value of the security, then the price of the security is not expected to change. If the new information is significant, then the price will adjust to reflect the information. The procedures for doing such studies are very well established. Campbell, Lo and MacKinlay (1997)
C ANADIAN P UBLIC P OLICY – ANALYSE DE POLITIQUES,
VOL . XXIV, NO . 3 1998
338 R. Forsythe, M. Frank, V. Krishnamurthy and T.W. Ross provide a particularly thorough review of the methodology. To carry out an event study one must define several elements. First, it is necessary to identify the “events.” As discussed more carefully below, in our case the events are simply a number of the things that took place during the campaign. Second, it is usually necessary to remove the “normal” return that would have been expected to take place for that security, in the absence of any relevant news. This is done to avoid interpreting an ordinary movement in the price as an unusual one. To do this it is common to use regressions with a market index as the explanatory variable. This removes the average movement in the market for the period in question. Since our market is zero sum, we know in advance that in the absence of news, the expected price change on any given day is zero. The “normal” daily return in the ESM is zero by construction. Hence the distinction between the “normal” and the “abnormal” returns is not relevant for the ESM. This is important since it implies that a very simple empirical method (described below) is appropriate. Third, we need to define the estimation window. If the window is too short, part of the movement in the price may be missed. If the window is too long, then statistical significance will be lost in the ordinary day-to-day variation of prices. This is a particular concern given that our “events” potentially include both the actual political events as well as the media spin they receive. Ideally one might try to distinguish these effects in the market prices. However, we take the position that these are so closely intertwined in time, that they cannot be meaningfully separated empirically. Our approach is to consider both one- and two-day event windows. To assess the empirical significance of the campaign events, we compute the empirical distribution of daily returns to each contract. That is, we create
CANADIAN P UBLIC P OLICY – ANALYSE DE POLITIQUES,
lists of the daily returns to each contract, order them from high (positive) to low (negative) and look for the 5 percent and 10 percent tails at both ends of each distribution. In the House of Commons and Majority Government Markets there were 111 daily returns. Since 5 percent of 111 is about 5.5 we took the average of the fifth and sixth highest returns as the cutoff for the top 5 percent of the distribution. Similarly, the bottom 5 percent was determined by averaging the fifth and sixth lowest returns. The eleventh highest and eleventh lowest returns gave us the cutoff for the top and bottom 10 percent of the distributions. In the Popular Vote Market there were only 41 daily returns, so the second from the top and bottom gave us the 5 percent tails and the fourth highest and lowest the 10 percent tails.23 Event studies of campaign events pose special challenges. Given the nature of these events we typically know when to start the event window. However, much of the impact of these events may be felt over several days as traders wait for the reactions of the media and opinion leaders. For example, traders watching and attempting to evaluate the effects of the leaders’ debates will care not only about how they thought the candidates performed, but also about how the debates are reported the next day if they believe voters will be changing opinions based upon media reports. To assess the significance of returns spread over two days, we did a similar ordering of two-day returns and determined the empirical tails of those distributions. With an exception for the study of market reactions to the release of polls, what follows will focus on the reactions in the House of Commons market for which we have many more days of trading (than the Popular Vote Market) and for which trading volumes were much higher. Event days for which there were significant market returns include: 2 September: Prime Minister Campbell cuts back the controversial order for helicopters from 50 to 43. This produced a positive return for her party of
VOL. XXIV , NO. 3 1998
Markets as Predictors of Election Outcomes 2.56 percent which is just large enough to fit into the top 10 percent of daily returns. The Bloc Québécois may have been the loser, as BQ shares fell 8.97 percent. There were no significant effects on the other parties. 8 September: The election is called and the prime minister warns Canadians to expect high unemployment for the rest of the century. Prices on PC go up by over 6 percent (top 5 percent tail), but then begin a slide that pulls them back down 10 percent over the next five days. REF shares also fall, losing over 20 percent on 8 and 9 September, which fits into the 10 percent tail of the distribution of twoday returns. Bloc Québécois share prices fall on 8 September but then rise sharply over the next two days. The 22 percent increase from 9-10 September is in the top 5 percent of the two-day distribution; over the three days combined BQ shares rose over 17 percent. 24 September: Prime Minister Campbell says that the reform of social policy is too complicated to be debated during an election campaign.24 This starts a string of negative returns that brings the PC price down almost 38 percent over the next two weeks. It falls 10 percent in the first three days. The gains are spread across the other parties, the biggest winner being REF shares which climb in price more than 25 percent over three days; the combined increases of 25 and 26 September fitting into the top 10 percent two-day tail. Johnston et al. (1994) also note a sharp drop in support for the Conservatives around this period, but believe most of the effect to have come in the days just before this announcement.25 3-4 October: The French and English language televised leaders’ debates are held. Trading volumes rose rapidly to the highest levels seen in the market to that time. Combining price changes on 4 and 5 October, the winners were those holding REF contracts as they increased in price by about 32 percent, above the cutoff for the top 5 percent tail. All other parties lost, with the largest and most signifi-
339
cant losses coming to NDP (down 14 percent, fitting into bottom 5 percent tail) and LIB (down 5 percent net, but actually up on October 5).26 12 October: Newspaper stories report racist remarks by Reform Party candidate John Beck. REF share prices fall over 9 percent, almost enough to fit in the 5 percent tail. Both the Conservatives and Liberals gain over the 12-13 October period with price increases of about 5 percent and 10 percent, respectively, both within the top 5 percent tails. 27 16 October: The Conservative Party begins airing and then pulls controversial television advertisements drawing attention to unflattering aspects of Jean Chrétien’s facial appearance. Between 16 and 17 October, PC shares lost over 6 percent in value while LIB share prices rose over 6 percent (fitting into the top 5 percent tail). The effects on the other contracts were much less significant. Johnston et al. (1994, p. 7) also find this to be a significant event in their polling data.28 We studied returns around several other event dates and found no significant price movements that can be plausibly attributed to the event. Other dates considered include 11 August (Prime Minister Campbell condemns Ontario Premier Bob Rae’s economic plans), 14 September (Quebec Premier Robert Bourassa announces his intention to resign), 16 September (Liberals release the “Red Book” outlining their plans for economic and social policy), 27 September (NDP leaks document that appears to indicate Conservatives are planning major cuts to social programs), 29 September (Conservatives release position paper indicating that there will be no such cuts) and 20 October (Pierre Trudeau warns against supporting the BQ).
Opinion Polls as Events We can use the above procedure to study the influence of polls on the market. The release of some polls did seem to move the Popular Vote Market. On 30 September (Ekos) and 2 October (Compass)
C ANADIAN P UBLIC P OLICY – ANALYSE DE POLITIQUES,
VOL . XXIV, NO . 3 1998
340 R. Forsythe, M. Frank, V. Krishnamurthy and T.W. Ross polls were released that were perhaps the first to show the Liberals opening a significant lead, more due to a decline in support for the Conservatives than an increase in support for the Liberals. In this period P.PC shares fell and P.REF shares rose in value. The price of P.LIB shares did not change significantly. On 22 October both Gallup and Angus Reid released their final election polls which confirmed the large Liberal lead. Between 22 and 23 October, P.PC shares fell about 14 percent while P.LIB shares rose about 8.5 percent and P.BQ shares over 16 percent. To test more formally the extent to which poll results represented news to traders and influenced market prices, we estimated the following model. The price of any contract at time t is estimated to be a function of that contract’s price in the previous two periods and the shock created by poll results that differed from current prices in the Popular Vote Market. So, for example, the price of P.BQ shares in the popular vote market could be written (where V denotes a price in the popular vote market):
the release of poll results. The results of these regressions are reported in Table 2(a). These regressions reveal that prices in this market may indeed be following random walks. In a “random walk” the expected value of a variable this period is just equal to its actual value last period. The constant term and coefficient on prices lagged two periods are significantly different from zero in only a few cases. Poll surprises seemed to affect only Liberal and Progressive Conservative share prices in a significant way. However, in each case a poll surprise of 5 percentage points moved prices only about one cent, suggesting the market did not swing as widely as the polls. We can estimate a similar model for the House of Commons Market, but since the polls are not directly comparable to prices in this market we must incorporate some information from the Popular Vote Market. We could take coefficient estimates from Table 2(a) and use them to measure surprises in an equation like, for the BQ: (3) MBQ,t=c0+c1MBQ,t-1+c2MBQ,t-2+d[PBQ,t-E(PBQ,t)]Dt+wt
(1)
VBQ,t = a0+a1VBQ,t-1+a2VBQ,t-2+b[PBQ,t-E(PBQ,t)]Dt+ut
where PBQ,t is the popular vote share of the BQ reported in a poll at date t and D t is a dummy variable set equal to one if there was a poll released at time t. The expression E(PBQ,t) represents the market’s expectation of the poll results. The expected results of the poll are just the expected price absent a poll shock: (2)
E(PBQ,t) = a0 + a1VBQ,t-1 + a2VBQ,t-2
Equation (2) can be inserted into (1) and the coefficients estimated using non-linear maximum likelihood techniques. Equations of this form were estimated for each of the six contracts in the Popular Vote Market.29
where MBQ,t is the price of BQ shares in the House of Commons Market at date t. Given the evidence above that the prices in the Popular Vote Model are following a random walk, here we try something simpler, letting E(PBQ,t), the expected poll results, equal the actual price in the Popular Vote Market at time t-1. The results of these regressions are presented in Table 2(b).30 Here prices do not appear to be following a random walk. While the constant term is small and often insignificant, the coefficients on both last period’s price and two-day old prices are both generally quite significant. Again, poll surprises did appear to move prices on Liberal and Progressive Conservative contracts and at about the same rate as the other market: a 5 percent surprise translates to a one cent adjustment in LIB or PC contract prices.
Estimates of the coefficients of this model allow us to determine the size of the surprise provided by
CANADIAN P UBLIC P OLICY – ANALYSE DE POLITIQUES,
VOL. XXIV , NO. 3 1998
Markets as Predictors of Election Outcomes
341
TABLE 2(a) Effects of Poll Results on Prices in Popular Vote Market
Coefficient Estimates (standard errors in parentheses) Dependent Variable Party
a0
a1
a2
b
R2(adj)
BQ
- 0.006 (0.011)
0.691 (0.158)
0.374 (0.184)
0.064 (0.092)
0.73
LIB
- 0.042 (0.026)
0.897 (0.121)
0.225 (0.147)
0.278 (0.051)
0.90
NDP
0.012 (0.007)
0.944 (0.139)
- 0.082 (0.141)
0.005 (0.066)
0.81
PC
- 0.011 (0.008)
0.812 (0.154)
0.213 (0.160)
0.233 (0.089)
0.97
REF
0.004 (0.004)
1.211 (0.166)
- 0.227 (0.162)
0.100 (0.062)
0.97
OT
0.022 (0.009)
0.463 (0.170)
0.055 (0.177)
0.063 (0.081)
0.15
TABLE 2(b) Effects of Poll Results on Prices in House of Commons Market
Coefficient Estimates (standard errors in parentheses) Dependent Variable Party
c0
c1
c2
d
R2(adj)
BQ
- 0.0001 (0.003)
0.567 (0.093)
0.443 (0.093)
0.131 (0.112)
0.95
LIB
- 0.007 (0.011)
0.879 (0.092)
0.143 (0.100)
0.224 (0.071)
0.94
NDP
0.010 (0.005)
0.618 (0.094)
0.235 (0.098)
0.050 (0.069)
0.62
PC
- 0.016 (0.004)
0.754 (0.091)
0.286 (0.094)
0.217 (0.093)
0.99
REF
0.005 (0.004)
0.756 (0.090)
0.209 (0.090)
0.031 (0.105)
0.89
OT
0.002 (0.0006)
0.581 (0.094)
0.201 (0.094)
- 0.053 (0.041)
0.56
C ANADIAN P UBLIC P OLICY – ANALYSE DE POLITIQUES,
VOL . XXIV, NO . 3 1998
342 R. Forsythe, M. Frank, V. Krishnamurthy and T.W. Ross PERSONAL PREFERENCES AND JUDGEMENT BIAS There is considerable evidence of judgement bias in the political arena. Political scientists have observed a tendency for survey respondents to overestimate their preferred candidate’s or party’s chances of victory. For example, evidence of judgement bias appeared in work on the 1988 Canadian general election by Johnston et al. (1992).31 Markets such as the UBC-ESM provide a way to assess the degree of judgement bias in which the subjects reveal their beliefs about outcomes through their trading activity. Forsythe et al. (1991b; 1992) found evidence of judgement bias in traders on the Iowa Political Stock Market. Here we report results consistent with those found by the Iowa team. We looked for evidence of judgement bias in two places drawing on data from the traders’ market holdings and from answers provided by a number of traders to an on-line survey conducted near the end of the campaign. Traders were not compelled to answer the survey questions and many chose not to, so our sample is considerably smaller than the set of all traders. First, we ascertain if the holdings of traders are aligned with their stated party preferences. The social psychology literature recognizes a bias termed “the false consensus effect” or the tendency of individuals to overestimate the extent to which their views are shared by others in the population (see, for example, Brown 1982). Second, we determine how traders’ perceptions of which candidate won the leaders’ debates were related to their own political preferences and the extent to which this influenced their trading behaviour. Psychologists recognize the tendency of an individual’s personal preferences about an event to affect his or her interpretation of information relating to that event as a bias termed the “assimilation-contrast effect” (see, for example, Parducci and Marshall 1962).
Political Preferences and Contract Holdings The first test involves several rather straightforward steps. Before we assess the significance of contract holdings, we define an “unbalanced portfolio” for CANADIAN P UBLIC P OLICY – ANALYSE DE POLITIQUES,
each trader. A trader’s unbalanced portfolio at closing is just the number of shares of each contract held after all unit portfolios have been withdrawn from the trader’s account.32 This recognizes the fact that unit portfolios are just cash in another form, and it is really only the unbalanced portion of a trader’s holdings that reveals any information. Given market closing prices of all contracts, we compute the value of each trader’s unbalanced portfolio and the percentage shares of that value attributable to holdings in each contract. By a similar procedure we can determine the aggregate value of unbalanced holdings in the entire market and the percentage shares attributable to each party’s contracts.33 Finally, by comparing an individual trader’s unbalanced holdings to those of the market (that is, of the average trader), we can look for patterns influenced by personal preferences. Tables 3(a) and 3(b) report the results of these comparisons. To understand how to read these columns consider the middle column headed “NDP” in Table 3(a). The share 4.9 percent indicates that 4.9 percent of the value of all unbalanced holdings in the House of Commons Market held by all traders was in NDP contracts. This value is determined using prices at market closing. Below that, we can see that among traders who indicated a preference for the New Democratic Party, NDP contracts amounted to 17.4 percent of the value of unbalanced holdings.34 The last number in the column reveals that there were 17 traders who indicated a preference for the New Democratic Party and who had some unbalanced holdings of contracts in the House of Commons Market. In the House of Commons Market there is indeed evidence of judgement bias. With the exception of the one Bloc Québécois supporter, the other groups had larger holdings of their preferred parties than did the market generally. In terms of ratios, these results are strongest for those preferring the New Democratic and Progressive Conservative Parties. These traders had portfolio shares of their preferred party over three times larger than the market average. VOL. XXIV , NO. 3 1998
Markets as Predictors of Election Outcomes
343
TABLE 3(a) Preferences and Unbalanced Portfolios, House of Commons Market
In the Following Contracts: Percent of Unbalanced Portfolio Held By: All traders Those who prefer column contract Number who prefer
BQ
LIB
NDP
PC
REF
OT
18.0% 0.0% 1
50.2% 62.5% 33
4.9% 17.4% 17
9.7% 31.5% 30
16.7% 35.8% 25
0.5% 13.5% 9
TABLE 3(b) Preferences and Unbalanced Portfolios, Popular Vote Market
In the Following Contracts: Percent of Unbalanced Portfolio Held By: All traders Those who prefer column contract Number who prefer
P.BQ
P.LIB
P.NDP
P.PC
P.REF
P.OT
13.0% — 0
40.4% 33.4% 12
8.7% 0.7% 7
16.2% 42.1% 18
18.4% 24.4% 15
3.3% 26.3% 4
TABLE 4 Preferences and Holdings Regression
Coefficient on Preference Dummy Variable
Constant Term Contracts BQ LIB NDP PC REF OT
Coefficient
t-ratio
Coefficient
t-ratio
R 2(adj)
0.133 0.329 0.066 0.179 0.057 0.044
6.33 8.44 3.56 5.68 2.59 2.40
- 0.133 0.297 0.108 0.136 0.301 0.091
- 0.57 3.91 2.12 2.12 6.10 1.32
0.0 % 10.3 % 2.7 % 2.7 % 22.6 % 0.6 %
The sample sizes in the Popular Vote Market were much smaller and the results on judgement bias more mixed. While traders preferring the Conservatives, Reform, and Other Parties held larger shares of those parties in their portfolio, supporters of the Liberals and NDP held shares smaller than the market average in the corresponding contracts.
To assess the statistical significance of the differences in the House of Commons Market we estimated a series of equations in which the share of unbalanced holdings in a particular party’s contracts was regressed on a constant and a dummy variable that equalled one if the trader preferred that party. The sample for these regressions included only those
C ANADIAN P UBLIC P OLICY – ANALYSE DE POLITIQUES,
VOL . XXIV, NO . 3 1998
344 R. Forsythe, M. Frank, V. Krishnamurthy and T.W. Ross To determine whether these assessments really matter we compared survey respondents’ contract holdings moments before and two days after the debate. If traders acted on their views of the debate, they should have increased their holdings (relative to other traders) of the contracts of the party whose leader they saw as performing best. The results of this comparison are presented in Tables 6(a) and 6(b) for holdings in the House of Commons and Popular Vote Markets.
traders for whom we had preference information and who had some unbalanced holdings. The results of these regressions are reported in Table 4.35 These results are quite clear: for all contracts except Bloc Québécois and Other (for which there are very few supporters in our sample), an individual trader’s personal preference had a positive and statistically significant (at the 5 percent level or better) effect on the holding of contracts related to the preferred party.
Political Preferences and Evaluation of the Debate While too few of our traders watched the televised French-language leaders’ debate on 3 October, a large enough number watched the English-language debate the next evening to permit us to compare traders’ political preferences to their perceptions of which leader “won” the debate. Questions about the debates were administered through an on-line survey the day after the English debate. While more traders felt the leader of the Reform Party had won, the patterns of responses suggest some judgement bias here as well. Table 5 reports these results. As is clear from the size of the numbers in bold type relative to the others in their columns, supporters of a party were more likely to report the view that “their” leader won than to report that any other leader won.
These tables report on the share of unbalanced holdings of each contract before and after the debate. For example, the first number in Table 6(a) reveals that those who felt that the BQ leader “won” the debate held 3.8 percent of all the BQ shares held in unbalanced portfolios just before the debate. The number below that reports that those holdings went up to 7.0 percent after the debate.36 Notice that, across the two markets, holdings of the party perceived to have won the debate went up in eight out of the ten cases. In one other case the holdings fell only marginally. We conclude that this provides some evidence that traders did respond to their own evaluations of the leaders’ performances in the English-language debate.
TABLE 5 Political Preferences and Evaluations of the Debate
Party Preferred Leader Who Won BQ LIB NDP PC REF No Opinion ColumnTotal % Column Total No.
Row Total,
LIB
NDP
PC
REF
OT
Undecided
0 44.4 16.7 0 38.9 0
0 28.6 50.0 0 14.3 7.1
7.1 7.1 0 50.0 35.7 0
11.1 5.6 0 0 83.3 0
0 0 0 50.0 0 50.0
0 25.0 12.5 25.0 12.5 25.0
3 16 11 10 30 4
100.0 18
100.0 14
99.9 14
100.0 18
100.0 2
100.0 8
74
CANADIAN P UBLIC P OLICY – ANALYSE DE POLITIQUES,
VOL. XXIV , NO. 3 1998
Number
Markets as Predictors of Election Outcomes
345
TABLE 6(a) Changes in Holdings after Debate, House of Commons Market
BQ
LIB
Perceived Winner NDP
Holdings of perceived winner before
3.8 %
9.7 %
12.6 %
11.8 %
80.1 %
Holdings of perceived winner after
7.0 %
12.8 %
19.4 %
11.3 %
88.7 %
Change
+ 3.2
+ 3.1
+ 6.8
- 0.5
+ 8.6
3
16
10
8
29
BQ
LIB
Perceived Winner NDP
PC
REF
Holdings of perceived winner before
18.1 %
14.6 %
42.0 %
31.4 %
61.6 %
Holdings of perceived winner after
8.3 %
18.4 %
42.5 %
33.9 %
66.7 %
Change
- 9.8
+ 3.8
+ 0.5
+ 2.5
+ 5.1
2
6
6
5
18
Holdings Before and After
Number of traders with unbalanced holdings before and/or after
PC
REF
TABLE 6(b) Changes in Holdings after Debate, Popular Vote Market
Holdings Before and After
Number of traders with unbalanced holdings before and/or after
Judgement Bias and the Marginal Trader The results just reported suggest that the UBC-ESM traders exhibited familiar judgement biases: they tended to have an exaggerated view of the likely success of the party they personally supported. This bias could derive, in part, from the fact that interpretations of important campaign events were influenced by preferences. In the campaign event studied here, the English-language leaders’ debate, traders’ views about who had “won” the debate varied according to which party the traders preferred. This evidence of judgement bias supports the findings of earlier work on the American presidential election markets operated by Iowa Electronic Markets at the
University of Iowa and of survey research done by many political scientists. In light of these results, the question naturally arises as to how the market could perform so well predicting popular vote shares if traders were so vulnerable to these biases? Two possible explanations come to mind. The first suggests that maybe our traders’ biases essentially cancelled each other out as you might expect if they constituted a representative sample of the voting population. This explanation is easy to reject by simply comparing the preferences of UBC-ESM traders with the final election results. Our traders were not a representative sample
C ANADIAN P UBLIC P OLICY – ANALYSE DE POLITIQUES,
VOL . XXIV, NO . 3 1998
346 R. Forsythe, M. Frank, V. Krishnamurthy and T.W. Ross of voters nationally; they exhibited much less support for the Liberals and the Bloc Québécois and much more for the Conservatives, Reform, and NDP (see Tables 3 and 5). We believe the answer comes from understanding the difference between the average trader and the marginal trader. The biases we have observed are properly attributed to the average or typical trader, but not necessarily to all traders. As long as there are some traders relatively free of such biases and with deep enough pockets, they will take advantage of the biases of other traders and in the process bring prices to levels consistent with unbiased expectations. If biased traders have set the price on some party’s contracts too high, marginal traders can make a profit by buying unit portfolios and selling off the overvalued parts. Such profit opportunities will remain until the price has fallen to a level consistent with an unbiased prediction. If a contract is undervalued, marginal traders will continue to buy until the price is pushed up to levels that make further purchases unprofitable. In this way, marginal traders in the UBC-ESM and other markets, reveal their information to the rest of the market.37 Forsythe et al. (1992) provide evidence that the success of their 1988 US Presidential Market was consistent with a marginal trader hypothesis.38 Using information about how they made trades, the authors identified a group of traders they believed were “marginal” in this sense.39 They showed that this set of marginal traders exhibited virtually no judgement bias while the remaining traders demonstrated significant biases. It would be interesting to determine the characteristics that make for marginal traders and that influence the size of the bias exhibited by the average trader. We considered two questions of this sort.40 First, we wondered whether traders with larger investments would be less prone to judgement bias, second we wondered whether the bias shown by the average trader would shrink as the election date approached. To answer these questions we estimated CANADIAN P UBLIC P OLICY – ANALYSE DE POLITIQUES,
two sets of equations, one set like those in Table 4 but with the dummy variable for party preference also interacted with the size of the trader’s investment and another with the dummy variable also interacted with a time trend. The results are not reported here because they were completely inconclusive — signs and significance levels varied widely. We continue to believe that this is a very interesting line of inquiry, but suspect that there are just too few data to sort out these effects here.
CONCLUSIONS The results of the UBC Election Stock Market operated during the 1993 Canadian federal election provide strong evidence that markets are useful tools for understanding elections. This study has examined election events thought to be important and has looked for, and found, cognitive biases on the part of market participants. Our examination of the significant events of the campaign suggest that certain missteps by the Progressive Conservative Party and its leader were costly to the party. Specifically, Prime Minister Campbell’s statements about her expectations of sustained high unemployment and about the importance of social policy, and the televising of the socalled “Chrétien face ads” resulted in traders revising downward their expectations for the party. Market data suggest that Preston Manning of the Reform Party “won” the English-language leaders’ debate. There was also some evidence that the release of surprising opinion poll results influenced market prices. While this could have represented trader’s expectations that the released results would actually influence voters, it is also likely that revisions in market prices merely reflected the incorporation of news about changing voters’ preferences. A comparison with the analyses of other commentators suggests that the market prices broadly reflect the same forces as do expert opinions. We find this to be reassuring, in the sense that it represents crossvalidation across methods of interpreting the election. VOL. XXIV , NO. 3 1998
Markets as Predictors of Election Outcomes On average the market traders exhibited the same cognitive biases that have been observed in opinion poll research. Despite this fact, the market predicted the popular vote quite well; hence, the forecasting success of markets is not due to a fluke of having found a particular group of unbiased market participants in a particular case. Since we know that human cognitive biases are common, this finding is important for our confidence in the potential robustness of the forecasting success of future election stock markets. Though political scientists have documented the importance of judgement bias in survey research, their work has been questioned by some economists unsure of the validity of surveys in which respondents have no real incentive to answer thoughtfully or truthfully. Our results indicate, however, that judgement bias remains important when traders have a financial stake in the outcome: even when respondents have to put real money on it, their views about the likely success of the parties and their preferences over those parties are related. Traders who hoped a particular party would win tended to hold larger fractions of their portfolios in contracts related to that party than did other traders. This may be due, in part, to the fact that traders seemed to interpret campaign events in ways that reflected their own preferences. Specifically, traders who supported a particular party tended to have a higher opinion of the performance of that party’s leader in the televised leaders’ debate. Our work has shown us that election stock markets are useful for a number of purposes. They can provide accurate measures of the fortunes of political parties throughout (and even outside) election campaigns, and can do so at a fairly modest cost. In addition, quite apart from the political context, they can serve as valuable experiments for studies by economists and social psychologists of individual decision making under uncertainty. As a finance experiment, they create a controlled market ideal for the study of certain questions related to market microstructure. Finally, we believe they hold enor-
347
mous potential as a teaching tool. They provide an accessible way to teach certain principles of economics and finance and to direct and motivate student interest in election campaigns.
NOTES The third author is now with Price Waterhouse LLP. The authors gratefully acknowledge helpful discussions with Jim Brander, Richard Johnston, Lisa Kramer, Mary Margiotta, Forrest Nelson and George Neumann; the suggestions of seminar participants at Carleton University, Simon Fraser University, the University of Alberta, the University of British Columbia, the Canadian Economics Association meetings at the University of Calgary, the 1994 Economics Science Association Meetings in Tucson and of our anonymous referees and the editors of this journal; the very capable technical assistance provided by the Market Administrator, Brian Kapalka and by Pat Darragh, Drew Letcher and several members of the staff of University Computing Services at the University of British Columbia; and the research assistance of Francisco Salas. Financial support for this venture came from the Vancouver Stock Exchange Research Fund in the Faculty of Commerce and Business Administration at the University of British Columbia, the Social Sciences and Humanities Research Council of Canada, and the Office of the VicePresident (Research) at the University of British Columbia. Finally, the authors also wish to acknowledge the important support and encouragement for this project received from the UBC-ESM Governors, former dean Michael Goldberg of the Faculty of Commerce and Business Administration, Mr. Douglas Hyndman of the B.C. Securities Commission and Mr. David Bond of the Hong Kong Bank of Canada. 1Even
well-informed experts often have preferences about election outcomes, and this can colour their interpretation. This is one reason that, on election night, it is common for televised election coverage to include informed experts aligned with each of the major parties. 2There is also an academic literature that seeks to explain or predict election outcomes based on economic variables such as the rates of unemployment and inflation. For Canadian examples of this approach, see Nadeau and Blais (1993, 1995) and Carmichael (1990). 3The
detailed workings of the UBC-ESM and some of
C ANADIAN P UBLIC P OLICY – ANALYSE DE POLITIQUES,
VOL . XXIV, NO . 3 1998
348 R. Forsythe, M. Frank, V. Krishnamurthy and T.W. Ross the basic results of the 1993 market are reported in Forsythe et al. (1995). 4That
is, the final market prices (on the eve of the election) have provided more accurate predictions of shares of votes going to each of the presidential candidates than the final public opinion polls released just before the election. 5For example, prices from the 1993 UBC-ESM were reported weekly in The Globe and Mail from before the election was called until the results were known. There were roughly 61 newspaper articles, 37 radio reports, and 16 television reports discussing this project. 6See,
e.g. Johnston et al. (1994) and the collection of articles in Frizzell et al. (1994). 7The Popular Vote Market did not open for trading until
13 September, approximately two months after the opening for trading of the other two markets. While all three markets were programmed in from the start, we decided not to “turn on” the Popular Vote Market until we had a sufficient number of traders with enough invested in the market so that no market was too thin. 8A
share-of-seats market using the University of Iowa software was run on the 1993 Australian Federal Election, and it did not predict well. However, due to regulatory problems the market was not large in participation or investment. On this project, see Lombardo (1993).
13The
reader will immediately notice that the value of a unit portfolio in this market (or the other markets) will always equal one dollar since the shares will always sum to 100 percent. Thus, buying and holding unit portfolios is a riskless strategy that guarantees a zero net rate of return. 14 This
would have happened if some other party got at least 148 seats or if no single party managed to elect 148 members. 15 The locations of traders in terms of shares of actual numbers and, in parentheses, in share of total investment were: Atlantic provinces 2.3 percent (3.7 percent), Quebec 3.5 percent (1.6 percent), Ontario 25.3 percent (24.9 percent), Alberta-Manitoba-Saskatchewan 6.2 percent (4.0 percent), British Columbia 58.4 percent (59.5 percent), United States 4.3 percent (6.2 percent). 16 The
standard deviation of earnings was $111.64 while the standard deviation of rate of return was 56.1 percent. Individual rates of return ranged from a low of -100 percent (total investment lost) to a high of 261.4 percent. 17 These
data are available upon request from the
authors. 18 The
figures would be virtually identical if we were to plot daily average prices instead. 19 At
9To
the close of trading on 19 September prices in the Popular Vote Market were 33.9¢ for Liberal contracts and 33.4¢ for Progressive Conservatives contracts. The same day in the House of Commons market the Liberals closed at 37.5¢ and the PCs at 34.2¢.
10 For
20 The final market prediction is simply the last transaction price recorded before the market closed at midnight PDT, the night before the election.
avoid any possible conflict with provincial securities law, the proposal for the UBC-ESM was submitted to the British Columbia Securities Commission. We are grateful for the Commission’s support. the purposes of determining final liquidation values, the results reported by Elections Canada the day the writs were returned (14 November 1993) were taken to be official and final. 11 Presumably
traders get some utility from participating, or think they can predict the outcome better than others. Otherwise it is hard to understand why anyone would enter a game in which the net payoffs sum to zero. 12Traders
could post bids or asks and the computer maintained queues of the unfulfilled bids and asks. At any time, traders could see the highest bid price in the bid queue and the lowest ask price in the ask queue.
CANADIAN P UBLIC P OLICY – ANALYSE DE POLITIQUES,
21 To
see how the polls’ performance this year compared with past elections, we collected data on final preelection Gallup polls going back to 1962. (The Angus Reid polls did not become available until the 1980s.) The mean absolute error of the Gallup poll predictions on the vote shares going to the Liberal, NDP, Progressive Conservative, and Other parties over these 11 elections was 1.46 percent. Therefore, the 1993 election was a relatively good one for the polls. 22 While
there is no way to compare the results in this market to the public opinion polls, on the morning of
VOL. XXIV , NO. 3 1998
Markets as Predictors of Election Outcomes election day The Globe and Mail reported a “probable outcome.” The newspaper did not explain exactly how these numbers were arrived at; presumably they reflected the information available to the political reporters, including the weekly reports of the prices in the UBC-ESM in The Globe and Mail. The Globe and Mail’s predictions were quite similar to the UBC-ESM predictions for the House of Commons. 23 An
alternative approach would have been to estimate a “market model” in which the (daily) return to holding a particular contract is regressed on the return to the market and a dummy for event dates. Since these markets cannot grow or shrink (since shares should always sum to 100 percent), we do not have a market return to use as an explanatory variable. What is left is basically what we have here — a test to see if that date’s return was significantly different from that contract’s average daily return. We have chosen to do this test in a direct way. 24 Lumb (1994, p. 116) calls this “the major gaffe of the campaign.” Woolstencroft (1994, p. 18) agrees that it was an important event. 25 The
UBC-ESM showed a decline on PC prices in the days before this announcement as well. See Johnston et al. [1994, p.7] for a discussion of what might have been the cause, which was related to allegations of the existence of a “secret plan” to cut social programs. 26 Johnston
et al. (1994, Figure 1, p. 6) also show a Reform gain after the leaders’ debates. Ellis and Archer (1994, p. 72) take the view that the Reform leader at least held his own and the survey data reported in LeDuc (1994, p. 136) suggest that he was perceived as winning the debate by more viewers than all but the Liberal leader. If this performance was better than expected, the market should have responded positively. 27Ellis and Archer (1994, p. 72) and Lumb (1994, pp.
119120) recognized this as an important event for Reform. 28 Woolstencroft
(1994, pp. 20-21), Clarkson (1994, p. 37) and Lumb (1994, p. 122) all view this as an important event. For example, Lumb states that the advertisements “ignited a firestorm of revulsion.” 29As the share prices are clearly not independent (given that popular vote shares must sum to one), they should perhaps be estimated as a system. We will be exploring this route in future work.
349
30 We
also estimated (3) with the expected poll numbers given by equations like (2) with the parameter estimates coming from the estimation of (1). The results were qualitatively identical to those presented here. 31 See
also, Brady and Johnston (1987), Bartels (1987), Lazarsfeld, Berelson and Gaudet (1944); Carroll (1978); Brown (1982); Granberg and Brent (1983); and Uhlaner and Grofman (1986). As an example, Granberg and Brent (1983) report that at one point in the 1980 US presidential election campaign, over 80 percent of those intending to vote for the Democratic Party expected Jimmy Carter to win while 87 percent of those intending to vote Republican expected Ronald Reagan to win. For more on the various kinds of judgement bias and how they relate to political stock markets, see Forsythe et al. (1991b; 1992). 32 For example, suppose Trader A holds 10 shares of BQ, 7 LIB, 8 NDP, 5 PC, 6 REF, and 8 OT in the House of Commons Market. Then it would be possible to withdraw five unit portfolios, leaving an unbalanced portfolio of 5 BQ, 2 LIB, 3 NDP, 1 REF, and 3 OT. 33 As
there are always the same number of contracts issued in all parties, if the final market prices summed to one the shares attributable to the parties’ contracts in the market as a whole would be equivalent to those prices (since each is multiplied by the same quantity). However, the final prices did not exactly sum to one in any of the three UBC-ESM markets. 34 In
fact traders were asked their political preferences in three separate surveys during the campaign. The last survey was done during the week preceding the election and those are the responses used here. When a trader did not answer the last preference survey but did answer a previous survey, the most recent response was used for that trader. 35 Regressions
for holdings in the Popular Vote Market were also run, but since all of the preference coefficients were insignificant (except that for the P.OT contracts) these results are not presented here. 36 “Just
before the debate” means at the moment when the debate began (i.e. 5:30 p.m. PDT, 4 October). “Just after” refers to midnight 6 October, which gave traders two full days to adjust their portfolio. 37 The
reader might also sense a relationship between
C ANADIAN P UBLIC P OLICY – ANALYSE DE POLITIQUES,
VOL . XXIV, NO . 3 1998
350 R. Forsythe, M. Frank, V. Krishnamurthy and T.W. Ross the predictive power of our traders and the ability of a “Condorcet jury” to make correct decisions when each jury member has very imperfect information. (On the application of the Condorcet jury theorem to elections see, for example, Miller 1986). While the problems are related in the sense that they both involve groups of imperfectly informed agents combining their information to make better-informed decisions, our traders are not Condorcet jurors in at least two important respects. First, they have different levels of initial investment, meaning that their “votes” do not have equal weight. Second, our market evolves over time and traders make many decisions that can add to or subtract from their wealth. They are constantly learning from and teaching each other. This means that even if we limited each investor to identical initial investments we would still not have the equivalent of a Condorcet jury. 38 See Forsythe et al. (1998) for a further discussion of tests of the marginal trader hypothesis. 39 Specifically,
they looked to see if a given trader was a “price taker,” that his/her trades were made by accepting bids or asks posted by others, or “price setters,” those who posted the bids or asks that others accepted to create trades. They defined “marginal traders” to be those traders who were price setters in this sense. 40 We
are grateful to an anonymous referee for suggesting these questions.
REFERENCES Bartels, L. (1987), Presidential Primaries and the Dynamics of Public Choice (Princeton: Princeton University Press). Brady, H. and R. Johnston (1987), “What’s the Primary Message: Horse Race or Issue Journalism?” in Media and Momentum: The New Hampshire Primary and Nomination Politics, ed. G. Orren and N. Polsby (Chatham, NJ: Chatham House Publishers). Brealy R., S. Myers, G. Sick, and R. Giammarino (1992), Principles of Corporate Finance, 2d ed. (Toronto: McGraw-Hill Ryerson). Brown, C. (1982), “A False Consensus Effect in 1980 Presidential Preferences,” Journal of Social Psychology 118:137-38. Campbell, J.Y., A.W. Lo, and A.C. MacKinlay (1997), The Econometrics of Financial Markets (Princeton, NJ: Princeton University Press).
CANADIAN P UBLIC P OLICY – ANALYSE DE POLITIQUES,
Carmichael, C. (1990), “Economic Conditions and the Popularity of the Incumbent Party in Canada,” Canadian Journal of Political Science 23: 713-26. Carroll, J. (1978), “The Effect of Imagining an Event on Expectations for the Event: An Interpretation in Terms of the Availability Heuristic,” Journal of Experimental Social Psychology 14: 88-96. Clarkson, S. (1994), “Yesterday’s Man and His Blue Grits: Backward into the Future,” in The Canadian General Election of 1993, ed. Frizzell, Pammett and Westell. Ellis, F. and K. Archer (1994), “Reform: Electoral Breakthrough,” in The Canadian General Election of 1993, ed. Frizzell, Pammett and Westell. Forsythe, R., M. Frank, V. Krishnamurthy and T. Ross (1995), “Using Market Prices to Predict Election Results: The 1993 UBC Election Stock Market,” Canadian Journal of Economics 28: 770-93. Forsythe, R., F. Nelson, and G.R. Neumann (1993), “The Iowa Political Market,” Department of Economics, University of Iowa. Mimeographed. Forsythe, R., F. Nelson, G.R. Neumann and J. Wright, (1991a), “The Iowa Presidential Stock Market: A Field Experiment,” in Research in Experimental Economics, Vol. 4, ed. R.M. Isaac (Greenwich, CT: JAI Press Inc.): 1-43. ____ (1991b), “The Explanation and Prediction of Presidential Elections: A Market Alternative to Polls,” in Laboratory Research in Political Economy (Ann Arbor, MI: University of Michigan Press). ____ (1992), “Anatomy of an Experimental Political Stock Market,” American Economic Review 82: 1142-161. Forsythe, R., T. Rietz and T. Ross (1998), “Wishes, Expectations and Actions: Price Formation in Election Stock Markets,” Faculty of Commerce and Business Administration, University of British Columbia. Mimeographed. Frizzell, A., J. Pammett and A. Westell, ed. (1994), The Canadian General Election of 1993 (Ottawa: Carleton University Press). Gelman, A. and G. King (1993), “Why Are Presidential Elections So Predictable?” British Journal of Political Science, 23: 409-51. Granberg, D. and E. Brent (1983), “When Prophesy Bends: The Preference-Expectation Link in U.S. Presidential Elections,” Journal of Personality and Social Psychology 45: 477-91. Johnston, R., A. Blais, H. Brady and J. Crête (1992), Letting the People Decide: Dynamics of a Canadian
VOL. XXIV , NO. 3 1998
Markets as Predictors of Election Outcomes Election (Montreal and Kingston: McGill-Queen’s University Press). Johnston, R., A. Blais, E. Gidengil, N. Nevitte and H. Brady (1994), “The Collapse of a Party System? The 1993 Canadian General Election,” prepared for the 1994 Annual Meeting of the American Political Science Association, New York City. Mimeographed. Lazarsfeld, P., B. Berelson and H. Gaudet (1944), The People’s Choice: How a Voter Makes Up His Mind in a Presidential Campaign (New York: Columbia University Press). Leduc, L. (1994), “The Leaders’ Debates: Critical Event or Non-Event?” in The Canadian General Election of 1993, ed. Frizzel, Pammett and Westell. Lombardo, R. (1993), “The Australian Political Stock Market: A Market Approach to Political Poll Prediction,” paper presented at Fifth Annual Conference of the Centre for Experimental Economics, University of Adelaide. Mimeographed. Lumb, L. (1994), “The Television of Inclusion,” in The Canadian General Election of 1993, ed. Frizzell, Pammett and Westell. Miller, N. (1986), “Information, Electorates and Democracy: Some Extensions and Interpretations of the
351
Condorcet Jury Theorem,” in Information Pooling and Group Decision-Making, ed. B. Grofman and G. Owen (Greenwich, CT: JAI Press). Nadeau, R. and A. Blais (1993), “Explaining Election Outcomes in Canada: Economy and Politics,” Canadian Journal of Political Science 26: 775-90. ____ (1995), “Economic Conditions, Leader Evaluations and Election Outcomes in Canada,” Canadian Public Policy – Analyse de Politiques 21: 212-18. Parducci, A. and L. Marshall (1962), “Assimilation vs. Contrast in the Anchoring of Perceptual Judgments of Weight,” Journal of Experimental Psychology 63: 42637. Traugott, M. and V. Price (1992), “Exit Polls in the 1989 Virginia Gubernatorial Race: Where Did They Go Wrong?” Public Opinion Quarterly 56: 245-53. Uhlaner, C. J. and B. Grofman, (1986), “The Race May Be Close But My Horse Is Going to Win: Wish Fulfilment in the 1980 Presidential Election,” Political Behavior 8: 101-29. Woolstencroft, P. (1994), “ ‘Doing Politics Differently’: The Conservative Party and the Campaign of 1993,” in The Canadian General Election of 1993, ed. Frizzell, Pammett and Westell.
C ANADIAN P UBLIC P OLICY – ANALYSE DE POLITIQUES,
VOL . XXIV, NO . 3 1998