International Business & Economics Research Journal
Volume 2, Number 1
Statistical Literacy: Performance And Perceptions Of Accounting Students Marianne L. James,Ph.D, CPA, CMA (E-mail:
[email protected]), California State University, Los Angeles Carol Blaszczynski,Ph.D., (E-mail:
[email protected]), California State University, Los Angeles
Abstract Statistical literacy is critical for business professionals in terms of their research consumption role and their ability to interpret and apply statistics. Students enrolled in five sections of Intermediate Accounting (n = 132) completed a 17-item survey that included statistics calculation items, identification of appropriate statistical tests, interpretation of statistical outcomes, and perception items. There were no statistically significant gender differences in performance on any of the items. Overall, the statistical literacy of accounting students was poor as measured by their performance on the various items.
1. Introduction Statistical thinking is thought to be mysterious to some people. Snee (1993) observed, “. . . in general, people don’t understand statistical thinking and as a result don’t value its use. People can’t value what they don’t understand” (p. 150). According to Paulos (1988), “A study indicates that whether or not a department has a mathematics or a statistics requirement is the most important single determinant of where a woman will attend graduate school to study political science” (p. 72). Since mastery and enjoyment of statistics may influence major selection, knowledge of the statistical literacy of students is important for academic departments. As a result, this study seeks to identify the level of statistical literacy among accounting students enrolled in intermediate-level classes in terms of mastery of calculations, interpretation of results, and identification of the correct statistics to be used in given situations. 2. Need for the Study Statistical knowledge and skills are important not only for the academic researcher, but also in everyday business life. For example, financial statement auditors rely heavily on statistical sampling in choosing transactions for detailed substantive testing. Selecting an appropriate capital budgeting or investment strategy from a number of feasible alternatives is significantly aided by the use of statistical tools. In addition, statistical knowledge and skills are international, extending beyond the boundaries of countries and continents. In everyday life, knowledge of statistics may enhance decision making processes and outcomes for individual consumers of goods, services, and information.
____________________ Readers with comments or questions are encouraged to contact the authors via email. 55
International Business & Economics Research Journal
Volume 2, Number 1
3. Literature Review This section includes a review of the literature about statistics anxiety and business statistics course curriculum. According to Onwuegbuzie (2000), statistics anxiety is the apprehension that “occurs as a result of encountering statistics in any form and at any level” (p. 323). Furthermore, research studies have found that statistics anxiety is associated with the number of college-level courses completed in mathematics and the time elapsed since the student’s last course in mathematics (Benson, 1989; Roberts & Saxe, 1982; Tomazic & Katz, 1988; Wilson, 1997). Moore (2001) stated, “Many students never acquire conceptual understanding or flexible skills that they can apply in settings new to them” (p. 7). Moreover, the relationship between statistics anxiety and foundational mathematics skills has been found to be statistically significant (Roberts & Saxe, 1982). Dhebar (1993) identified the selection of the correct problem-solving tool as one of seven elements displayed by effective consumers of quantitative research. Dhebar (1993) asserted, Personal observations, conversations with executives about the practice of quantitative analysis in their organizations, and information from former students working in consulting and financial services organizations all suggest that many quantitative tools are used, not because they are appropriate to the problem being solved, but because the problem solvers are familiar with them or because the tools are in vogue. (p. 72) Much has been written about the mathematics achievement gender gap. The number of female students enrolling in mathematics classes has increased (American Association of University Women, 1999). In the realm of statistics, Harkness and Grabowski (1997) found no statistically significant differences between the achievement of male and female students in the elementary statistics course. Most statistics courses include two primary components: statistical tools and techniques (Tabatabai & Gamble, 1997). The topics covered most frequently in the first course in business statistics in order of frequency are describing data, probability distributions, sampling distributions, estimation, basic probability, means hypothesis testing, displaying data, continuous random variables, proportions and data collection. A review of pertinent literature found no study that investigated U.S. accounting students’ knowledge and mastery of basic statistical operations and tests. Hence this study attempted to fill some of the gap in the literature. 4. Research Questions Four research questions were posed for this study about the level of statistical knowledge and perceptions of those enrolled in intermediate accounting courses concerning students’: 1. 2. 3. 4.
ability to perform basic statistical operations; ability to identify statistical tests appropriate for particular research objectives; ability to interpret results of statistical tests; and perceptions regarding their enjoyment of statistics and their ability to understand articles that describe statistics used in research studies in their field.
5. Methods of Research A questionnaire was developed by the researchers to capture information about demographics, statistical course background, and performance on five descriptive statistics calculations and three identification questions, six questions requiring identification of appropriate statistical tests, and three objective questions dealing with interpretation of statistical outcomes. In addition, three questions asking students to report their perceptions utilizing a 5-point Likert scale were included. The instrument was reviewed by two colleagues for face validity. 56
International Business & Economics Research Journal
Volume 2, Number 1
The questionnaire was administered during the Fall 2001 and Winter 2002 terms (two consecutive quarters) in five sections of Intermediate Accounting. These junior-level collegiate courses are required of students majoring in accounting. In addition, non-accounting majors who have satisfied required prerequisites (i.e., principles of accounting) may also enroll in Intermediate Accounting. Students were assured that their responses were anonymous and that their performance on questions and calculations would not affect their course grade. Data were input into Microsoft Excel and imported into the Statistical Package for the Social Sciences (SPSS) version 10.0 for analysis. All results were evaluated at the 0.05 alpha level. The questionnaire was completed by 132 students. 6. Demographics This section presents information concerning the demographics of the study participants including gender, age group, ethnic identity, working status, major, academic standing, and the highest level of statistics course completed. Of the 132 study participants, 74 percent were female, and 26 percent were male. The relatively high percentage of female students is typical for the accounting program at this Western University. When students were asked to indicate the age group to which they belong, 6 percent indicated that they were less than 21 years old; 36 percent indicated that they were between 21-25 years old; 31 percent indicated that they were between 26-30 years old; 18 percent indicated that they were between 31-35 years old; 2 percent indicated that they were between 36–45 years old; 4 percent indicated that they were between 46-50 years old, and 3 percent indicated that they were more than 50 years old. The study participants were asked to indicate their ethnicity. The participants’ responses to this question were stratified into five groups (African-American, Asian, Caucasian, Hispanic, and Other). Based on these categories, 5 percent identified themselves as African-American, 66 percent as Asian, 5 percent as Caucasian, 21 percent as Hispanic, and 3 percent as Other. The study participants were asked to indicate whether they currently worked, and 67 percent indicated that they did. Seventy percent of the participants were accounting majors, and 30 percent were non-accounting business majors. Five percent of the participants were sophomores, 59 percent were juniors, 22 percent were seniors, and 14 percent were graduate students. The study participants were asked to indicate the highest level statistics class they had completed. The researchers classified the responses to this question dichotomously, with “1" representing a lower-level statistics course and “2" representing a higher-level statistics course. Lower-level statistics courses are indicated at this university by a 200 number series, and higher-level courses by 300- or 400-level series. Based on this stratification, 47 percent had completed a 200-level statistics course as their highest-level statistics course, and 53 percent had completed a 300- or 400-level statistics course. 7. Results This section details the findings concerning accounting students’ performance on statistical problems and questions and their perceptions concerning statistics. The mean number correct for the 14 items (excluding the perception items) was 3.76 (26.85%). The problems posited, the correct solutions, the mean correct answers, and associated standard deviations are detailed in Table 1. 8. Performance on the Statistical Calculations and Identifications To assess accounting students’ ability to calculate and to identify commonly utilized descriptive statistics, the participants were provided with six two-digit numbers and asked to calculate or to indicate the mode, mean, median, range, and variance associated with these numbers. The use of calculators was not permitted. Performance on these calculations varied considerably, with students performing best on identifying the mode and median, and performing worst on calculating the variance. Specifically, 58 percent correctly identified the mode, 59 percent correctly identified the 57
International Business & Economics Research Journal
Volume 2, Number 1
median, 47 percent correctly calculated the mean, 31 correctly identified the range, and none of the participants correctly calculated the variance. However, two of the study participants had correctly calculated the standard deviation instead of calculating the variance. 9. Performance on Statistical Test Identification Items Students were provided with a list of six statistical tests and six brief descriptions of situations/objectives requiring statistical analysis. The participants were asked to match the situations/objectives with the appropriate statistical test. Overall, performance on these identification questions was poor, with less than half of the students correctly identifying any of the appropriate situations or objectives with the given six statistical tests. Specifically, 13 percent of the students were able to identify the situation that described a chi-square test, 36 percent were able to identify the situation describing a correlation, 17 percent were able to identify the situation describing the need for a discriminant analysis, 10 percent were able to identify the situation appropriate for a one-way analysis of variance (ANOVA), 19 percent were able to identify the situation describing regression analysis, and 18 percent were able to identify the situation requiring a t-test.
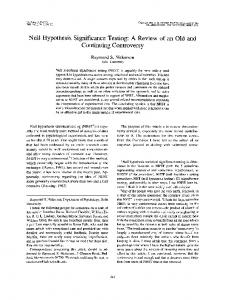
Table 1 Descriptive Statistics (n = 132) Data given: 10, 12, 12, 12, 14, 15 Statistics Problem Mode Mean Median Range Variance Chi Square Correlation Discriminant Analysis One-Way ANOVA Regression T-test Significance Strength of 0.70 correlation Indication of significance
Solution
Mean Percentage Correct
Standard Deviation
12.0 12.5 12.0 10-15 3.1 Non-parametric test Association between variables Predicts group membership Used to detect differences among at least 3 groups How much of one variable is predicted by another Differences between means of groups 0.05
58 47 59 31 0 13 36 17 10
104 50 49 46 0 34 48 38 30
19
39
18
39
14
34
Strong
46
50
Asterisks
18
39
10. Performance on Statistical Results Interpretation Questions The study participants were asked several objective questions requesting that they interpret statistical results. These included identifying the p-value commonly accepted as indicating statistical significance, interpreting the strength of a given correlation, and identifying the symbol commonly used to identify statistical significance in tables. Specifically, 14 percent of the participants were able to correctly identify the common cut-off indicating a statistically significant result, 46 percent of the participants were able to correctly identify a strong correlation, and 18 percent were able to identify the common symbol used in tables to indicate statistical significance.
58
International Business & Economics Research Journal
Volume 2, Number 1
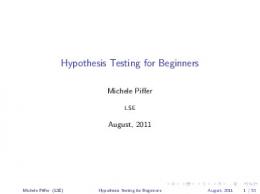
11. Perceptions About Statistics The study participants were also asked to rate a statistical outcome, to indicate their enjoyment in working with statistics, and to rate their ability to understand statistical results. The study participants were asked to indicate their agreement or disagreement concerning the effect of the number of decimal places used to express a statistic on the degree of precision of measurement. The mean rating assigned by the participants was 3.77, which based on a 5-point Likert scale, represents more than neutral agreement with the statement that the greater number of decimal places used to express a statistic, the more precise the measurement. Participants were also asked to rate their enjoyment in working with statistics. When asked to rate their agreement with the statement, “I like working with statistics,” the mean rating was 2.78. Thus, the mean responses of the participants were somewhat less than neutral, slightly inclined toward disagreement with the statement. Participants were also asked to rate their ability to understand articles that describe statistics used in research studies in their field. As shown in Table 2, the participants’ mean rating was 2.83, which means that on average the students’ agreement with this statement fell somewhat short of neutral. Table 2 Perception Items (n = 132) Mean Rating
Standard Deviation
The greater the number of decimal places used to express a statistic, the more precise the measurement.
3.78
1.24
I like working with statistics.
2.79
1.16
I am able to understand articles that describe statistics used in research studies in my field.
2.83
0.93
Item
Note. Ratings were based on a 5-point Likert scale: 1 = strongly disagree; 2 = disagree; 3 = neutral; 4 = agree; 5 = strongly agree.
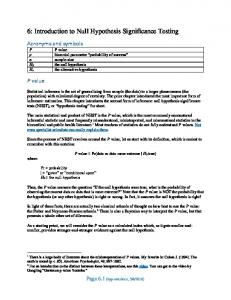
11.1 Significant Associations Several significant or highly significant associations were identified. Academic major and standing, age, completion of a higher-level statistics class, and the participants’ perceptions were significantly associated with performance on one or more of the calculations, identification, and evaluation items. Table 3 provides detailed information about significant or highly significant associations. Effect of Major. Non-accounting majors were more likely to identify the situation describing discriminant analysis than were accounting majors. Academic major was not associated with performance on any of the statistical calculations, statistical results interpretation items, or participants’ perceptions of understanding and enjoyment of statistics. Being an accounting major was negatively associated with academic standing. This is an expected result since intermediate accounting represents the first course taken by accounting majors within the accounting program, while non-accounting majors may enroll in the class at any time after having completed the prerequisites. Effect of Gender. Gender was not associated with performance on any of the calculations and identifications of descriptive statistics items, identifications of appropriate situations for given statistical tests, interpretations of results, and perceptions concerning enjoyment of working with statistics or understanding articles presenting statistical findings. Con59
International Business & Economics Research Journal
Volume 2, Number 1
trary to popular belief, the study confirms the work of others (Harkness & Grabowski, 1997) that males did not perform better on statistical problems, applications, and interpretations than did females, nor did their perceptions regarding understanding and enjoyment of statistics differ from those of female participants. Effect of Academic Standing. Academic standing was highly positively associated (p < 0.01) with correctly identifying the appropriate situation matching a chi-square test. Thus, seniors and graduate students were more likely to correctly identify the situation appropriate for a chi-square test than were juniors. Academic standing was not positively associated with performance on any of the descriptive statistics items or with student perceptions of their understanding and enjoyment of statistics.
Table 3 - Significant Associations Associations Among Factors, Performance, and Perceptions
Variable Major:
Performance item Non-accounting major
Academic Standing: Higher
Age: Older Highest Statistics Course: Higher
Discriminant Analysis Academic Standing
F-value 3.6 10.9
p-value 0.04* 0.00**
Chi Square Non-accounting major
4.80 4.46
0.00** 0.00**
Asterisks Interpretation
2.24
0.04*
T-test Academic Standing
4.09 6.21
0.02* 0.00**
Mean Enjoy Statistics Academic Standing
2.60 5.63 2.57
0.04* 0.00** 0.04*
Mean Median Understand Articles
2.91 3.18 4.72
0.03* 0.02* 0.00**
Perceptions Understanding Statistics: Agree
Like Statistics:
Note. * p < 0.05; ** p < 0.01.
Effect of Age Group. Age was positively associated with performance on one of the test interpretation items; older students were more likely to identify the asterisks as the commonly used indicator of significance in a statistical table than were younger students (p < 0.05). Age was not associated with performance on any of the calculation items, identification items, or Likert items concerning the participants’ perceptions. Effect of Level of Prior Statistics Courses. Having completed a higher level instead of only a lower-level statistics course was positively associated (p < 0.05) with the ability to identify the situation appropriate for a T-test. Thus, students who had completed a 300- or 400-level statistics course were more likely to correctly identify the T-test with the appropriate situation than were those who had completed a 200-level statistics course. The level of statistics courses completed by students was not associated with performance on any of the descriptive statistics calculations, the statistical results interpretation items, or the participants’ perceptions. Furthermore, the completion of a higher level statistics course was highly positively associated (p < 0.01) with a higher total number of correct answers on the instrument. 60
International Business & Economics Research Journal
Volume 2, Number 1
Effect of Participant Perceptions. This section addresses the aspects of enjoyment of statistics, understanding of statistics, and associations with the participants’ performance on descriptive statistics calculations and statistical test identifications and interpretations. Enjoyment of Statistics. The participants’ agreement with the statement that they enjoyed working with statistics was positively associated with performance on calculating the mean and identifying the median (p < 0.05). Thus, participants who were more likely to agree with the statement that they enjoyed working with statistics tended to perform better on these two descriptive statistics items. In addition, the perception of enjoyment was also highly positively associated (p < 0.01) with participants’ perception that they understand articles that describe statistics used in research studies in their field. Understanding of Statistics. Participants who were more likely to agree with the statement that they were able to understand articles that describe statistics used in research studies in their field tended to perform better on calculating the mean (p < 0.05). In addition, participants who felt that they understand statistics also were more likely to agree with the statement that they enjoyed working with statistics (p < 0.01). Intercorrelations of Variables. Performance on many of the descriptive statistics items and the test identification items was positively (p < 0.05) or highly positively (p < 0.01) correlated. Thus, participants who were able to calculate or identify correctly some statistical items were more likely to be able to perform well on the calculations or the identification of other statistical items. 12. Discussion Students performed better on the calculations of the measures of central tendency that required the least amount of mathematics: the median and the mode. Of course, the absence of calculators during the survey administration could have contributed somewhat to this phenomenon. It is, however, somewhat disturbing that so few students calculated the mean accurately since the numbers were selected to require the least amount of mathematics to aid in mental calculation of the mean. Accounting majors generally like mathematics; thus, the results are disappointing. Performance on the statistical test identification items was poor indicating a lack of statistical literacy. These results echo the statement by Moore (1993) that students may not be able to apply statistics knowledge to new settings and echo the belief of Dhebar (1993) that problem-solving tool selection is a critical component of statistical literacy. It is encouraging that no significant differences were found between the genders in performance on any of the calculation, statistical test identification, statistical results interpretation, or perception items. The results of students’ perceptions were somewhat encouraging. Students’ responses were slightly lower than neutral in terms of rating their enjoyment of working with statistics and their ability to understand statistical results, which indicated that the students did not overstate their abilities. 13. Recommendations The following recommendations are made for business educators: 1.
Avoid assuming that students have attained mastery of statistics simply because they have completed prior coursework. A review of statistics may be required before adding new concepts that build upon prior learning.
2.
Assign readings of appropriate related research studies in courses to facilitate the development of students as (a) consumers of research and (b) interpreters and users of statistics in their business careers.
61
International Business & Economics Research Journal
Volume 2, Number 1
References 1. 2. 3. 4.
5. 6. 7. 8. 9. 10. 11. 12.
American Association of University Women Educational Foundation. (1999). Gender gaps: Where schools still fail our children. New York: Marlowe & Company. Benson, J. (1989). “Structural components of statistical text anxiety in adults: An exploratory model”. Journal of Experimental Education, 57, 247-261. Dhebar, A. (1993). “Managing the quality of quantitative analysis”. Sloan Management Review, 34(2), 69-75. Harkness, W. L., & Grabowski, B. L. (1997). “Gender differences among students in elementary statistics courses”. 1997 Proceedings of the Section on Statistical Education, 116-119. Alexandria, VA: American Statistical Association. Moore, D. S. (2001). “Undergraduate programs and the future of academic statistics”. American Statistician, 55(1), 1-6. Onwuegbuzie, A. J. (2000). “Statistics anxiety and the role of self-perceptions”. The Journal of Educational Research, 43(5), 323-330. Paulos, J. A. (1988). Innumeracy: Mathematical illiteracy and its consequences. New York: Hill and Wang. Roberts, D. M., & Saxe, J. E. (1982). “Validity of a statistics attitude survey: A follow up study”. Educational and Psychological Measurement, 42, 907-912. Snee, R. D. (1993). “What’s missing in statistical education?” The American Statistician, 47(2), 149-154. Tabatabai, M., & Gamble, R. (1997). “Business statistics education: Content and software in undergraduate business statistics courses”. Journal of Education for Business, 73(1), 48-53. Tomazic, T. J., & Katz, B. M. (1988). Statistical anxiety in introductory applied statistics. Paper presented at the annual meeting of the American Statistical Association, New Orleans, LA. Wilson, V. (1997). Factors related to anxiety in the graduate statistics classroom. Paper presented at the annual meeting of the Mid-South Educational Research Association, Memphis, TN.
62