102
IEEE TRANSACTIONS ON IMAGE PROCESSING, VOL. 12, NO. 1, JANUARY 2003
Frequency Layered Color Indexing for Content-Based Image Retrieval Guoping Qiu and Kin-Man Lam
Abstract—Image patches of different spatial frequencies are likely to have different perceptual significance as well as reflect different physical properties. Incorporating such concept is helpful to the development of more effective image retrieval techniques. In this paper, we introduce a method which separates an image into layers, each of which retains only pixels in areas with similar spatial frequency characteristics and uses simple low-level features to index the layers individually. The scheme associates indexing features with perceptual and physical significance thus implicitly incorporating high level knowledge into low level features. We present a computationally efficient implementation of the method, which enhances the power and at the same time retains the simplicity and elegance of basic color indexing. Experimental results are presented to demonstrate the effectiveness of the method. Index Terms—Color indexing, content-based image retrieval, human vision, signal analysis.
I. INTRODUCTION
R
EPRESENTATION is fundamental in both biological and computational vision systems [23]. An effective, efficient and suitable representation is the key starting point to building image processing and computer vision systems. In many ways, the success or failure of an algorithm depends greatly on an appropriately designed representation. In the computer vision community, it is a common practice to classify representation schemes as low-level, intermediate-level and high level. Lowlevel deals with pixel level features, high level deals with abstract concepts and intermediate level deals with something in between. Whilst low level vision is fairly well studied and we have a good understanding at this level, mid and high level concepts are very difficult to grasp, certainly extremely difficult to represent using computer bits. In the signal processing community, an image can be represented in the time/spatial domain and in the frequency/spectral domain. Both time domain and frequency domain analysis technologies are very well developed [21], [22]. A signal/image can be represented as time sequence or transform coefficients of various types, Fourier, Wavelet, Gabor, KLT, etc. These coefficients often provide a convenient way to interpret and exploit the physical properties of the original signal. Exploiting well-established signal analManuscript received April 26, 2002; revised September 16, 2002. The associate editor coordinating the review of this manuscript and approving it for publication was Dr. Tamas Sziranyi. G. Qiu is with the the School of Computer Science, The University of Nottingham, Nottingham NG8 1BB, U.K., and also with the Center for Multimedia Signal Processing, Department of Electronic and Information Engineering, The Hong Kong Polytechnic University, Hong Kong (e-mail:
[email protected]). K.-M. Lam is with the Center for Multimedia Signal Processing, Department of Electronic and Information Engineering, The Hong Kong Polytechnic University, Hung Hum, Hong Kong (e-mail:
[email protected]). Digital Object Identifier 10.1109/TIP.2002.806228
ysis technology to represent and interpret vision concepts could be a fertile area for making progress. The human vision system is extremely sophisticated and powerful. Building machines that can mimic humans ability to process visual information is the “Holy Grail” of vision research. Even though much about the human vision system remains unknown, many theories of biological vision exist, e.g., [15]–[19]. These human vision theories could provide guidance to building practical engineering solutions to vision tasks, e.g., [12]. Content-based image and video indexing and retrieval have been a popular research subject in many fields related to computer science for over a decade [1], [2]. Of all the challenging issues associated with the indexing and retrieval tasks, “retrieval relevance” [20] is probably most difficult to achieve. The difficulties can be explained from a number of perspectives. First, relevance is a high level concept and is therefore difficult to describe numerically/using computer bits. Secondly, traditional indexing approaches mostly extract low-level features in a lowlevel fashion and it is therefore difficult to represent relevance using low-level features. Because low-level features can bear no correlation to high level concepts, the burden of relevant retrieval has to be on high-level retrieval strategies, which is again hard. We believe one way in which one can make progress is to develop numerical representations (low-level features) that not only have clear physical meanings but also can be related to high level perceptual concepts. From an engineering point of view, such representation should be easy to compute, efficient to store and which should also render simple and effective retrieval. There is apparent evidence to suggest that the human vision system consists of frequency sensitive channels [14]–[18]. In other words, when we see the visual world, we perform some form of frequency analysis among many other complicated and not yet understood processing. Following the frequency analysis argument, it can be understood, that when a subject is presented an image in front of her, she will “decompose” the image into various frequency components and processing each component with different processing channels (presumably in a parallel fashion). It is convenient to view such a process as decomposing the image into different layers, each layer consisting of an image the same size as the original one, but only pixels in areas within a certain spatial frequency range are retained in each layer, i.e., a bandpass filtered version of the original image. On each layer, only those grid positions where the pixels have a certain “busyness” will have values and other grid positions will be empty. It should be noted that we are not suggesting such “analyses” occur in the human visual system, we are simply using such a representation, which we believe is more informative and illuminating in our current application.
1057-7149/03$17.00 © 2003 IEEE
QIU AND LAM: FREQUENCY LAYERED COLOR INDEXING FOR CONTENT-BASED IMAGE RETRIEVAL
103
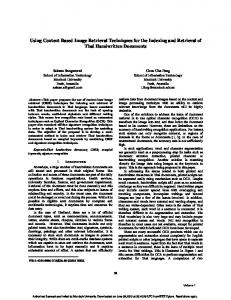
Fig. 1. Schematic of frequency layered image indexing.
Fig. 2. Computationally efficient layer classification method.
In this paper, we apply the physiological and psychophysical ideas of multiple spatial frequency channels [14]–[18] and digital signal analysis (processing) techniques [13], [20]–[23] to the development of an efficient and effective image indexing method for content-based image retrieval. The organization in the rest of the paper is as follows. In Section II, we briefly review related literature on representing image features for content-based image retrieval. In Section III, we present the motivation and the framework for representing an image in frequency classified layers. Section IV presents an image-indexing algorithm based on the frequency layered representation. Section V presents experimental results and Section VI concludes our presentation. II. BACKGROUND In the past decade, content-based image retrieval has attracted extensive research interest [1], [2]. Content description is the crucial first step and many methods have been proposed in the
Fig. 3.
Magnitude of the Laplacian as a function of the input frequency.
literature. Simple color indexing, or the color histogram method [4], has been shown to be very effective. The advantage of using
104
IEEE TRANSACTIONS ON IMAGE PROCESSING, VOL. 12, NO. 1, JANUARY 2003
Fig. 4.
Example images and their frequency-classified layers. A white color indicates that the pixel is absent from that position.
color histogram is that it is very simple and easy to implement. Color histogram is also insensitive to scale, rotation and translation. Furthermore, color histogram is robust against occlusion and changes in camera view points. Studies have shown color histogram based image retrieval to be very successful for small size databases [4]. On the other hand, when the databases contain tens of thousands of images, color histogram based methods are less effective [1]. One of the problems of the color histogram method is that only color information is recorded and information regarding the spatial positions of the color is not included. Consequently, two images with very different spatial color layouts can have the same color histogram. When the database is large, the chances of (visually) different images having similar histograms increase, thus reducing the effectiveness of the method. Recognizing this problem, many authors have proposed different approaches to remedy the scheme. One such approach is to divide an image into subimages and describe each subimage with a separate color histogram [5], [6]. The drawback of such method is that it is computationally expensive and the storage overheads are high. Also these methods cannot accommodate
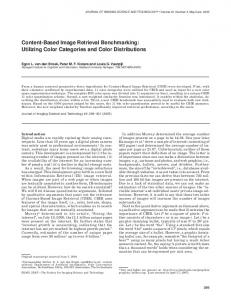
Fig. 5. Accumulated histogram of Laplacian images.
translation and rotation of color regions. A more sophisticated approach is to use image segmentation [7]. Although this technique can identify regions more accurately, the difficulty associated with image segmentation makes it complicated both in terms of feature extraction and matching. It has been argued that image retrieval will probably not require accurate image segmentation [1].
QIU AND LAM: FREQUENCY LAYERED COLOR INDEXING FOR CONTENT-BASED IMAGE RETRIEVAL
105
color correlogram, which collects statistics of the co-occurrence of two colors some distance apart. In [11], connected pixels with similar colors are grouped together to form color blobs and statistics of the color blobs geometry properties are used to retrieve image. Experimental results have shown all these methods performed better than simple color histogram. There are other methods developed to improve the use of color in image retrieval. Readers please refer to recent comprehensive survey papers, e.g., [1] and [2]. Studies have shown color was still by far the more effective cue for image retrieval, plus the simplicity of color histogram, we believe it is still a very attractive indexing feature. The key is to develop methods that maintain the simplicity and elegance of basic color indexing and at the same time to incorporate other features to enhance image retrieval performances. In the rest of the paper, we will present a new color indexing method and its performance. III. FREQUENCY CLASSIFIED LAYERED REPRESENTATION
Fig. 6. Examples of the precision query images. When an image in (a) was used as query, the unique correct answer is its corresponding image in (b), or vice versa.
Another line of work designed to improve the use of color in image retrieval is to incorporate local spatial relations. In [8], each pixel is classified as coherent or noncoherent, based on whether the pixel and its neighbors have similar colors. Such approach can distinguish widely scattered pixels from closely clustered pixels, thus increasing the discrimination power. A similar method, known as the color structure descriptor is defined in the MPEG-7 standard [9]. An 8 8 mask is used as the structuring element to collect color statistics such that spatially highly scattered and closely clustered color pixels can be distinguished. In [10], the local spatial relationship is captured as a
We are interested in developing efficient and effective image indexing features for content-based image indexing and retrieval. Ideally, the indexing features should be chosen in such a way that simple retrieval methods, such as computing or , in the simple metric distance measures, such as feature space will produce good results. It is also well known that simple low-level features, such as color histogram, will bear little correlation to perceptual similarities if only simplistic distance measures are used for retrieval. We believe by associating simple low-level features, such as color histogram, with perceptual and physical meanings and representing such an association with simple numerical vectors, one can develop better image retrieval methods. The judge of the performance of an image retrieval system is a human user. Therefore, a good system should follow the way humans judge similarity and relevance to retrieve images. Such an idea has been explored in [12], where the authors first performed psychophysical experiments and then analyzed the experimental data to extract vocabulary and grammar used by humans to perform similarity judgement. Feature extraction and similarity matching were based on such psychophysical findings. In this work, we are partly motivated by results of biological vision studies beginning in the mid-1960s, specifically, the “frequency analysis” idea of the human visual system [14]–[18]. According to the frequency analysis theory of human visual system, there exist multiple spatial frequency channels; each acts as a bandpass filter, responses only to a certain bandwidth of the visual stimulus. It is therefore convenient to think of the visual system as a signal analyzer, or a filter bank consisting of multiple filters, each filter’s response covers certain areas of the spatial frequency spectrum. The well-known opponent color theory [3] suggests that there are three visual pathways in the human color vision system and the spatial sharpness of a color image depends mainly on the sharpness of the light dark component of the images and very little on the structure of the opponent-color image components. In terms of perceptual significance of an image, the sharpness or roughness of an image region determines its perceptual importance. Psychophysical studies of color vision suggest that there is a division of function between luminance (achromatic) vision
106
IEEE TRANSACTIONS ON IMAGE PROCESSING, VOL. 12, NO. 1, JANUARY 2003
Fig. 7.
Precision query and correct answer images. The numbers indicate the rank of the correct answer for the two methods.
and color vision. Luminance vision is able to detect sharp edges and the fine details of patterns and textures in the image whereas color vision is left to “fill in” the color of objects and forms [19]. This may suggest that frequency analysis occur mostly in the luminance channel. Digital signal processing researchers have developed a wealth of technologies to analyze physical phenomena such as sharpness/roughness of a signal/image. The most effective way is frequency analysis; technologies ranging from linear filter to filter banks have been well studied [21], [22]. A busy/sharp area is as-
sociated with higher frequency components and a flat area has lower frequency distributions. A busy area may be associated with textured surfaces or object boundaries; a flat area may be associated with backgrounds or interior of objects. Therefore a red color in a flat area may signify a red background or large red objects with a flat surface and a similar red color in a busy area may be indications of red colored textured surfaces or red object boundaries. It is therefore clear from human perception’s point of view that; different frequency components of the visual stimulus may
QIU AND LAM: FREQUENCY LAYERED COLOR INDEXING FOR CONTENT-BASED IMAGE RETRIEVAL
107
Fig. 7. (Continued.) Precision query and correct answer images. The numbers indicate the rank of the correct answer for the two methods.
be treated differently by the visual system. Physically, different frequency components of the signal may correspond to different objects or object parts. Consequently, different frequency components of the visual stimulus may not only have different perceptual significance, they may also correspond to different phys-
ical objects. We therefore reason that the process of judging the similarity of images may occur as follows: a frequency analysis is performed and the visual stimuli are decomposed into different frequency components; the corresponding frequency components are compared and then a final similarity score is
108
IEEE TRANSACTIONS ON IMAGE PROCESSING, VOL. 12, NO. 1, JANUARY 2003
generated. We must stress that we are not suggesting such processes happen in the visual system, we believe such reasoning makes “engineering” sense, i.e., it helps us in the development of useful systems as will be demonstrated in the rest of the paper. Based on these observations and reasoning, we propose a spatial frequency layered approach to image indexing. A schematic is illustrated in Fig. 1. be the impulse response of Let be the input image array, a bandpass filter (including the low-pass and high pass filters). Then the output of each bandpass filter is
TABLE I IMAGE RETRIEVAL PRECISION RESULTS,
Nc(k) MEASURE
(1) TABLE II IMAGE RETRIEVAL PRECISION RESULTS,
where denotes convolution. For each pixel position, the MAX selector will identify the filter that produces the largest output, which is used to form the frequency-classified images. Let be the th layer image corresponding to the th filter, then See (2) shown at the bottom of the page. Indexing is then performed on each layer to obtain the indexing feature vector, , for the image
P AND R MEASURES
(3) To summarize therefore, an image is first passed through a filter bank (each filter of the filter bank covers a specified spectral bandwidth). The output of the filter bank is used to classify the pixels. Pixels in an area with similar spatial frequencies are then retained on the same layer. Each individual layer, which contains only those pixels in areas with similar frequency distributions, is used to form its own index. The aggregation of the feature indices from all the layers then forms the overall index of the image. In this way, we have effectively classified the images according to the frequency contents of the image areas and indexed them separately. When such a strategy is used to match two images, the features from areas of similar spatial roughness are matched. That is, we will be matching flat area features and busy area features in one image to the corresponding features of another image. When simple image features such as color are used for indexing, such strategy should work very effectively. We introduce an implementation in next section. IV. AN ALGORITHM One of the consideration factors in our current work is efficiency. Although it is possible to introduce various features to index each layer, we present an efficient and very effective algorithm for the implementation of the scheme of the last section. The task involves two aspects. The first is how to implement the filter bank scheme, the second is how to index each layer. Filter bank is a well-studied area in image processing. However, we realize that the spectra classification can be implemented in a variety of ways. The essence is to classify pixels in areas with similar frequency characteristics into the same layer. We here present a simple nonfilter bank based spectral classification method. This is illustrated in Fig. 2. Notice that only the
if Otherwise
(black and white) component of the image is used in the classification process. This is because the sharpness of the image is mostly contained in this component. An image is low-pass filtered first by a Gaussian kernel. This low-passed version is then subtracted from the original image. The difference is then rectified (i.e., by taking the absolute values). Multiple thresholds are then applied. The binary images are obtained as (4) and the layers are formed as in (5) Otherwise
(4)
where Empty
if Otherwise.
(5)
Clearly, is a Laplacian image. The magnitude of the image indicates the sharpness of the image areas. A busy area, which contains many sharp changes will result in large differences between the original image and the Gaussian smoothed image. A flat area will result in small differences between the original and the Gaussian image. Therefore the pixel magnitude in the Laplacian is an indication of the roughness of the image area surrounding the pixel. The scheme therefore effectively classifies pixels in areas with similar roughness into the same layer. We can formally justify the scheme as well. For analysis convenience, we perform our analysis on 1-D signals. Let the and Gaussian filter’s impulse response be (6) The Laplacian image is (7)
(2)
QIU AND LAM: FREQUENCY LAYERED COLOR INDEXING FOR CONTENT-BASED IMAGE RETRIEVAL
109
Fig. 8. Example query images and their correct answers. The first image in each group were used as query and the rest used as the correct answers.
In the frequency domain, the spectral function of
is (8)
passing through a linear filter Equation (8) is equivalent to whose frequency response function is
Therefore, for sinusoidal inputs, the magnitude of the filter output is a function of the sinusoid’s frequency, we write such a relation as (12)
It is well known that sinusoidal inputs to a linear filter lead to sinusoidal outputs [22], we have
Equation (12) is a monotonically nondecreasing function of the input frequency. Fig. 3 plots this function. From (12) and Fig. 3, it is clear that the thresholding operation of (4) effectively classifies the input into frequency bands. Once we have classified pixels into different layers, we can use the simple color histogram [4] to index each layer. Let be the histogram of , then the indexing feature of image is expressed in (13) and we call (13) layered color indexing (LCI)
(11)
(13)
(9) Assuming the input signal is a sinusoid, i.e., (10)
110
IEEE TRANSACTIONS ON IMAGE PROCESSING, VOL. 12, NO. 1, JANUARY 2003
An explanation of (13) is in order. Instead of building one histogram, we are building multiple color histograms for an image, each taking colors from pixels in areas with similar sharpness. It is therefore immediate that (13) will be more powerful than the original simple color histogram. This approach not only indexes the color, but also associates colors with their surface roughness. As argued in the previous section, such an association not only has perceptual significance, it also makes sense physically. Fig. 4 shows some examples of image layers. Such representation will allow not only matching the entire contents of the image, but also allow different weightings to be given to different layers depending on the user’s requirements. For example in the first image in Fig. 4, if a user is more interested in retrieving Cheetahs, then more weighting can be given to the features of the last two layers and less weighting to the first two layers. Computationally, the scheme is very simple. The filtering and classification (thresholding) can be done very fast. The dimension of the color histogram does not have to be high. We implemented our experiments with four-layer and 64-color LCI (the indexing feature is a 256-dimensional vector, which has similar complexity to other state of the art methods, e.g., color correlogram [10]) and we have observed very good performances. We report detailed experiments in the next section. V. EXPERIMENTAL RESULTS To build the database, we used four layers and a 64-color quantizer to build the layered color indexing. Each image was therefore represented by a (4 64) 256-cell histogram. The Gaussian filter of Burt and Aldenson [13] was used (the coefficients were 0.05, 0.25, 0.4, 0.25, and 0.05). The threshold values were chosen empirically. However, we observed that the performance was not very sensitive to small variations of threshold values. To select the appropriate threshold values, we first collected statistics of a few hundred Laplacian images. Fig. 5 shows the accumulated histogram of these Laplacian images. We found the values were mostly concentrated in 0–18 interval. Although lower magnitude pixels in the Laplacian (corresponding to low spatial frequencies) have very large population, the classification should be based on visual significance rather than on pixel populations. Even though the population of high magnitude pixels (corresponding to high spatial frequencies) is lower than that of low magnitude ones, these higher frequency pixels are likely to have equal, if not greater visual significance than the low magnitude pixels. Therefore, one reasonable choice of the thresholds would be to slice the 0–18 range into equal intervals. The thresholds used , , , in the results below were . To compare the similarity of two histograms, a -norm relative distance metric [10] was used, which is , , defined as: let then the -norm relative distance between and is
Fig. 9. Average recall performances of the color correlogram method and the new LCI method.
A. The Database The database used in our experiment consisted of 20 000 color images from the commercially available Corel color photo collection. To evaluate the retrieval precision and recall performances, we have also collected three sets of testing data. The first set consisted of 328-pair similar images that were used to test retrieval precision. The second set consisted of 99 query images and for each query, there were three to 30 “relevant” or “correct” answers and this set was used to test the recall ability of the techniques. The sources of these two testing sets came from various places, some were photographed by us and some were from various sites on the Internet. The third query and answer set came from three categories in the Corel database itself and this was used to test category query ability of the techniques. B. Retrieval Precision In this experiment, we collected 328 query images, each had a unique answer. Some examples of the queries and corresponding answers are shown in Fig. 6. To measure the performance, we define several numerical measures similar to those used in [10]. be the th query image and be the unique correct anLet measure is defined as (15), which swer to the query. The measures how many queries retrieve the correct answers within indicates good perthe first returns. For small , a large indicate bad performance formance, a small (15) Similar to [4], we define an measure as (16). A lower rank return (better performance) contribute smaller amount to . A small indicates better performance (16)
(14) As a comparison, we have also implemented the (auto) color . The same correlogram (CC) [10] which has a 64 colors were used in all experiments. Therefore the complexity of the two methods was the same and the colors used were exactly the same.
measure as (17). A lower rank of the We further define a correct answer contributes more to the measure and therefore a larger value of indicates better performance (17)
QIU AND LAM: FREQUENCY LAYERED COLOR INDEXING FOR CONTENT-BASED IMAGE RETRIEVAL
Fig. 10.
111
Example images from the three categories in the Corel database. (a) Lions, (b) Tigers, and (c) Cheetah.
A method is good if it has small and large and for a . We also measured the average small , it has large and which were and divided by the number of queries.
The results of of our method and that of the color correlogram’s are shown in Table I. The results of and measures are shown in Table II. Based on the same color and the same
112
IEEE TRANSACTIONS ON IMAGE PROCESSING, VOL. 12, NO. 1, JANUARY 2003
(a)
(b)
(c)
(d)
Fig. 11. Category query performance. (a) Results on the Lion category. (b) Results on the Tiger category. (c) Results on the Cheetah category. (d) Aggregated result over all three categories. For the Tiger category, the two methods performed similarly, but for the other two categories, our new method gave better performance. Overall, our method performed better.
complexity, LCI clearly outperformed CC. Fig. 7 shows some example query images and their correct answers, also shown are the rank positions of the correct answers. For the vast majority of the queries, LCI gave much better performance. There were cases, however, CC gave better performances; such examples are also given in this figure. C. Recall Ability In this experiment, we collected 99 query images, each had a set of hand labeled “correct” answers. The number of correct answers for different queries ranged from three to 30. Some example queries and their correct answers are shown in Fig. 8. Let be the th query image and be the “correct” answers to the query . We define the following accumulated recall measures (18) is a weighted score of how many correct answers are returned in the first positions, accumulated over all queries. If there are more correct answers, the weighting is lower (propotional to the inverse of the number of correct answers). It is therefore a measure of recall performance. A higher value of indicates a better performance. A similar measure was used in [10], but instead of measuring each individual query (for a
small number of queries), we measure the accumulated performance for many queries, a fairer measure. Fig. 9 shows the recall performance of LCI and CC. It is seen that LCI performed better. D. Category Query The Corel image database we obtained was divided into many disks and many subdirectories. Under each directory were images of the same theme, which can be regarded as belonging to the same category. Although not all subdirectories could be meaningfully classified as containing similar images, we chose three subdirectories, each contained one type of animal against various backgrounds. The first one (105 000) contained 100 images, each of which contained one or more lions. The second one (108 000)contained 100 images, each of which contained one or more tigers. The third one (134 000)contained 100 images each of which contained one or more cheetahs. Examples of these images are shown in Fig. 10. We used every image from these three categories as query and the objective was to retrieve images belonging to the same category as the query. We used the recall measure of (18) to measure the performance. Therefore, for each query, we regarded the other 99 images belonging to the same category as the query as the “correct” answers. For each category, 100 queries were performed. The performances of the LCI and CC methods are shown in Fig. 11. Again, the overall performance of our method is better.
QIU AND LAM: FREQUENCY LAYERED COLOR INDEXING FOR CONTENT-BASED IMAGE RETRIEVAL
VI. CONCLUDING REMARKS In this paper, we have introduced a new method for color indexing. It can be considered as an extension to the classic color indexing. Based on human vision theories and digital signal analysis, we argued that image patches of different spatial frequencies would have different perceptual as well as physical significance. We incorporated such an argument into the development of an efficient image indexing scheme which has been shown to give excellent performance in content-based image retrieval. The method significantly enhances the power of color indexing but at the same time retains its simplicity and elegance. REFERENCES [1] A. W. M. Smeulders et al., “Content-based image retrieval at the end of the early years,” IEEE Trans. Pattern Anal. Machine Intell., vol. 22, pp. 1349–1380, Dec. 2000. [2] Y. Rui, T. S. Huang, and S.-F. Chang, “Image retrieval: Current techniques, promising directions and open issues,” J. Vis. Commun. Image Represent., vol. 10, pp. 39–63, 1999. [3] P. K. Kaiser and R. M. Boynton, “Human Color Vision,” Opt. Soc. Amer., Washington, DC, 1996. [4] M. Swain and D. Ballard, “Color indexing,” Int. J. Comput. Vis., vol. 7, pp. 11–32, 1991. [5] K. Hirata and T. Kato, Rough Sketch-Based Image Information Retrieval: NEC Res. Develop., 1992, vol. 34, pp. 263–273. [6] W. Hsu, T. S. Chua, and H. K. Pung, “An integrated color-spatial approach to content-based image retrieval,” in Proc. 1995 ACM Multimedia Conf., pp. 305–313. [7] C. Carson et al., “Blobworld,: A system for region-based image indexing and retrieval,” in Proc. Int. Conf. Visual Information Systems, 1999. [8] G. Pass and R. Zabih, “Histogram refinement for content-based image retrieval,” in Proc. IEEE Workshop on Applications of Computer Vision, 1996, pp. 96–102. [9] “MPEG7 FCD,” Singapore, ISO/IEC JTC1/SC29/WG11, 2001. [10] J. Huang et al., “Spatial color indexing and applications,” Int. J. Comput. Vis., pp. 245–268, 1999. [11] G. Qiu et al., “A binary color vision framework for content-based image indexing,” in Recent Advances in Visual Information Systems, S-K Chang et al., Eds. New York: Springer, 2002, vol. LNCS 2314, pp. 50–60. [12] A. Mojsilovic et al., “Matching and retrieval based on the vocabulary and grammar of color patterns,” IEEE Trans. Image Processing, vol. 9, pp. 38–54, Jan. 2000. [13] P. J. Burt and E. H. Adelson, “The Laplacian pyramid as a compact image code,” IEEE Trans. Commun., vol. COM-31, pp. 532–540, 1983. [14] F. W. Campbell and J. G. Robson, “Application of Fourier analysis to the visibility of gratings,” J. Physiol., vol. 197, pp. 551–566, 1968. [15] C. B. Blakemore and F. W. Campbell, “On the existence of neurones in the human visual system selectively sensitive to the orientation and size of retinal images,” J. Psychol., vol. 204, pp. 237–260, 1969. [16] F. W. Campbell, G. F. Cooper, and C. Enroth-Cugell, “The spatial selectivity PF the visual cells of the cat,” J. Physiol., vol. 203, pp. 223–235, 1969. [17] C. B. Blakemore, J. Nachmias, and P. Sutton, “The perceived spatial frequency shift: Evidence for frequency-selective neurones in the human brain,” J. Physiol., vol. 210, pp. 727–750, 1970. [18] R. L. De Valois, D. G. Albrecht, and L. G. Thorell, “Spatial frequency selectiveity of cells in Macaque visual cortex,” Vis. Res., vol. 22, pp. 545–559, 1982. [19] K. T. Mullen and F. A. A. Kingdom, “Color contrast in form perception,” in The Perception of Color, P. Gouras, Ed. New York: Macmillan, 1991. [20] Y. Rui et al., “Relevance feedback: A power tool for interactive contentbased image retrieval,” IEEE Trans. Circuits, Syst., Video Technol., pp. 644–655, Sept. 1998. [21] A. N. Akansu and R. A. Haddad, Multiresolution Signal Decomposition. New York: Academic, 1992.
113
[22] R. Roberts and C. Mullis, Digital Signal Processing. Reading, MA: Addison-Wesley, 1987. [23] M. Jenkins and L. Harris, Computational and Psychophysical Mechanisms of Visual Coding. Cambridge, U.K.: Cambridge Univ. Press, 1997.
Guoping Qiu received the B.Sc. degree in electronic measurement and instrumentation from the University of Electronic Science and Technology of China, Chendu, in July 1984 and the Ph.D. degree in electrical and electronic engineering from the University of Central Lancashire, Preston, U.K., in 1993. He is currently a Lecturer of computer science at the School of Computer Science and IT, University of Nottingham, Nottingham, U.K. Before joining Nottingham in October 2000, he was a Lecturer at the School of Computing, the University of Leeds, U.K and the School of Computing and Mathematics, the University of Derby, U.K. His general research interests are image and signal analysis and processing algorithms for visual computing, including image database, content-based image and video retrieval; filtering theory and practice for image enhancement, superresolution and high dynamic imaging, and visual object recognition.
Kin-Man Lam received his the Associateship in electronic engineering with distinction from the Hong Kong Polytechnic University (formerly Hong Kong Polytechnic) in 1986. He won the S.L. Poa Scholarship for overseas studies and received the M.Sc. degree in communication engineering from the Department of Electrical Engineering, Imperial College of Science, Technology, and Medicine, U.K., in 1987. In 1993, he undertook a Ph.D. degree program in the Department of Electrical Engineering at the University of Sydney, Australia, and won an Australia Postgraduate Award for his studies. He received the Ph.D. degree in August 1996 and was awarded the IBM Australia Research Student Project Prize. He joined TechTrend E. & C., Ltd., as an Application Engineer working on micro-supercomputers in 1987. From 1990 to 1993, he was a Lecturer at the Department of Electronic Engineering of the Hong Kong Polytechnic University teaching various subjects on computer architecture and parallel processing. In October 1996, he was appointed as an Assistant Professor at The Hong Kong Polytechnic University. He became Associate Professor in February 1999. He was also the Secretary of the Hong Kong Special Session for the China 14th National Conference on Circuits and Systems, which was held in Fuzhou, China, in April 1998 and the Secretary of the 2001 International Symposium on Intelligent Multimedia, Video, and Speech Processing organized by the Centre for Multimedia Signal Processing, Hong Kong Polytechnic. He was also a Program Committee Member and Session Chair of the 2002 Conference on Visual Communications and Image Processing, which was held in San Jose, CA, in January 2002. He was a Guest Editor for a Special Issue on Biometric Signals for the EURASIP Journal on Applied Signal Processing in 2002. Dr. Lam was selected as the “best teacher” of the 1997/1998 academic year in the Department of Electronic Engineering. He is the Secretary of the IEEE Hong Kong Chapter of Signal Processing, the Secretary of the 2003 IEEE International Conference on Acoustics, Speech, and Signal Processing (ICASSP’03) to be held in Hong Kong and the Principal Member of Technical Programs of the 2002 7th International Conference on Control, Automation, Robotics and Vision (ICARCV 2002) to be held Singapore. His current research interests video processing, computer vision and architecture, digital TV and pattern recognition.He was also actively involved in professional activities between 1987 and 1993; in particular, he was the Secretary and publication secretary of several international conferences and the Secretary of the IEEE Hong Kong Chapter of Signal Processing between 1992 and 1993. He was Session Chairman and member of the Technical Program Committee of the IEEE Symposium on Circuits and Systems (ISCAS’97), which was held in Hong Kong in June 1997.