Muggerud et al. Breast Cancer Research 2010, 12:R3 http://breast-cancer-research.com/content/12/1/R3
RESEARCH ARTICLE
Open Access
Frequent aberrant DNA methylation of ABCB1, FOXC1, PPP2R2B and PTEN in ductal carcinoma in situ and early invasive breast cancer Research article
Aslaug Aa Muggerud†1,2, Jo Anders Rønneberg†1,2, Fredrik Wärnberg3, Johan Botling4, Florence Busato9, Jovana Jovanovic5, Hiroko Solvang1,10, Ida Bukholm6, Anne-Lise Børresen-Dale1,2, Vessela N Kristensen*1,5,7, Therese Sørlie1,8 and Jörg Tost9
Abstract Introduction: Ductal carcinoma in situ (DCIS) is a non-invasive lesion of the breast that is frequently detected by mammography and subsequently removed by surgery. However, it is estimated that about half of the detected lesions would never have progressed into invasive cancer. Identifying DCIS and invasive cancer specific epigenetic lesions and understanding how these epigenetic changes are involved in triggering tumour progression is important for a better understanding of which lesions are at risk of becoming invasive. Methods: Quantitative DNA methylation analysis of ABCB1, CDKN2A/p16INK4a, ESR1, FOXC1, GSTP1, IGF2, MGMT, MLH1, PPP2R2B, PTEN and RASSF1A was performed by pyrosequencing in a series of 27 pure DCIS, 28 small invasive ductal carcinomas (IDCs), 34 IDCs with a DCIS component and 5 normal breast tissue samples. FOXC1, ABCB1, PPP2R2B and PTEN were analyzed in 23 additional normal breast tissue samples. Real-Time PCR expression analysis was performed for FOXC1. Results: Aberrant DNA methylation was observed in all three diagnosis groups for the following genes: ABCB1, FOXC1, GSTP1, MGMT, MLH1, PPP2R2B, PTEN and RASSF1A. For most of these genes, methylation was already present at the DCIS level with the same frequency as within IDCs. For FOXC1 significant differences in methylation levels were observed between normal breast tissue and invasive tumours (P < 0.001). The average DNA methylation levels were significantly higher in the pure IDCs and IDCs with DCIS compared to pure DCIS (P = 0.007 and P = 0.001, respectively). Real-time PCR analysis of FOXC1 expression from 25 DCIS, 23 IDCs and 28 normal tissue samples showed lower gene expression levels of FOXC1 in both methylated and unmethylated tumours compared to normal tissue (P < 0.001). DNA methylation levels of FOXC1, GSTP1, ABCB1 and RASSF1A were higher in oestrogen receptor (ER) positive vs. ER negative tumours; whereas methylation levels of FOXC1, ABCB1, PPP2R2B and PTEN were lower in tumours with a TP53 mutation. Conclusions: Quantitative methylation analysis identified ABCB1, FOXC1, PPP2R2B and PTEN as novel genes to be methylated in DCIS. In particular, FOXC1 showed a significant increase in the methylation frequency in invasive tumours. Low FOXC1 gene expression in both methylated and unmethylated DCIS and IDCs indicates that the loss of its expression is an early event during breast cancer progression. Introduction The multistep model of breast cancer progression suggests a transition from normal epithelium to invasive carcinoma via intraductal hyperplasia and in situ carcinoma * Correspondence:
[email protected] † 1
Contributed equally Department of Genetics, Institute for Cancer Research, Oslo University
Hospital Radiumhospitalet, Montebello, Oslo, N-0310, Norway
[1]. These presumptive precursor lesions are currently defined by their histological features. Ductal carcinoma in situ (DCIS) is a pre-invasive lesion with diverse histological morphologies and molecular alterations [2]. The risk of DCIS progressing to invasive carcinoma is not well ascertained and robust biomarkers capable of stratifying the most aggressive from the more benign forms of the disease are currently lacking.
© 2010 Muggerud et al.; licensee BioMed Central Ltd. This is an open access article distributed under the terms of the Creative Commons Attribution License (http://creativecommons.org/licenses/by/2.0), which permits unrestricted use, distribution, and reproduction in any medium, provided the original work is properly cited.
Muggerud et al. Breast Cancer Research 2010, 12:R3 http://breast-cancer-research.com/content/12/1/R3
Page 2 of 10
Cancer progression is due to the accumulation of genomic alterations leading to oncogene overexpression and tumour suppressor loss inducing growth advantage and clonal expansion. The transition of DCIS to invasive ductal cancer (IDC) is a poorly understood key event in breast tumour progression. Copy number alterations are already present in DCIS but their frequency tends to increase in IDCs [3]. Such genomic aberrations lead to altered gene expression, and comprehensive gene expression studies comparing DCIS and IDCs have identified stage-specific markers ([4-6] and Muggerud et al., submitted) along with a gene expression classifier which differed between DCIS and invasive breast cancer [7]. On the other hand, the frequency of TP53 mutations in DCIS is similar to what is observed in invasive tumours and in situ and invasive components from the same tumour exhibit the same mutations, indicating the same cellular origin of the two components [8-10]. Epigenetic changes are considered to be an early event during tumour development and one of the hallmarks of cancer [11]. Hypermethylation of CpG islands represents
an alternative mechanism to inactivate tumour suppressor genes and is a prevalent early molecular marker for cancer. Specific patterns of CpG island methylation could result from clonal selection of cells having growth advantages due to silencing of associated tumour suppressor genes, DNA repair genes, cell-cycle regulators and transcription factors. Previous candidate gene studies investigated promoter hypermethylation of in situ lesions and identified aberrant methylation at the promoters of GSTP1, CyclinD2, RARB2, Twist, RASSF1A, HIN-1, CDKN2A, 14-3-3σ and APC1 [12-17]. However, only GSTP1 promoter hypermethylation was reported to progress in frequency during breast carcinogenesis [12]. Identification of early epigenetic changes in DCIS lesions might give valuable markers for early detection and may contribute to the understanding of how these changes affect the progression of the disease. The aim of this study was to identify informative progression markers by methylation analyses of eleven genes known to be methylated in breast tumours or breast cancer cell lines; ABCB1 [18], CDKN2A/p16INK4a [19], ESR1 [20], GSTP1
Table 1: Clinicopathological factors No. DCIS
Diagnosis
No. Invasive
No. Mixed
27
28
34
Positive
19
23
24
Negative
8
4
8
Positive
20
21
20
Negative
7
6
12
22
23
24
5
4
8
Positive
6
6
14
Negative
21
22
20
Grade A/I (DCIS/invasive)
1
13
3/8
Grade B/II (DCIS/invasive)
13
10
8/17
Grade C/III (DCIS/invasive)
12
4
15/7
Oestrogen receptor status
Progesterone receptor status
TP53 mutations Wild type Mutant
Ki67
Grade, I to III and/or A to C
Muggerud et al. Breast Cancer Research 2010, 12:R3 http://breast-cancer-research.com/content/12/1/R3
[21], IGF2 [22], MGMT [19], MLH1 [19], PPP2R2B [23], PTEN [24], RASSF1A [25] or displaying variation in breast cancer sub-type gene expression profiles; FOXC1. In a series of 27 DCIS, 28 IDCs, 34 mixed cases (invasive tumours with in situ components) and 28 normal tissues we show that methylation of CpG islands is already detectable in DCIS with the same frequency as within IDCs.
Materials and methods Patient material
Patients with fresh frozen tumour samples, collected at the Fresh Tissue Biobank at the Department of Pathology, Uppsala University Hospital, Sweden, were selected from a population-based cohort of 854 women diagnosed between 1986 and 2004, with either one of three types of primary breast cancer lesions; a) pure DCIS, b) pure invasive breast cancer, 15 mm or less, or c) mixed lesions (invasive carcinoma with an in situ component). All histopathological specimens, both paraffin embedded (used in IHC analyses) and frozen (used in methylation and quantitative real-time polymerase chain reaction (qRT PCR) analyses), were re-evaluated by a breast pathologist. Seventy-seven percent of the pure DCIS samples have a DCIS component of >70%. Seventy-six percent of the invasive samples have a tumour content of >70%, while 79% of the mixed samples have a tumour/DCIS component of >70%. DCIS lesions were classified according to the European Organisation for Research and Treatment of Cancer (EORTC) classification system [26]. We denoted the grades A to C (corresponding to grades I to III) to make clear that in situ and invasive lesions were classified based on different systems. Invasive breast cancers were classified based on the Elston-Ellis classification system, grades I to III [27]. Twenty-eight samples of normal breast epithelium were collected at the Akershus University Hospital from women undergoing a biopsy for the suspicion of malignant disease but without any histological findings. Five of the normal samples had enough DNA to be used in the methylation analyses of all genes in all patients. Twenty-three additional normal tissues were included in the methylation analysis of FOXC1, ABCB1, PPP2R2B and PTEN and qRT-PCR analyses of FOXC1. All patients signed a written consent to participate in the study, which has been approved by the regional ethical committee. Clinicopathological details of lesions are given in Table 1. This study was designed to investigate differences in CpG methylation events between different diagnostic groups with a particular emphasis on identifying specific markers related to tumour progression from in situ to invasive cancer. We would like to emphasise that this study was not designed to study prognosis. For example, none of the DCIS patients died from breast cancer and only three experi-
Page 3 of 10
enced a local recurrence. Also, the patients were treated differently according to tumour characteristics. Hence, no follow-up data can be presented. The study was approved by the Ethics Committee at Uppsala University Hospital (Dnr 2005:118). Clinical endpoints
The entire coding sequence of the TP53 gene (exon 2-11) was analyzed for mutations by sequencing using the 3730 DNA Analyzer (Applied Biosystems, Foster City, California, USA) [10]. Immunohistochemical staining (IHC) of paraffin embedded material was performed for the oestrogen receptor (ER), progesterone receptor (PR) and a proliferation marker (Ki-67). A cut-off limit for positive staining was chosen for ER >10% (ER 6F11, Novocastra, Newcastle, UK), PR >10% (PR 1A6, Novocastra) and Ki67 >10% (Ki-67 MIB-1, DAKO A/S, Glostrup, Denmark) stained tumour cells, irrespective of the intensity of the staining. Staining was performed in an automatic staining machine (Ventana Medical Systems, Tucson, AZ, USA). Pyrosequencing
A total of 1 μg of DNA was bisulphite converted using the MethylEasy™ HT Kit for Centrifuge (Human Genetic Signatures, North Ryde, New South Wales, Australia) according to the manufacturer's instructions. Quantitative DNA methylation analysis of the bisulphite treated DNA was performed by pyrosequencing or, in case of several sequencing primers, by serial pyrosequencing [28]. Oligonucleotides for PCR amplification and pyrosequencing were synthesized by Biotez (Buch, Germany) and sequences are given in Additional file 1. Quantitative DNA methylation analysis was carried out on a PSQ 96 MD system with the PyroGold SQA Reagent Kit (Pyrosequencing, Biotage, Uppsala, Sweden) and results were analyzed using the Q-CpG software (V.1.0.9, Pyrosequencing AB). Unmethylated commercial DNA (Qiagen, Valencia, CA, USA) and mixed human lymphocyte DNA (Promega, Madison, WI, USA) was analyzed in parallel to define the technical background. CpG-values for tumour and normal tissue samples are given in Additional file 2. Pyrograms for FOXC1 in six tumour samples and three normal tissue samples are given in Additional file 3. cDNA synthesis and real-time PCR analysis
qRT-PCR was performed on 25 DCIS, 23 pure invasive carcinomas from the same cohort and 28 normal tissues. cDNA was synthesized in a total volume of 20 μl with 100 ng total RNA using the High Capacity cDNA Reverse Transcription kit (Applied Biosystems,) and used as template for real-time PCR analysis with the TaqMan Gene Expression Assay for FOXC1 (Hs00559473_s1, Applied Biosystems,) on an ABI Prism 7900HT sequence detector system (Applied Biosystems). Universal human reference
Muggerud et al. Breast Cancer Research 2010, 12:R3 http://breast-cancer-research.com/content/12/1/R3
Page 4 of 10
because the expression of this gene was not statistically significant different across the patient groups [29,30] Statistics
The average value of methylation for all CpGs in a target region was calculated for each sample and each gene. A sample was scored as aberrantly hypermethylated if the measured methylation values were two times above the standard deviation of the average of the normal controls, and conversely, as hypomethylated if methylation values were below two times the standard deviation of the average of the normal control tissues. Differences in the degree of methylation were determined by two-sided non-parametric Mann-Whitney test for two-categorical clinicopathological factors and Kruskal-Wallis test for three-categorical clinicopathological factors. The P-values were obtained by permutation procedure without any assumption on specific distribution. Correlations between concomitant methylated genes were calculated using Spearman's test. All tests were performed using the Statistical Package for Science version 15.0. For all obtained p-values, the false discovery rate (FDR) was assessed using Benjamini and Hochberg [31] in the Bioconductor multitest package [32].
Results CpG promoter methylation patterns across three breast cancer diagnosis groups
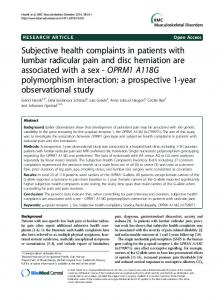
Methylation overview Figure 1 Methylation overview. A: Bar chart displaying promoter methylation frequencies across the three diagnosis groups. Methylation frequency is defined as the number of methylated samples within each category. The average values of methylation for all CpGs were calculated for each sample and each gene. A sample was scored as hypermethylated if the measured methylation values were two times above the standard deviation of the mean of the normal controls, and conversely, as hypomethylated if methylation values were below two times the standard deviation of the mean of the normal control tissues. DCIS = light grey, pure invasive = dark grey, and mixed = black. B: Methylation overview per gene across the three diagnosis groups. Black boxes indicate methylated and white boxes indicate unmethylated samples. For the imprinted gene IGF2; white boxes indicate the expected allele-specific methylation, black boxes indicate hypermethylation, and grey boxes indicate hypomethylation.
RNA (Stratagene, La Jolla, CA, USA) was used to generate standard curves. Each sample was run in triplicate. Relative gene expression levels were determined using the standard curve method and normalized to the reference gene PGK1. PGK1 was selected as a reference gene
The results of the pyrosequencing analysis of 27 DCIS, 28 invasive tumours and 34 mixed tumours, are illustrated in Figure 1A and 1B. All patient samples in all three groups displayed widespread aberrant CpG island methylation in the analyzed gene set. Aberrant DNA methylation (defined as an increase of average methylation levels beyond the average ± two times the standard deviation observed in the group of normal tissues) was observed in all three diagnosis groups for the following genes (frequency; % of DCIS vs. invasive vs. mixed): ABCB1 (40.7% vs. 39.3% vs. 44.1%), FOXC1 (22.2% vs. 53.6% vs. 67.6%), GSTP1 (22.2% vs. 14.3% vs. 26.5%), MGMT (3.7% vs. 3.6% vs. 5.9%), MLH1 (7.4% vs. 3.6% vs. 2.9%), PPP2R2B (55.0% vs. 78.6% vs. 70.6%), CDKN2A/p16INK4a (0% vs. 10.7% vs. 5.9%), PTEN (18.5% vs. 14.3% vs. 23.5%) and RASSF1A (85.2% vs. 82.1% vs. 85.3%). Methylation of ABCB1, FOXC1, PTEN and PPP2R2B in DCIS is reported here for the first time (Figure 2). To rule out any artefact due to inter-individual variation in ABCB1, FOXC1, PTEN and PPP2R2B methylation patterns in normal tissue and to confirm the presence of DNA methylation to be a tumour specific event, we analyzed the methylation patterns in 23 additional normal tissues without histopathological findings, confirming the initial findings of an absence of DNA methylation around the transcription start site of these genes in normal breast tissue (Figures 2 and 3A). Overall,
Muggerud et al. Breast Cancer Research 2010, 12:R3 http://breast-cancer-research.com/content/12/1/R3
Page 5 of 10
(chr 6p) showed significant correlations to RASSF1A (chr 3p), PPP2R2B (chr 5q), ABCB1 (chr 7q) and GSTP1 (chr 11q) (P = 7.6*10-4 and R2 = 0.34, P = 3.6*10-5 and R2 = 0.41, P = 4.5*10-6 and R2 = 0.46, P = 1.5*10-4 and R2 = 0.38, respectively). In addition methylation at PTEN (chr 10q) was significantly correlated to ABCB1 (chr 7q) and PPP2R2B (chr 5q) methylation (P = 1.4*10-6, R2 = 0.48 and P = 1.0*10-6, R2 = 0.60, respectively). All P-values were obtained with a false discovery rate