Journal of Petroleum and Gas Engineering Vol. 3(3), pp. 41-50, March 2012 Available online at http://www.academicjournals.org/JPGE DOI: 10.5897/JPGE11.032 ISSN 2141-2677 ©2012 Academic Journals
Full Length Research Paper
Corrosion-erosion on waste heat recovery boiler system via blowdown optimization Zainal Zakaria* and Nor Ismail Hashim Department of Gas Engineering, Faculty of Petroleum and Renewable Energy Engineering, Universiti Teknologi Malaysia, 81310 Johor Baru, Johor, Malaysia. Accepted 3 January, 2012
It is estimated that problems due to corrosion-erosion of boiler system cost industries billions of dollars per year. Method of corrosion-erosion control varies depending upon the type of problem encountered. This study is focused on the optimization of the boiler blowdown frequency and its effect on the chemical values of the water-steam cycle. Parameters such as conductivity, iron and silica concentrations were closely monitored via on-line monitoring devices. The conductivity in the boiler water and steam cycle was between 0.3 to 0.6 uS/cm and 0.1 to 0.15 uS/cm, respectively. The average iron concentration in the water cycle was less than 0.01 ppm and in the steam cycle the average reading was less than 0.005 ppm and the average of silica concentration in the boiler fluctuated between 0.02 to 0.08 ppm. Key words: Boiler, conductivity, corrosion, heat recovery, iron.
INTRODUCTION In a waste heat recovery boiler system, heat of the combustion gases from the gas turbine exhaust is used to produce steam to drive a steam turbine and to heat up the main condensate. The combustion gases from the gas turbine exhaust first flows horizontally through an exhaust gas diffuser, the diverter damper and the exhaust gas duct before deflect at the boiler inlet. Then, the exhaust gas flows through the vertical part of the boiler which houses the heating surfaces which is fabricated from the finned tubes. Effective corrosion control monitoring is essential in ensuring the efficiency and trouble-free operation of boiler (Jiamin and Zhansong, 2009; Klien and Rice, 2000; Otsuka, 2002; Sandberg et al., 2011; Smiyan et al., 2002; Srikanth et al., 2003). Appropriate corrosion-erosion monitoring techniques vary with different system and the testing should be performed at least once per shift. When the control system is difficult or during periods of more variables operating conditions, increasing the testing frequencies should be considered. All monitoring data either spot sampling or continuous, should be recorded. Boiler feed water hardness
*Corresponding author. E-mail:
[email protected]. Tel: +60197515410. Fax: +6075581463.
(magnesium), oxygen, iron and pH should be measured as well (Sandberg et al., 2011). Iron and oxygen can be measured on a daily basis by installing continuous oxygen meter in a feed water system to detect oxygen intrusions. Iron should be measured with care to avoid sample contamination. However, the corrosion process is a complex electro chemical reaction. It takes many forms and may produce general attack over a large metal surface or by pinpoint penetration of metal. Corrosion is a significant problem caused by water in boilers. The whole boiler system is generally vulnerable to corrosion caused by oxygen, which mainly occurs in the form of pitting. However, other factors such as acid conditions, stresses and specific chemical corrodents also play an important influence and caused different forms of attack. Thus, it is necessary to control the allowable quantity of the various harmful substances in the boiler water without jeopardizing the boiler (Otsuka, 2002). Corrosion may occur in the feed water system as a result of low pH water and the water impurities. Corrosion can cause serious problems in feedwater and boiler system. The corrosive action will waste the metal away and reduced its overall strength of metal thus leading to eventual failure (Jiamin and Zhansong, 2009). When the corrosion occurs, metals obtained from the
42
J. Petroleum Gas Eng.
corresponding metallic oxide tend to revert to their original state. Some of these metallic oxides will then form a stable coating which adheres firmly to the surface of the parent metal protecting it from further attack. However, other oxides form coatings which are either porous or unstable and can break down easily. For example, a special form of iron oxide known as magnetite can form in boilers. This provides a protective film on the metal but in the presence of oxygen breaks down to form ferric oxide which is porous and did not provide protection. In the boiler, the presence of water in an acidic condition provides the electrolyte required for corrosive action. The water can become acidic due to the presence of various dissolved gases, such as oxygen and carbon dioxide, or various dissolved metallic salts, such as magnesium chloride. Direct chemical attack can occur when metals at high temperature come into contact with the air or other gases resulting in oxidation or sulphidation of the metal. Electrochemical corrosion usually takes place in the presence of moisture and a formation of corrosion cell with cathodic and anodic areas in the presence of an electrolyte, resulting in corrosion of the anode. This form of corrosion covers most of the corrosion that takes place in boiler system. In this group, there are two main forms of corrosion, the general wastage and the pitting (Jiamin and Zhansong, 2009). Other form of electrolyte corrosion which would be a combination of electrolytic and mechanical or chemical attacks are corrosion fatigue, acid corrosion and caustic corrosion which is sometimes known as caustic gouging, caustic attack or ductile gouging (Khajavi et al., 2007; Srikanth et al., 2003). The ASME Consensus for Industrial Boilers specifies that feedwater oxygen, iron and copper content should be very low (for example, < 7 ppb oxygen, 20 ppb iron and 15 ppb copper for a 900 psig boiler) and the pH should be maintained between 8.5 and 9.5 for system corrosion protection (Klien and Rice, 2000). In order to minimize boiler system corrosion, an understanding of the operational requirements for all critical system components is necessary (Smiyan et al., 2002). Without proper mechanical and chemical deaeration, oxygen in the feedwater will enter the boiler. Much is flashed off with the steam but the remainders can attack the boiler metal. The point of attack varies with boiler design and feedwater distribution. Pitting corrosion is a localized form of corrosion which takes place in the passive state of the metal and is frequently visible in the feedwater distributor, at the steam drum waterline and in the downcomers tubes (Kritzer, 2004). Oxygen is highly corrosive when present in hot water and significantly more corrosive than carbon dioxide (Klien and Rice, 2000; Ahmad, 2006 ) as dissolved oxygen is six times more corrosive than a molar equivalent concentration of carbon dioxide in pure water at 65°C (Ahmad, 2006). Thus, even small concentrations can cause serious problems. Due to pits that can penetrate deep into metal, oxygen corrosion can result in rapid failure of feedwater
lines, boiler tubes, economizers and condensate lines. Additionally, iron oxide generated by the corrosion can produce iron deposits in the boiler. The acceptable dissolved oxygen level for any system depends on many factors, such as flow rate, feedwater temperature, pH, dissolved solids contents and the metallurgy and physical condition of the system (Smiyan et al., 2002). Based on experience, 3 to 10 ppb of feedwater oxygen is not significantly damaging the economizers. Corrosion-erosion is defined as the acceleration or increase in rate of deterioration or attack on a metal because of relative movement between a corrosive fluid and the metal surface. Generally, the movement is quite rapid and mechanical ware effects or abrasions are involved. Metals removed forms at the surface as dissolved ions, or forms solid corrosion products that are mechanically swept form the metal surface. In many cases, failures caused by erosion occur in a relatively short time and they are unexpected large because evaluation corrosion test were run under static condition (Sidhu and Prakash, 2006; Uusitalo et al., 2004). Velocity often strongly influences the mechanisms of the corrosion reactions. It exhibits mechanical ware effect at high values and particularly when the solution contains solids in suspension. Increase in velocity generally results in increased attack, particularly if substantial rate of flow is involved (Sandberg et al., 2011). Erosion-corrosion failures also can occur due to turbulence flow condition. Turbulence results in greater agitation of the liquid at metal surface than in a case of laminar flow and in more intimate contact between the environment and the metal. The type of flow obtained depends on the rate and quantity of fluid handled and also the design of the equipment. In addition to high velocities, crevices, deposit, ledges, sharp changes in cross sections and other obstructions that disturb the laminar flow pattern may result in erosioncorrosion (Sidhu and Prakash, 2006). The objective of this study is to monitor the effect of the chemical values such as the conductivity, iron and silica concentration in the heat recovery boiler circuit. METHODOLOGY The study on the optimization of the boiler blowdown frequency was conducted on 2 boilers. The test was carried out in 2 different stages, that is, Stage 1, which did not involve any blowdown and Stage 2, which involved blowdown activities.
Stage 1 In order to achieve a stable chemical condition, a 3 h of boiler blowdown was carried out for each boiler prior to the test. The boilers were operated at base load condition and did not involve in any start-up or shutdown during the test period of 20 days. This will minimize the variation in the operating parameters such as steam pressure, temperature and flow rates. Since no shutdown was planned for the boiler, the blowdown valves were kept closed throughout the test period. Important chemical parameters such as conductivity, Iron and Silica concentration in the water and steam
Zakaria and Hashim
43
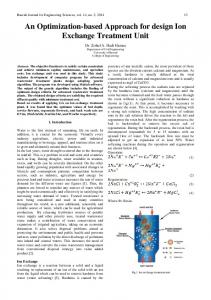
Figure 1. On-line sampling station.
cycle were closely monitored and daily recorded in the monitoring sheet.
Stage 2 The boilers were operated at base load operation and involved in startup and shutdown. Boiler blowdown was carried out for 3 h for every startup. Important chemical parameters conductivity, Iron and Silica concentration in the water and steam cycle were closely monitored and daily recorded in the monitoring sheet. In addition, laboratory analysis on dissolved solids such as Calcium, Magnesium, Iron, Silica, Sodium, Sulphates and Chlorides were also recorded. The monitoring of the important values for water-steam cycle is done by continuous on-line measurement and analysis in the sampling station as shown in Figure 1.
Conductivity analysis The specific conductance of boiler water provides an indirect measure of dissolved solids. Figures 2 and 3 show the conductivity trend for water and steam cycle respectively. The limit for the boiler water conductivity was less than 3 uS/cm. From the trend, it shows that the boiler water conductivity for both boilers has gradually reduced by 0.2 to 0.4 uS/cm and stabilized around 0.35 uS/cm despite not doing any blowdown. The conductivity for the steam side also shows a reduction as well. The conductivity values of the steam for both boilers have gradually reduced and stabilized at 0.1 uS/cm from 0.15 uS/cm. The limit for the steam conductivity was less than 0.2 uS/cm.
RESULTS AND DISCUSSION Total Iron analysis Method of corrosion-erosion control varies depending upon the type of problem encountered. The high flow rate during blowdown caused frequent erosion on the control valves as well as, the boiler internal tubes. The readings were recorded and compared with the limits and specification proposed by the manufacturer, Babcock and Wilcox. Stage 1 test (Without blowdown) The following parameters were recorded and analyzed during the test period of 20 days. During this period, the boilers were running at base load operation without any blowdown operation. Theoretically, evaporation in a boiler caused impurities such as dissolved and suspended solids to concentrate. Corrosion beneath certain types of boiler deposits can weaken the metal and tube failure may occur after certain period of time.
The limit of iron concentration in main condensate and feedwater was less than 20 ppb and for the boiler water, the limit was less than 100 ppb. For the steam system, the limit was below 20 ppb as well. Figures 4 and 5 show the total iron in the water cycle and steam cycle, respectively. The total iron content in the water cycle went slightly up to a maximum of 40 ppb for the boiler water. However, all the values were still below the permissible concentration limits of 100 ppb. From the trends, the iron remained non-detectable in the main condensate and feedwater. Silica analysis A high Silica deposit is very hard resembling porcelain. The crystals of Silica were extremely small foaming a very dense, impervious scale. The limit of Silica
44
J. Petroleum Gas Eng.
Conductivity Trend For Water Cycle - Without Blow Down 1
Startup on 11 Sept, 6hrs b/down 11&12 HRB
Conductivity in micro S/cm
0.8
0.6
0.4
0.2
0 11-Sep
13-Sep
15-Sep
17-Sep
19-Sep
21-Sep
23-Sep
25-Sep
27-Sep
29-Sep
1-Oct
Date 11BW
12BW
W
W
MCOND
Limit : Boiler Water Conductivity < 3 micro S/cm Main Cond Conductivity < 0.2 micro S/cm
Conductivity Trend boiler For Steam Cycle - Without Blow Down Figure 2. Conductivity profile for water cycle without blowdown.
0.25
0.15
0.1
0.05 S/cm
Conductivity in micro S/cm
0.2
0 11-Sep
13-Sep
15-Sep
17-Sep
19-Sep
21-Sep
23-Sep
25-Sep
27-Sep
29-Sep
1-Oct
Date
Limit : Steam Conductivity < 0.2 micro S/cm 11SAT
12SAT
11SUP
12SUP
Figure 3. Conductivity profile for steam cycle without boiler blowdown.
concentration in main condensate, feed water and steam system was less than 0.02 ppm. For the boiler water, the limit was less than 0.5 ppm. Figures 6 and 7 show the
Silica concentration in the water and steam cycle respectively. From the trend, it was observed that the Silica concentration in the boiler water fluctuated between
Zakaria and Hashim
45
Total Iron (Fe) Concentration In Water Cycle - Without Blow Down 0.08 0.07 Iron (Fe) in ppm
0.06 0.05 0.04 0.03 0.02 0.01 0 11-Sep
14-Sep
17-Sep
20-Sep
23-Sep
26-Sep
29-Sep
Date 11BW
12BW
MCOND
FWT
Total Iron (Fe) Concentration in Steam Cycle - Without Blow Down Figure 4. Total Iron (Fe) concentrations in water cycle without boiler blow down.
Iron (Fe) in ppm
0.02 0.015 0.01 0.005 0 11-Sep
14-Sep
17-Sep
20-Sep
23-Sep
26-Sep
29-Sep
Date 11SAT
12SAT
11SUP
12SUP
Figure 5. Total Iron (Fe) concentrations in steam cycle without boiler blow down.
0.02 to 0.05 ppm. Silica concentration in boiler water shows a slight increase. However, this value is still far below the limit. The silica concentration in the steam cycle remained constant at 0.01 ppm throughout the test. The observation on the conductivity, iron and silica concentrations has proven that the chemical
concentration in the boiler can still be maintained below the allowable limit even without being blowdown for 20 days. In general, based on the trends and monitoring sheets, it can be clearly monitored that all chemical parameters remain below their specified limits throughout the test.
46
J. Petroleum Gas Eng.
Silica (SiO2) Concentration in Water Cycle- Without Blow Down 0.1
Silica (SiO2) in ppm
0.08
0.06
0.04
0.02
0 11-Sep
13-Sep
15-Sep
17-Sep
19-Sep
21-Sep
23-Sep
Date 11BW
12BW
MCOND
25-Sep
27-Sep
29-Sep
1-Oct
Remark: Limit of Silica in boiler w ater < 0.5 ppm Limit of Silica in main cond and feed w ater < 0.02 ppm
FWT
Figure 6. Silica concentrations in water cycle without boiler blowdown.
Silica (SiO2) Concentration in Steam Cycle - Without Blow Down
Silica (SiO2) in ppm
0.02
0.015
0.01
0.005
0 11-Sep
13-Sep
15-Sep
17-Sep
19-Sep
21-Sep
23-Sep
25-Sep
27-Sep
29-Sep
1-Oct
Data 11SAT
12SAT
11SUP
Remark: Limit of Silica in steam = 0.02 ppm
12SUP
Figure 7. Silica concentrations in steam cycle without boiler blowdown.
Stage 2 test (Blowdown optimization) Blowdown, either a periodic or continuous water removal process is essential in addition to chemical treatments to maintain the concentration of impurities within certain limit and to control the build-up of dissolved solid levels in
the boiler. The required blowdown rate is determined according to the total dissolved solids, the alkalinity, silica or suspended solid levels. The amount of solids in the boiler water can be monitored and controlled by regulating the amount of blowdown. However, the amount of blowdown must properly established to avoid
Zakaria and Hashim
47
Weekly Average Conductivity (CCT) of Water Cycle
Conductivity (CCT) in micS/cm
0.8 0.7 0.6 0.5 0.4 0.3 0.2 0.1 0 1
2
3
4
5
6
7
8
9
10
11
12
13
14
15
16
17
18
19
20
21
22
23
24
23
24
25
26
No.of week
MCOND
BW 11
Remarks : 0.2 uS/cm limit for MCOND 3.0 uS/cm limit for BW 11&12
BW 12
Figure 8. Weekly averages conductivity of water cycle with blowdown.
Weekly Average Conductivity (CCT) of Steam Cycle
Conductivity (CCT) in micS/cm
0.200 0.180
Module Outage from W18 to W21
0.160 0.140 0.120 0.100 0.080 0.060 0.040 0.020 0.000 1
2
3
4
5
6
7
8
9
10
11
12
13
14
15
16
17
18
19
20
21
22
25
26
No.of Week Remarks : 0.2 uS/cm limit for SAT/ SUP Steam
SAT 11
SAT 12
SUP 11
SUP 12
Figure 9. Weekly averages conductivity of steam cycle with blowdown.
sludge deposits which results in carryover if too little blowdown occur. On the other hand, too much blowdown will increase boiler fuel, boiler feedwater and boiler chemical requirements due to removal of excessive hot water (Bahadori and Vuthaluru, 2010).
Conductivity analysis Figures 8 and 9 show the trend of conductivity for the water cycle and the steam cycle respectively. From the trends, we can see that the conductivity trends for the
48
J. Petroleum Gas Eng. Weekly Iron (Fe) Concentration (Average) in Water Cycle 0.1 0.09 0.08
Fe in ppm
0.07 0.06 0.05 Module Outage fr W18 to W21
0.04 0.03 0.02 0.01 0 1
2
3
4
5
6
7
8
9
10
11
12
13
14
15
16
17
No of w eek
MCOND
FWT
BW 11
18
19
20
21
22
23
24
25
25
26
Remarks : 0.02 ppm limit for MCOND,FWT 0.1 ppm for BW 11/12
BW 12
Figure 10. Weekly averages of iron concentrations in water cycle with blowdown.
Fe in ppm
Weekly Iron (Fe) Concentration (Average) in Steam Cycle 0.01 0.009 0.008 0.007 0.006 0.005 0.004 0.003 0.002 0.001 0
Module Outage fr W18 to W21
1
2
SAT 11 SUP 11
3
4
5
6
7
8
9
10
11
12
SAT 12 SUP 12
13
14
No of w eek
15
16
17
18
19
20
21
22
23
24
Remarks : 0.02 ppm limit for SAT & SUP
Figure 11. Weekly averages of iron concentrations in steam cycle with blowdown.
water cycle were observed below the limits. The boiler water conductivity in HRB11 and HRB12 fluctuated within the range of 0.1 to 0.3 uS/cm and 0.2 to 0.6 uS/cm. respectively. As shown in the trend, the temporary increase in the boiler water conductivity was expected during start-up before it reduced and stabilized back after a few days of the boilers in operation. The conductivity for the steam cycle for both boilers fluctuated between the range of 0.1 to 0.15 uS/cm which is still below the limit of 0.2 uS/cm, during normal operation. The trends also
show that the conductivity values were still stable within this range after start-up of the boilers. This condition is achieved due to the 3 h of boiler blow down practice after each start-up. Total iron analysis By looking at Figures 10 and 11, due to the thermal stress on the protective oxide layer and the access of
26
Zakaria and Hashim
49
Weekly Silica (SiO2) Concentration (Average) in Water Cycle 0.1 0.09 0.08
Module outage fr W18 to W21
Silica in ppm
0.07 0.06 0.05 0.04 0.03 0.02 0.01 0 1
2
3
4
5
6
7
8
9
10
11
12
13
14
15
16
17
18
19
20
21
22
23
24
25
26
No of w eek
MCOND
FWT
BW 11
Remarks : 0.5 ppm limit for BW 11/12 0.02 ppm limit for MCOND and FWT
BW 12
Figure 12. Weekly averages of silica concentrations in water cycle with blowdown.
Silica in ppm
Weekly Silica (SiO2) Concentration (Average) in Steam Cycle 0.02 0.018 0.016 0.014 0.012 0.01 0.008 0.006 0.004 0.002 0
Module outage fr W18 to W21
1
2
3
4
5
SAT 11 SUP 11
6
7
8
9
10
11
12
SAT 12 SUP 12
13
14
15
16
17
18
19
20
21
22
23
24
25
26
No of w eek Remark: 0.02 ppm limit of SAT and SUP Steam
Figure 13. Weekly averages of silica concentrations in steam cycle with blowdown.
free oxygen in the make-up water during boiler start-up, the concentration of total iron in the water and steam cycle was found increasing especially in the boiler drums. The Iron concentration for boiler water HRB11 and HRB12 have increased to 0.06 to 0.045 ppm respectively during initial start-up of the boiler after a scheduled weekend shut down. However after a longer outage, the Iron concentration in the boiler water did not show any sign of increase and remained below 0.01 ppm. This was due to fresh feed water which was used to fill up the boiler prior to start-up and the 3 h of blowdown practice for every
start-up of the boiler. The Iron concentration in the steam cycle only show a slight increased during each start-up. In general, the value was less than 0.005 ppm. However, even on a longer term, the analysis on the blowdown practices did not show any sign of deterioration on the water and steam quality. Silica analysis Figures 12 and 13 show the trends of silica concentration
50
J. Petroleum Gas Eng.
in the steam and water cycle respectively. The weekly average of silica concentration in the boiler fluctuated between 0.02 to 0.08 ppm but still far below the limit of 0.5 ppm. The silica concentration can be neglected in the main condensate and feedwater system. This is because the make-up water used has already been treated in the ion-exchanger to become de-mineralized water. At the same time, the Silica (SiO2) concentration in the steam cycle remained constant at 0.01 ppm throughout the test period.
Conclusions The study was conducted in order to understand the behavior of the chemical condition for the water-steam cycle by reducing the normal boiler blowdown frequency of once per day. Several conclusions that can be made are: 1. The chemical condition of the water-steam cycle can still be maintained even though the frequency of the blowdown is reduced. 2. Boiler blowdown must be carried out if one of the chemical parameters in the water and steam cycle is trending upwards and reaching the limit value. 3. After a boiler startup, blowdown shall be carried out for approximately 3 h or until the feed water line indicates stable and low concentration of Iron (Fe) and Silica (SO4), and the conductivity is within the specified range. 4. With the implementation of the new blowdown procedures, saving on the gas, water and chemicals would be achieved for the whole water and steam cycle. 5. The failure of the blowdown valves can be minimized and this again can save a lot of money and down time for the necessary repair work.
REFERENCES Ahmad Z (2006). Principles of Corrosion Engineering and corrosion control, first ed. Boston, Massachusetts. p. 131 Bahadori A, Vuthaluru HB (2010). A Method for Estimation of Recoverable Heat from Blowdown Systems during Steam Generation. Energy, 35: 3501-3507. Jiamin Y, Zhansong W (2009). Corrosion Behavior of TP316L of Superheater in Biomass Boiler with Simulated Atmosphere and Deposit. Chinese J. Chem. Eng., 15(5): 849-853. Khajavi MR, Abdolmaleki AR, Adibi N, Mirfendereski S (2007). Failure Analysis of Bank Front Boiler Tubes, Engine. Failure Anal., 14: 731738. Klien HA, Rice JK (2000). A Research Study on Internal Corrosion in High Pressure Boilers, J. Engine. of Power, 3: 5-12. Kritzer P (2004). Corrosion in High-temperature and Supercritical Water and Aqueous Solutions: A Review, J. Supercritical Fluids, 29: 1-29. Otsuka N (2002). Effects of Fuel Impurities on the Fireside Corrosion of Boiler Tubes in Advanced Power Generating Systems: A Thermodynamic Calculation of Deposit Chemistry. Corros. Sci., 44: 265-283. Sandberg J, Chrster K, Rebei BF (2011). A 7 Years Long Measurement Period Investigating the Correlation of Corrosion, Deposit and Fuel in a Biomass Fired Circulated Fluidized Bed Boiler. Appl. Energy, 1: 99110. Sidhu BS, Prakash S (2006). Erosion-Corrosion of Plasma as Sprayed and Laser Remelted Stellite-6 Coating in a Coal Fired Boiler. Wear, 260: 1035-1044. Smiyan OD, Grigorenko GM, Vainman AB (2002). Effect of Hydrogen on Corrosion Damage of Metal of the High-Pressure Energetic Boiler Drum. Inter. J. Hydrogen Energy, 27: 801-812. Srikanth S, Ravikumar B, Swapan KD, Gopalakrishna K, Nandakumar K, Vijayan P (2003). Analysis of Failures in Boiler Tubes due to Fireside Corrosion in a Waste Heat Recovery Boiler. Engine. Failure Anal., 10: 59-66. Uusitalo MA, Vuoristo PMJ, Mantyla TA (2004). High Temperature Corrosion of Coatings and Boiler Steels below Chlorine-Containing Salt Deposits. Corros. Sci., 46: 1311-1331.