African Journal of Biotechnology Vol. 10(76), pp. 17391-17398, 30 November, 2011 Available online at http://www.academicjournals.org/AJB DOI: 10.5897/AJB11.1786 ISSN 1684–5315 © 2011 Academic Journals
Full Length Research Paper
Genetic diversity evaluation of rapeseed genotypes (Brassica napus L.) based on phenotypic traits and random amplified polymorphic DNA (RAPD) markers F. Ebrahimi1, G. Mohammadi-Nejad2*, A. Baghizadeh3 and M. Abdolinejad3 1
Islamic Azad University, Jiroft branch, Jiroft, Iran. Horticulture Research Institute, Shahid Bahonar University of Kerman, Kerman, P.O.Box 7616914111, Iran. 3 International Center for Science, High Technology and Environmental Science, Kerman, Iran.
2
Accepted 6 October, 2011
Oilseed is the most important source of vegetable oil and the basis of breeding strategies is genetic diversity assessment. Genetic diversity of 19 rapeseed genotypes as well as their ancient ancestors Brassica rapa L. and Brassica oleracea L. were assessed using random amplified polymorphic DNA (RAPD) primers and morpho-phenological traits. Path analysis showed that number of pods per main branch had the highest direct effect on seed yield. Stepwise regressing showed numbers of pods per main branch was entered as the first variable in the model and explained 79% of seed yield variation. Phenotypic cluster showed that genotypes were divided into 4 groups. Polymorphic RAPD primers produced 74 bands. The range of PIC value for the used primer was 0.35 to 2.78. Result indicates primer D as the best primer for genetic diversity analysis. Molecular similarity matrix showed that Magnum and Hyola308 had the highest similarity. Molecular cluster had divided the genotypes into 3 groups; early maturing and high yielding cultivars were located in the first group, genotypes with high number of seed per pod and seed yield were located in the second group, while genotypes at third group had lowest number of pods per main branch and number of seed per pod. Obtained biplot from two first principal component analysis (PCA) showed that number of pod per main branch has an important role on seed yield, and this can be mentioned as an important trait for breeding programs. Key words: Genetic diversity, path analysis, RAPD marker, rapeseed. INTRODUCTION Oilseed rape (Brassica napus L.) is the most important source of vegetable oil and the second most important oilseed crop in the international oilseed market after soybean (Hasan et al., 2006) Brassica napus is an amphidiploid (AACC genome, 2n = 38) and is believed to have arisen by inter-specific hybridization between diploid Brassica rapa L. (AA genome, 2n = 20) and Brassica oleracea L. (CC genome, 2n = 18) (Prakash and Hinata, 1980). To ensure efficient rapeseed production breeders have aimed to produce high yielding and high quality cultivars. The information on the genetic diversity in B. napus could help breeders and geneticists to understand
*Corresponding author. E-mail:
[email protected]. Tel: +98-320-2639. Fax: +98-341-322-2043.
the structure of B. napus germplasm and to predict which combinations would produce the best offspring (Shengwu et al., 2003). There are various techniques available for evaluation of crop genetic variability, such as morphological, biochemical and molecular markers. Molecular (DNA) markers have many advantages over other techniques (independent of environment and plant growth stage, unlimited number, etc.) and they have been increasingly employed for analysis of genetic diversity (Prasad et al., 2000; Kondic-Spika et al., 2008; Nyende, 2008). A variety of molecular markers including restriction fragment length polymorphism (RFLP), simple sequence repeats (SSR), amplified fragment length polymorphism (AFLP) and random amplified polymorphic DNA (RAPD) have been used to study the extent of genetic variation among the diverse group of important crop species in the genus
17392
Afr. J. Biotechnol.
Brassica (Karp, 1997; Shengwu et al., 2003). The use of RAPD technique for the study of genetic variation has been demonstrated as suitable in many species. RAPD analysis has been widely used on Brassica crops: (1) for determining the genetic relationships between different related species (Demeke et al., 1992; Thormann et al., 1994; Ren et al., 1995), (2) for the identification of cultivars (Hu et al., 1999) and the percentage of hybridity (Marshall et al., 1994) and (3) for the estimation of genetic relationships and diversity among crop germplasm (Kresovich et al., 1992; Hallden et al., 1994; Mailer et al., 1994; Santos et al., 1994; Divaret and Thomas, 1998). Shengwu (2003) assessed genetic diversity of B. napus germplasm from China and Europe by RAPD markers and the results indicate the occurrence of a considerable genetic variation between Chinese and European accessions. Marjanovic-Jeromela et al. (2009) employed also RAPD marker and quantitative analysis to determine genetic diversity of rapeseed (B. napus L.) genotypes. Most of the traits of interest to breeders are complex and are the result of the interaction of a number of components. Hence, understanding the relationship between yield and its components is of paramount importance for making the best use of these relationships in selection (Sarawgi et al., 1997). Yield is a complex character determined by several characters having positive or negative effects on this trait. It is therefore important to examine the contribution of each of the trait in order to give more attention to those having the greatest influence on yield. Moreover, information on the association of traits with yield is of great importance to define selection criteria for rape breeding in terms of yield. Generally, correlation coefficients show relationships among independent characteristics and the degree of linear relation between these characteristics. However, path analysis is necessary to clarify relationships between characteristics deeply because correlation coefficients describe relationships in a simple manner (Korkut et al., 1993). Path coefficient analysis separates the direct effects from the indirect effects through other related characters by partitioning the correlation coefficient (Dixet and Dubey, 1984). Many breeders were involved in analyzing the path coefficient. Usefulness of information obtained from correlation can be enhanced by partitioning them into direct and indirect effects for a set of a prior cause-andeffect interrelationships (Kang et al., 1983; Gravois and McNew, 1993). Tuncturk (2007) investigated the relationships between yield and some yield components of 16 oilseed rape cultivars (B. napus ssp. oleifera L.) by using correlation and path coefficient analysis, and there was statistically positive correlation between yield with the number of branch (r = 0.219**), number of pods per plant (r = 0.424**), the number of seeds per pod (r = 0.247**) and 1000-seed weight (r = 0.161*). Number of pods per plant, 1000-seed weight and number of seeds per pod
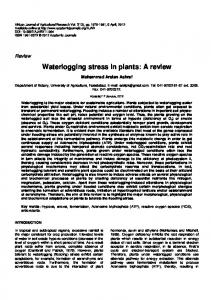
have shown a considerable direct positive effect on yield. Positive direct effect of number of pods per plant, number of seeds per pod and number of branches per plant was associated with significant and positive correlation with yield. These yield components suggested good selection criteria to improve yield of rapeseed breeding. The present study was undertaken to estimate the genetic diversity of some compatible oilseed genotypes in south and southeast part of Iran based on phenotypic traits and RAPD molecular marker (Table 1). MATERIALS AND METHODS Plant material for this research contained 19 rapeseed (B. napus L.) genotypes compatible to south and south-east part of Iran as well as their ancient ancestors B. rapa L. and B. oleracea L. (Table1). The experiment was conducted at the Research Farm of Islamic Azad University of Jiroft Branch (28° 35′N, 58° 49′E, 639 m.asl). 0.5 g of leaves samples were used for genomic DNA extraction. Morphological data included plant height (cm), number of days to emergence, number of days to first flowering, number of days to the end of flowering, duration of flowering, number of days to maturity, number of pods per main branch, number of seed per pod, 1000seed weight and seed yield (t/ha). Statistical analysis such as correlation, regression and path analysis was done using viva SAS software. DNA amplification DNA polymorphism was estimated on the basis of 10 RAPD primers (series of primers 1 to 10 Cinnagen Co., Tehran, Iran) (Table 2). PCR reaction were carried out in a volume of 25 µL containing 50 ng (1 µL) of DNA Template, 0.25 µmol of each primer and 12.5 µL master kit of Qiagen Company (PCR Master of Qiagen Company contains all components for PCR, except DNA template and primers. Composition of Master Mix: 0.04 u/µL Taq DNA polymerase, reaction buffer, 3 mM MgCl2, 0.4 mM of each dNTP (dATP, dCTP, dGTP and dTTP). PCR reaction was performed in 4 min at 94°C and 40 cycles: denaturation - 1 min at 94°C, annealing -1 min at 40°C , extension - 2 min at 72°C and final extension step at 72°C for 5 min. PCR product were separated by electrophoresis in 1.5% agarose gel with 1 × TAE buffer and stained with ethidium bromide. The obtained results were photographed by GENE SNAPE programme (Figure 5).
RESULTS AND DISCUSSION The results show that there were significant variations among the mentioned genotypes for all the measured traits. The highest correlation were found between yield and number of pods per main branch (r=0.889**). Significant and positive correlations were found between yield with number of seed per pod and number of days to first flowering. These results confirm the findings of Singh (1974), Ozer et al. (1999), Çalışkan et al. (1998), Algan and Aygün (2001) and Tuncturk et al. (2007). Also, highly significant and negative correlation was found between yield and number of days to maturity, while yield showed non-significant correlation with 1000 -seed weight. Correlation coefficient of phonological traits showed
Ebrahimi et al.
Table 1. List of rape seed genotypes in south and southeast part of Iran*.
Genotype Balero Pf.7045.01 Holya402 Hyola401 Cyclan Hyola308 Shiralee Opera Profit Sarigol Elite RGS003 Goliath Option500 Fusia Option501 Norseman Slm Magnum
Wild ancestors of rapeseed Brassica rapa Brassica oleracea -
*None of the mentioned genotypes are originally from Iran.
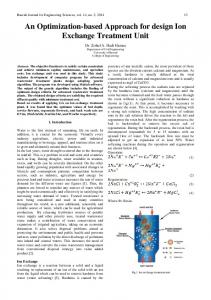
that number of days to maturity had negative and significant correlation with seed yield (Table 3). This could be due to heat stress at the end of growing season. Therefore, early maturing genotypes are suitable for condition with heat stress such as Jiroft region. The important of early maturity is an aspect of escape from the heat stress at the end of growing season, as well as controlling pest, especially aphids in concordance with Aien (2006). Raymer (1991) reported that early maturing genotypes have high performance due to lack of heat stress at grain filling stage. More also, positive and significant correlation was found between number of days to first flowering and its duration as confirmed by Fanay (2008). The result showed that duration of flowering was longer in late flowering genotypes; therefore both vegetative and reproductive stage was longer in late flowering genotypes which cause an increase in photosynthetic and seed yield, thus leading to a significant increase in their performances. These results explain significant and positive correlation number of days to first flowering with seed yield (Table 3). Furthermore, path analysis was performed in order to investigate the relationships between yield and some yield components of studied genotypes (Table 3). Path analysis showed that number of pods per main branch had the highest direct effect on yield (p = 0.953) (Figure 1). Therefore, this trait can be recommended as the most important and effect factor for breeding strategist. Thurling (1974), Ozer et al. (1999) and Ali et al. (2002) also reported that number of pods per plant had highest
17393
Table 2. Used Primers for generate RAPDs in studied genotypes.
Primer’s name A B C D E F G H I J
Sequence (5’–3’) GGT CTC CTA (G) CGG AGA GCG (A) CCG GCA TAG (A) TGG GCT CGC (T) ACT TGT GCG (G) CCC ACT GAC (G) CTG AGG AGT (G) GGT CAA CCC (T) GCG GGA GAC(C) CCT CAC CTG (T)
direct effect on yield. 1000- Seed weight (p = 0.493) and number of seed per pod (p = 0.298) had positive direct effect on yield (Figure 1). Similar reports have been made by Singh (1974), Seifert and Boelcke (1977), Ozer et al. (1999), Algan and Aygün (2001) and Tunctruk (2007), thus confirming our results. 1000-seedweight was covered by the negative indirect effect of number pods per main branch and number of seed per pod (Table 4), hence its correlation with yield was not significant (Table 3). Residual value (0.081) showed that yield components including number of pods per branch, 1000- seed weight and, number of seed per pod respectively have excellent potential on yield improvement. Moreover, in order to assess the effect of traits on yield, multiple linear regressions using step-wise method was performed. Number of pods per main branch was entered as the first variable in the model which explained 79% of yield variation. 1000-seed weight and number of seed per pod explained 14 and 7% of yield variation, respectively (Table 5). These results conform to the result of path analysis, therefore number of pods per main branch has an important typical role to improve yield of used cultivars. Comparing standard regression coefficients identified importance of these traits and how they impact on yield (Table 6). Traits dispersion based on principal components analysis showed that traits were categorized in 3 different groups (Figure 2). The first group included 1000-seed weight and number of days to maturity, second group involved number of days to first flowering, duration of flowering, and number of seed per pod and seed yield, third group included height, number of days to emergence, number of days to the end of flowering and number of seed per pod (Figure 2). Phonological traits had different trend variation. Number of days to maturity was located in a separate group. The number of days to first flowering and its duration as well as seed yield were located in the same group; it confirmed duration of flowering has significant correlation with number day to first flowering (Table 3). Obtained results based on first two components showed that three main yield
17394
Afr. J. Biotechnol.
Table 3. Correlation coefficient among the measured traits for studied genotypes.
Parameter number of days to emergence
number of days to emergence
Height (cm)
number of seed per pod
1000- seed weight
number of days to first flowering
number of days to end of flowering
Duration of flowering
number of days to maturity
number of pods per main branch
Seed yield (t/ha)
1
height
0.107
1
number of seed per pod
-0.324
0.128
1
1000-seed weight
0.014
-0.089
-0.427
1
number of days to first flowering
-0.101
0.097
0.047
0.146
1
number of days to end of flowering
0.424
0.085
-0.102
-0.243
0.085
1
Duration of flowering
-0.129
-0.015
-0.193
0.448*
0.462*
0.087
1
number of days to maturity
0.142
-0.133
- 0.436*
0.371
-0.185
-0.388
-0.115
1
number of pods per main branch
0.175
0.051
0.448*
-0.401
0.375
0.359
0.121
- 0.653**
1
Seed yield
0.07
0.011
0.515*
-0.016
0.470*
0.19
0.259
- 0.550*
0.889**
components including number of seed per pod, number of pod per branch and 1000-seed weight were located in the three separate groups. Since number of pod per main branch was located in the same group with seed yield, its variation has the same trend like seed yield and can emphasize on its importance. In addition, cluster analysis for all phenotypic traits based on the squared Euclidean distance
and Ward’s method were performed. The result shows that geno-types were divided in 4 groups (Figure 3): First group contained magnum, Sarigol, Hyola308, profit, B. Oleracea, RGS003 and Elite; second group contained goliath, Option500 and Fusia; third group contained Option501, Pf.7045.01, Holya402 and Norseman; whilethe fourth group contained Balero, Hyola401, Cyclan, Shiralee, Opera and B. rapa Slm (Figure
1
3). Cluster analysis for all phenotypic traits showed that magnum, Sarigol, Hyola308, Profit, RGS003, Elite genotypes were located in the same group with B. Oleracea. Also, Balero, Hyola401, Cyclan, Shiralee, Opera and Slm were located in the same group with B. rapa. It was assumed that this could be due to their phenotypic similarity with their ancestors. Biplot of first two components which justified 52% of variation
Ebrahimi et al.
17395
P1y=0.953
r12=0.448
Seed yield
X2: Number of seed per pod P2y=0.298
r 23=-0.401
r 23=-0.427 P3y=0.493
X3: 1000- Seed weight
Figure 1. Diagram of path coefficient for seed yield and its main components.
Table 4. Path coefficient of main yield components on yield for studied genotypes.
Trait
Direct effect
Number of pods per main branch Number of seed per pod 1000-seed weight
0.953** 0.298ns 0.493**
Indirect effect Number of pods per Number of main branch seed per pod 0.133ns 0.427* -0.128ns -0.383ns
Total correlation
1000-seed weight -0.199ns -0.211ns
0.888 0.514 -0.017
Table 5. Estimated Regression descriptors and their summary statistics for studied genotypes.
Source
B
Constant Number of pods per main branch 1000-seed weight Number of seed per pod
-3.256 3.18 × 10 -2 0.51 6.48 × 10 -2
Standard error 0.164 0.001 0.023 0.005
Standardize coefficients beta 0.953 0.494 0.300
T test
R2 change
VIF
-19.877 42.860 22.485 13.316
0.79 0.14 0.07
1.341 1.311 1.376
Table 6. Variance analysis of Regression for studied genotypes.
Source Regression Residual Total
DF 3 17 20
Sum of squares 2.803 1.767 × 10 -2 2.820
showed that 1000-seed weight and number of day to maturity had a different effect of there factors. This can be due to heat stress observed at ending growing season. Dispersion diagram of genotypes categorized them in 4 groups. Ten RAPD primers produced 74 bands. Minimum number of bands belonged to primer A with 2 bands and maximum number of band belonged to primer I with 15 bands. Estimated maximum PIC value was 0.37. Sum of
Mean of squares 0.934 1.040 × 10 -3
F 898.492** -
PIC value for all of alleles of each primer were in the range 0.35-2.78 respectively for primer A and D (Table 7). According to the obtained result, primer D was distinguished as the best primer for genetic diversity analysis. Also, molecular cluster analysis based on the Jaccard’s similarity coefficient and UPGMA method was performed, the result showed that genotypes were divided in to 3 groups (Figure 4). The first group contained Opera, Balero, Elite and Slm; the Second group
17396
Afr. J. Biotechnol.
1.0
Duration of flowering 1000-seed weight
Days to first flowering
.5
Seed yield Days to maturity Days to emergence Number of pods per main branch maturity Height Days to end of flowering
Component 2
0.0
Number of seed per pod
-.5
-1.0 -1.0
-.5
0.0
.5
1.0
Component 1 Figure 2. Diagram of traits dispersion based on principal components analysis.
Figure 3. Constructed dendrogram based on squared Euclidean distance and Ward’s method for studied genotypes.
contained Profit, Shiralee, Magnum, Hyola308, Fusia, RGS003, Norseman, B. oleracea, Hyola402, B. rapa, Option501, Pf.4075001, Hyola401 and Sarigol, and the third group contained Cyclan, Option500 and Goliath. Based on cluster analysis for molecular assay, early maturing and high yielding cultivars such as Hyola 308,
Hyola 401 and Hyola 402 were located in the same group. Also, based on the result of correlation coefficient negative and significant correlation were found between number of days to maturity with seed yield. Genotypes with high number of seed per pod and seed yield were located in second group which had positive and
Ebrahimi et al.
Table 7. PIC value of used RAPD primers in studied genotypes.
Primer’s name A B C D E F G H I J
PIC value 0.35 1.37 1.21 2.78 1.83 2.53 0.67 1.22 2.32 0.63
Figure 4. Constructed molecular dendrogram of studied genotypes based on the Jaccard’s similarity coefficient and UPGMA method.
17397
17398
Afr. J. Biotechnol.
Figure 5. DNA bands amplified from leaves of some understudied genotypes using RAPD marker and electrophoreses in a 1.5% agarose gel. Ladder = 1 Kbp.
significant correlation between number of seed per pod and seed yield. Genotypes at third group have lowest number of pods per main branch and number of seed per pod, and positive and significant correlation was also found between number of pods per main branch and number of seed per pod. Since B. rapa and B. oleracea are diploid species and the rest are tetraploid, based on molecular cluster, these were located in the same group. Similarity matrix related to molecular data showed the genotypes magnum and Hyola308 have the lowest genetic distance and these genotype were located in the same group based on cluster analysis for phenotypic traits and molecular data. In addition, polymorphic bands were
estimated as 81.04. These results therefore showed that there was an appropriate level of diversity. ACKNOWLEDGEMENTS The molecular assay of this study was done by personnel at International Center for Science and High Technology and Environmental Sciences of Kerman. REFERENCES Aien A (2006). Study on yield potential of advanced rapeseed varieties in Jiroft area. Pajouhhesh. Sazandegi. 77: 119-124.
Ebrahimi et al.
Algan N, Aygün H (2001). Correlation between yield and yield components in some winter rape genotypes (In Turkish).J. Ege Uni. Agric. Faculty. 38(1): 9-15. Ali N, Javaidfar F, Attary AA (2002). Genetic variability, correlation and path analysis of yield and its components in winter rapeseed (Brassica napus L.). Pak. J. Bot. 34(2): 145-150. Çalışkan ME, Mert A, Mert M, İşler N (1998). Important agronomic characters of some rapeseed cultivars and effects of these characters on yield formation in Hatay ecological conditions. J. Agricu. Faculty MKU, 3(2): 127-142. Demeke T, Adams RP, Chibbar R (1992). Potential taxonomic use of random amplified polymorphic DNA (RAPD): a case study in Brassica. Theor. Appl. Genet. 84: 990–994. Divaret I, Thomas G (1998). Use of RAPD markers to analyze the genetic variability of a collection of Brassica oleracea L. In: Thomas G, Monteiro AA (eds.): Proc. Int. Symp. Brassicas. Acta Hort. 459: 255–262. Dixet P, Dubey DK (1984). Path analysis in Lentil (Lens culinaris Med.). Lens Newsletter. 11(2): 15-17. DosSantos JB, Nienhuis J, Skroch P, Tivang J, Slocum MK (1994). Comparison of RAPD and RFLP genetic markers in determining genetic similarity among Brassica oleracea L., genotypes. Theor. Appl. Genet. 87: 909-915. Fanay HR (2008). Assessment of the yield, yield components and some agronomic traits of rapeseed spring genotypes in Sistan region. Pajouhesh. Sazandegi. 79 : 36-44. Hallden C, Nilsson NO, Rading IM, Sall T (1994). Evaluation of RFLP and RAPD markers in a comparison of Brassica napus breeding lines. Theor. Appl. Genet. 88: 123–128. Hasan M, Seyis F, Badani AG, Pons-Kühnemann J, Friedt W, Lühs W, Snowdon RJ (2006). Analysis of genetic diversity in the Brassica napus L. gene pool using SSR markers. Genet. Resour. Crop. Evol. 53: 793-802. Hodgson AS (1975). Rapeseed adaptation in nothern NSW. I. phenological responses to vernalization temprature and photoperiod by annual and bienial cultivars of B.napus and B. compestris. Aust. J. Agric. Res. 29: 693-710. Hu J, Li G, Struss D, Quiros CF (1999). SCAR and RAPD markers associated with 18-carbon fatty acids in rapeseed, Brassica napus. Plant Breed. 118: 145–150. Karp A (1997). Reproducibility testing of RAPD, AFLP and SSR markers in plants by a network of European laboratories. Mol. Breed. 3: 381-390. Kang MS, Miller JD, Tai PYP (1983). Genetic and phenotypic path analysis and heritability in sugarcane. Crop. Sci. 23: 643-647. Kondic-Spika A, Kobiljski B, Dencic S, Mladenov N, Hristov N, Kacavenda D, Brbaklic Lj (2008). DNA Fingerprinting of Wheat (Triticum aestivum L.) varieties using microsatellite markers. In: Proceedings of Int. Conference: Conventional and Molecular Breeding of Field and Vegetable Crops (Breeding 08), 24-27 November, Novi Sad, Serbia, (CD Ed.). pp. 149-152. Korkut ZK, Başer İ, Bilir S (1993). The studies path coefficient and correlation of drum wheat’s. Sym. Drum Wheat and Its Products, Ankara, 183-187. Kresovich S, Williams JGK, McFerson JR, Routman EJ, Schaal BA (1992). Characterization of genetic identities and relationships of Brassica oleracea L. via a random amplified polymorphic DNA assay. Theor. Appl. Genet. 85: 190–196. Mailer RJ, Scarth R, Fristensky B (1994). Discrimination among cultivars of rapeseed (Brassica napus L.) using DNA polymorphisms amplified from arbitrary primers. Theor. Appl. Genet. 87: 697–704. Marijanovic-Jeromela A, Konidic-Spika A, Saftic- Pankovic D, Marinkovic R, Hristov N (2009). Phenotypic and molecular evaluation of genetic diversity of rapeseed (Brassica napus l.) genotypes. Afr. J. Biotechnol. 8(19): 4835-4844.
17399
Marshall P, Marchand MC, Lisieczko Z, Landry BS (1994). A simple method to estimate the percentage of hybridity in canola (Brassica napus) F1 hybrids. Theor. Appl. Genet. 89: 853–858. Nyende AB (2008). Biotechnology in plant nutrient management for agicultural production in the tropics: The research link. Afr. J. Biotechnol. 7(6): 664-669. Özer H, Oral E, Doğru Ü (1999). Relationships between yield and yield components on currently improved spring rapeseed cultivars. Trend J. Agric. Forest. 23: 603-609. Prakash S, Hinata K (1980). Polyphyletic origins of Brassica napus: new evidence based on organelle and nuclear RFLP analysis. Genome, 35: 992-1001. Prasad M, Varshnez RK, Roy JK, Balyan HS, Gupta PK (2000). The use of microsatellites for detecting DNA polymorphism, genotype identification and genetic diversity in wheat. Theor. Appl. Genet. 100: 584-592. Ren JP, Mc Ferson JR, Li RG, Kresovich S, Lamboy WF (1995). Identities and relationships among Chinese vegetable Brassicas as determined by random amplified polymorphic DNA markers. J. Am. Soc. Hort. Sci. 120: 548–555. Santos JB, Nienhuis J, Skroch P, Tivang J, Slocum MK (1994). Comparison of RAPD and RFLP genetic markers in determining genetic similarity among Brassica oleracea L. genotypes. Theor. Appl. Genet. 87: 909–915. Sarawgi AK, Rastogi NK, Soni DK (1997). Correlation and path analysis in rice accessions from Madhya Pradesh. Field Crops Research. 52: 161-167. Seifert M, Boelcke B (1977). Untersuchungen zum ertragsaufbau bei winterraps. Akademia der Landwirtschaftswissenschaften der Deutschen Demokratischen Republik, Berlin. Tagungsbericht Nr. 149: 183-193. Shengwu H, Ovesná J, Kučera L, Kučera V, Vyvadilová M (2003). Evaluation of genetic diversity of Brassica napus germplasm from China and Europe assessed by RAPD markers. Plant Soil Environ. 49(3): 106-113. Singh DP (1974). Correlation in India Colza. Indian J. Agric. Sci. 44(3): 142-144. Thormann CE, Ferreira ME, Camargo CEA, Tivang JG, Osbron TC (1994). Comparison of RFLP and RAPD markers to estimating genetic relationships within and among Cruciferrous species. Theor. Appl. Genet. 88: 913–980. Thurling N (1974). Morphophysiological determinats of yield in rapeseed (B. campestris and B. napus). II. Yield components. Aust. J. Agric Res. 25: 711-721. Tuncturk M, Yilmaz İ, Erman M, Tuncturk R (2007). Comparison of Summer Rapeseed (Brassica napus ssp. oleifera L.) cultivars for yield and yield traits under Van ecological conditions. Pak. J. Bot. 39(1): 81-84.