Vol. 11(39), pp. 3751-3762, 29 September, 2016 DOI: 10.5897/AJAR2016.11088 Article Number: A01750D60822 ISSN 1991-637X Copyright ©2016 Author(s) retain the copyright of this article http://www.academicjournals.org/AJAR
African Journal of Agricultural Research
Full Length Research Paper
Measurement of apparent electrical conductivity of soil and the spatial variability of soil chemical properties by electromagnetic induction Glécio Machado Siqueira1*, Jorge Dafonte Dafonte2, Antonio Paz González3, Monteserrat Valcarcel Armesto2, Ênio Farias de França e Silva4, Mayanna Karlla Lima Costa1 and Raimunda Alves Silva1 1
Departamento de Geociências - São Luís (MA), Universidade Federal do Maranhão - Brazil. Departamento de Ingeniería Agroflorestal - Lugo (Galicia), Universidad de Santiago de Compostela - Spain. 3 Universidade da Coruña - Facultad de Ciencias - La Coruña (Galicia), Spain. 4 Departamento de Engenharia Agrícola - Recife (Pernambuco), Universidade Federal Rural de Pernambuco - Brazil. 2
Received 5 April, 2016; Accepted 2 June, 2016
The aim of this research is to evaluate the relationship between the measurement of apparent electrical conductivity of soil and its chemical attributes by electromagnetic induction. Geophysics methods used for soil measurement, with electromagnetic induction technique for measuring apparent electrical conductivity of the soil (ECa) is important for soil digital mapping, as it determines soil properties, with which ECa is directly related. The apparent soil electrical conductivity (ECa) was measured by electromagnetic induction with EM38-DD device (Geonics Ltd) at two depths: Vertical dipole (effective depth of 1.5 m- ECa-V) and horizontal dipole (effective depth of 0.4 m - ECa-H) in 6 ha of land located in the Northwest of Spain (Castro de Ribeiras de Lea, Lugo) on several dates. The experimental semivariogram showed that there was a drift for ECa-V and ECa-H data. Soil chemical properties were shown in 23/06/2008 following the sample scheme building by ESAP program (40 spots). At the 40 optimized sampling points, the following soil properties were measured at 0.0 to 0.3 m depth: Organic matter (OM), pH in CaCl2, phosphorus (P), potassium (K), calcium (Ca), magnesium (Mg), potential acidity (H+Al), sum of the basis (SB), cation exchange capacity (CEC) and percent of base saturation (V%). The moderate negative correlation coefficient was found between Log ECa-V and organic matter. Both ECa-H and ECa-V exhibited comparatively low correlations with the chemical properties of soil. Key words: EM38-DD, geostatistics, soil management, precision agriculture. INTRODUCTION Precision agriculture follows the management of agricultural production areas, taking into account soil
heterogeneity. For this reason, it uses advanced techniques for the spatial application of inputs variable,
*Corresponding author. E-mail:
[email protected]. Author(s) agree that this article remain permanently open access under the terms of the Creative Commons Attribution License 4.0 International License
3752
Afr. J. Agric. Res.
allowing low production costs and the environmental impacts of agricultural activity (Siqueira et al., 2015). According to Schueller (2000), the precision agriculture is divided into three subsystems: monitoring (data collection and storage); management (decision-making); and control (management and manipulation of information). Spatial technologies give room for the elaboration of maps and interpretation of soil properties of plants. This step that tries to get the sampling process of soil is the most efficient and economical in precision agriculture. The costs of the soil samples are higher, making propagation difficult for most of the farmers (Juan et al., 2011; Rodrigues et al., 2012). The sampling techniques in most cases cause system series. Some of the experimental character and others already in commercial use aim to develop indirect techniques for measuring soil proprieties (Juan et al., 2011). In this way, the use of geophysics methods for measuring soil properties, and electromagnetic induction technique for measuring the apparent electrical conductivity of soil (ECa) are really important for digital mapping soil, as it determines soil properties, with which ECa is directly related (Heil and Schmidhalter, 2012; Doolittle and Brevik, 2014). Apparent electrical conductivity is the ability of a material to transmit or conduct electrical current (Doerge, 2004). It is influenced by various factors of soil such as porosity, dissolved electrolyte concentration, texture, quantity and composition of colloids, organic matter, inorganic C and water content (Machado et al., 2015; Neely et al., 2016). Some research reports that ECa readings are related to soil characteristics and properties such as pH, humidity, texture and CEC (Molin and Rabello, 2011). It is possible to obtain good correlations between them since the ECa readings are obtained in the field (Sudduth et al., 2005). Several studies (Amezketa, 2007; Morari et al., 2009; Saey et al., 2009) have demonstrated the efficiency of the use of ECa data as secondary information for the sample of other soil properties. Bronson et al. (2005) reported that soil properties that correlated with ECa 2+ 2+ + included soil extractable Ca , Mg , Na , CEC, silt and soluble salts. This study aimed to determine the relation between the apparent soil electrical conductivity measured by electromagnetic induction and soil chemical attributes (organic matter, pH, phosphorus, potassium, calcium, magnesium and H+Al, the sum of bases, cation exchange capacity, and percent base saturation).
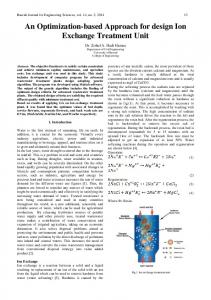
MATERIALS AND METHODS Study area description The study area is located in Terra Chá Region in the inner area of Northeast of Lugo (Galicia, Spain); the largest Galicia District, occupying an extensive area of 1.624 km2 (Tragsa, 2009); it is delimited at the edges by mountain reliefs and runs inside a dense network of watercourses (Figure 1). Geographic coordinates are
43°09′49′′N and 7°29′47′′ W, the average elevation is 410 m, and the mean slope is 2% (Figure 2). The annual average temperature is 11,2°C, with a total average precipitation of 930 mm. The climate classification according to Koppen is Cfb type; with humid climate and warm summer; there is no dry season. Table 1 shows the analytics data of soil in the study area. The texture of the fine earth is sandy-loam in Ap horizon, sandy-clayloam in Bw horizon, and clayey in the Btg horizon, and there is a general clay increase with soil depth. The organic matter content is rather high on Ap horizon (5.05%), contrasting with the lower contents at the underlying horizons of the soil profile.
Determination of the apparent electrical conductivity of soil The apparent soil electrical conductivity was determined by an electromagnetic induction tool- EM38-DD. The tool is composed of two interpretation units, one in the horizontal position (ECa-H) and the other in the vertical position (ECa-V); the relative response curve demonstrates a high sensitive to the equipment at 0.4 m in the horizontal dipole and at 1.5 m in the vertical dipole (Siqueira et al., 2015). According to Wait (1962) and McNeill (1980), the relative response of the electromagnetic induction of the equipment in the soil profile can be described by the following equations.
φV
φH
V
4Z
(Z ) = 2
H
(4Z
2
(1)
+ 1)
1 2
4Z
(Z ) = 2
(4Z
2
+ 1)
1 2
(2)
Where the relative sensibility of the electromagnetic induction sensor decreased with the increase of the depth in the horizontal dipole (ΦH-H) and vertical dipole (ΦV-V). Electrical conductivity of the soil sample was done in 3/14/2008 (1887 samples), 4/3/2008 (1871 samples), and 6/23/2008 (1859 samples). To do the georeferencing interpretation of the equipment, EM38-DD, GPS RTK (StarFire de John Deere) was used. It was mounted in a metallic car developed in the hydraulic laboratory of the Superior Polytechnic School, University of Santiago de Compostela.
Soil chemical properties The soil chemical properties were sampled on 6/23/2008 following the optimized sample scheme building by ESAP program (40 spots). In the laboratory, the samples removed at 0.0-0.3 m depth were dried in stove at 105° C and divided into sub-samples to determine the chemical properties of the soil. The chemical properties (OM, pH, H+Al, CEC, K, Ca, Mg, SB, P, and V%) were determined according to the method proposed by Raij et al. (2001). The organic matter was determined by humid oxidation and colorimetric interpretation. The pH was determined in a solution of 0.01 mol L-1 of CaCl2. The potential acidity (H+Al) was estimated by the pH values of one soil suspension in buffer solution (Raij et al., 2001). To determine the percentage saturation by basis (V, %), Ca contents (mmolc dm-3), Mg (mmolc dm-3), K (mmolc dm-3) and Na (mmolc dm-3) (Raij et al., 2001) were determined first. The cation exchange capacity (CEC, mmolc dm-3) was determined considering the summation of the sum of the bases (K, Ca, Mg and Na) and potential acid (H+Al, mmolc dm-3).
Siqueira et al.
3753
Castro de Ribeiras de Lea (Lugo, Spain)
Figure 1. Geographical location of the study area.
Figure 2. Study area and digital elevation map.
Table 1. Soil texture data for a representative profile of the study area.
Horizon
Depth (m)
Organic Matter -3 (g dm )
Clay
Ap Bw Btg
0,0-0,35 0,35-0,70 +0,70
50,50 7,20 2,60
175,00 192,00 479,00
Statistical and geostatistical analysis The statistical analyses were made by R software (Ayres et al., 2007), providing the main statistics moments: average, variance, average deviation, the coefficient of variation, asymmetry, kurtosis and maximum deviation related to the normal frequency distribution by the Kolmogorov-Smirnov test, with a probability of 1% error. In this research, the geostatistics analyses were made by building and
Silt g kg 191,00 207,00 280,00
Sand
Gravel
634,00 591,00 241,00
370,00 448,00 -
-1
modeling the experimental semivariogram and the values of the sampled spots were determined by kriging interpolation technique. The initial analysis shows that some variables had some tendencies; in this case, the ordinary residual kriging and universal kriging were used. In the case of ordinary residual kriging, first, the tendency was removed using the following equations (3, 4 and 5) to determinate the residues.
3754
Afr. J. Agric. Res.
1. Linear
m( x) = A0 + A1 x + A2 y + A3 xy
(3)
2. Quadratic or parabolic
m( x) A0 A1 x A2 y A3 x 2 A4 y 2 A5 xy
(4)
3. Cubical m( x) = A0 + A1 x + A2 y + A3 x 2 + A4 y 2 + A5 xy + A6 x 3 + A7 y 3 + A8 x 2 y + A9 xy 2
(5) For those with tendency removal, it was possible to determine the experimental semivariogram of residuals, adjusting the semivariogram model by cross-validation using PROGEOESTAT software (Vieira et al., 2002). For the maps of isolines building, tSURFER 11 software (GOLDEN SOFTWARE, 1999) was used, considering the determined values by residual kriging, where the drift m(x) is supposed to to be known. The spatial drift was estimated by the quadratic minimum method, and the sediments were calculated by equation 6.
R( x) Z ( x) m( x)
(6)
The residue would be the difference between regionalized variable and the drift
RESULTS AND DISCUSSION Apparent electrical conductivity variability of soil The mean values (Table 2) show that in the first two sample dates (3/14/2008 and 4/3/2008) were found the highest mean values of apparent soil electrical conductivity measured in the vertical (ECa-V) and horizontal dipoles (ECa-H). The variance values are similar in the first two sample dates (3/14/2008 and 4/3/2008), showing an increase of two variance units in the third sample date (6/23/2008). The statistical analysis (Table 2) shows that the data presented lognormal frequency distribution using the Kolmogorov-Smirnov test with a probability error of 1%. In all dates sampled, ECa presented the highest values of skewness coefficient, mainly because the dates are concentrated at the beginning of the frequency distribution graph, presenting a large dispersion of dates with a difference of the main value. According to Stadler et al. (2015) and Costa et al. (2014), the ECa is influenced by soil humidity content. Table 3 presents the accumulated precipitation and evapotranspiration between the sample dates. In the period before the first sample date (3/14/2008) there was a period with low precipitation, but with low values of evapotranspiration, which provides a high water content in the soil. Moreover, in the Southwest zone of the parcel level groundwater is closest to the surface. In the period before the second sample date (4/3/2008), there was an
increase in precipitation allowing the storage of water on the soil surface. This led to a higher main value of ECa-H -1 with 14.59 mS m . During this period, there were practically no changes in evapotranspiration values. From June 2008, the amount of precipitation over the study area was significantly decreased, with an increase in evapotranspiration values. -1 The highest ECa-V average value is 14.04 mSm on 4/3/2008 due to winter precipitation combined with a B horizon of reduced permeability and flat topography of the area. This caused high phreatic level during most of the year. In the present study, the ECa-H measured in 3/14/2008 (5.53 %) and the ECa-H in 03/04/2008 (5.32%) showed low values of variation coefficient (CV, %); all other measured variables at different sample dates presented average coefficients variations. Vitharana et al. (2008), studying the use of CEa dates in Belgium, observed CV values of 25,30 % and 19,80 % respectively in ECa-V and ECa-H. These values were higher than those described in the present study for ECa. The ECa-H on 4/3/2008 presented the lowest value of the range (a, 40 m). ECa-H presented the lowest values of range in all sampled dates. In general, ECa-V presented an average value range of 126.66 m and ECaH has an average value range of 58.00 m. Molin et al. (2005) described the range values for ECa-V of 255.60 m and 281.50 m for the ECa-H in a clay Ferralsol in the Southern region of Brazil. On all sampled dates, ECa-V and ECa-H values were different. The relative sensibility of the electromagnetic induction sensor decreases with incease in depth. Note that the horizontal dipole has a higher sensibility than the vertical dipole, which influences the values found in this way. The semivariograms of ECa-H and ECa-V were fitted to the spherical model, coinciding with other authors who stated that this model prevails in soil science studies (Siqueira et al, 2008; Molin and Faulin, 2013) (Table 4).
Spatial variability of the soil chemical properties (ECe, MO, pH, P, K, Ca, Mg, H+Al, SB, CEC and V%) The statistical parameters of the chemical properties of the soil (ECe, MO, pH, P, K, Ca, Mg, H+Al, SB, CEC and V%) are presented in Table 5. The value of coefficient variation (CV %) shows the dates of organic matter (O.M) and the pH present the lower values of CV (7.88 and 6.07%). The other properties show the CV average value according to the classification of Warrick and Nielsen (1980). The content of K and Mg presents the log normal frequency distribution (Ln) by the average of the Kolmogorov-Smirnov with an error probability of 1% (D, Table 5); other studied properties (ECe, MO, pH, P, K, Ca, H+Al, SB, CEC, and V%) present normal frequency distribution (n). The electrical conductivity of the saturation -1 extract (ECe) presents an average value of 13.82 mS m ,
Siqueira et al.
3755
Table 2. Statistical parameters of the continuously recorded ECa data sets.
Date 3/14/2008 4/3/2008 6/23/2008
Variable ECa-V ECa-H ECa-V ECa-H ECa-V ECa-H
Unit
N 1887 -1
mS m
1871 1859
Mín. 5.75 9.25 9.63 6.63 4.13 6.63
Máx. 18.38 19.00 20.50 19.50 20.13 20.00
Mean 10.48 14.10 14.04 14.59 11.21 12.12
Variance 4.42 0.60 4.64 0.60 6.12 3.22
CV 20.07 5.53 15.34 5.32 22.07 14.81
Skew 0,527 0.065 0.662 0.160 0.485 0.839
Kurt 0.124 1.810 0.083 10.514 -0.243 1.285
D 0.045Ln 0.040Ln 0.073Ln 0.095Ln 0.071Ln 0.092Ln
N, Number of measures; Min., minimum value; Max., maximum value; Mean ± SD: mean ± standard deviation; CV: coefficient of variation (%); Skew, skewness; Kurt, kurtosis; D: normality of the data for test of Kolmogorov-Smirnov (P < 0.01, n, normality, and Ln: log-normality).
Table 3. Precipitation and evapotranspiration of cumulative reference between successive dates, in which apparent electrical conductivity of the soil (ECa-V and ECa-H) was recorded.
Period 2/15/2008-3/14/2008 3/15/2008-4/3/2008 4/4/2008-6/23/2008
Precipitation (mm) 52.60 80.40 397.80
Evapotranspiration reference (mm) 38.00 37.07 214.55
Table 4. Fitted semivariogram parameters (ECa-V and ECa-H) measured on sample dates.
Date 3/14/2008 4/3/2008 6/23/2008
Variable Log ECa-V Residual Log ECa-H Residual Log ECa-V Residual Log ECa-H Residual Log ECa-V Residual Log ECa-H Residual
Unit
Model Spherical Spherical Spherical Spherical Spherical Spherical
-1
mS m
C0 0.0001 0.14 0.00 0.10 0.001 0.001
C1 3.14 0.302 5.10 0.32 0.01 0.05
a (m) 105.00 44.00 145.00 40.00 130.00 130.00
GD (%) 0.00 31.67 0.00 23.80 9.09 1.96
C0: nugget effect; C1: structural variance; a: range; SD: spatial dependence (%).
Table 5. Statistical parameters of the soil chemical properties.
Variable ECe MO pH P K Ca Mg H+Al SB CEC V%
Unit -3
g dm -3 mg dm
mmolc -3 dm
%
N 40 40 40 40 40 40 40 40 40 40 40
Min. 7.00 64.00 4.40 81.00 1.50 24.00 3.00 31.00 31.50 98.90 29.00
Max. 28.00 98.00 6.00 425.00 14.80 110.00 26.00 121.00 134.50 174.00 81.00
Mean 13.82 81.50 4.87 160.00 3.52 46.75 5.90 69.30 56.17 125.50 44.20
Variance 25.94 41.28 0.08 7479.74 6.95 280.50 17.32 280.57 446.70 360.46 127.08
CV 36.84 7.88 6.07 54.05 74.90 35.82 70.54 24.17 37.63 15.13 25.51
skew 1.200 -0.076 1.813 1.959 2.925 2.121 3.668 0.684 2.449 1.000 1.473
Kurt. 1.008 0.773 5.423 3.295 9.651 5.729 15.248 1.668 7.163 0.429 3.180
D 0.159n 0.132n 0.186n 0.248n 0.253Ln 0.200n 0.291Ln 0.199n 0.238n 0.198n 0.147n
N, number of measurements; Min., minimum value; Max., maximum value; Mean ± SD, mean ± standard deviation; CV,: coefficient of variation (%); Skew, skewness; Kurt, kurtosis; D, normality of the data for test of Kolmogorov-Smirnov (P < 0.01, n: normality, and Ln: log-normality).
according to USDA classification (1999). The studied area soil is classified as non- saline (CEe < 98.00 mS m
1
), presenting no problems to the development of the plants and microorganism of the soil.
3756
Afr. J. Agric. Res.
Table 6. Linear correlation matrix between the apparent electrical conductivity (ECa-V and ECa-H) and the chemical properties (ECe, MO, pH, P, K, Ca, Mg, H+Al, SB, CEC and V%) of soil, measured on 23/06/2008.
Log ECa-V 1.000 0.751 0.156 -0.627 0.050 -0.084 -0.018 -0.118 0.066 -0.248 -0.073 -0.318 0.052
Log ECa-H
ECe
OM
pH
P
Log K
Ca
Log Mg
H+Al
SB
CEC
V%
1.000 0.224 -0.446 0.246 0.000 0.214 0.043 0.121 -0.331 0.098 -0.183 0.214
1.000 0.164 0.475 0.515 0.470 0.525 0.565 -0.332 0.585 0.359 0.544
1.000 -0.008 0.372 0.210 0.271 0.024 0.292 0.258 0.547 0.074
1.000 0.033 0.037 0.879 0.850 -0.816 0.861 0.239 0.950
1.000 0.697 0.378 0.265 0.331 0.465 0.813 0.189
1.000 0.171 0.168 0.228 0.307 0.546 0.130
1.000 0.862 -0.554 0.983 0.607 0.927
1.000 -0.670 0.888 0.399 0.904
1.000 -0.519 0.302 -0.794
1.000 0.657 0.917
1.000 0.323
1.000
ECa-V, CEa in vertical dipole; ECa-H, CEa in horizontal dipole; ECe, Electrical conductivity of soil saturation extract; OM: Organic Matter; P, phosphorous; Log K, Potassium logarithmic; Ca, Calcium; Log Mg, Magnesium logarithmic; H+ Al, hydrogen + aluminum; SB, sum of bases; CEC, Cation exchange capacity; V%, percent base saturation.
Table 6 shows a matrix with a linear relation between the apparent electrical conductivity (ECa-V and ECa-H) and the chemical properties (ECe, MO, pH, P, K, Ca, Mg, H+Al, SB, CEC and V%) of soil. ECa values on 3/23/2008 were used because it was the date used for the determination of 40 optimized sampling for the chemical attributes. Electrical conductivity of the saturation extract (ECe, -1 mS m ) presented one low positive relation (Table 6) with the apparent electrical conductivity of the soil measured by electromagnetic induction in the vertical (ECa-V, mS -1 -1 m ) and horizontal dipoles (ECa-H, mS m ); r = 0.156 to ECe x Log ECa-V and r = 0.224 to ECe x Log ECa-H. Corwin and Lesch (2005) found the highest coefficient correlation value of ECe x ECa-V (r = 0.840) and ECe x ECa-H (r = 0.890) at 0.00-1.20 m depth. Slavich and Petterson (1990) and Sharma and Gupta (2000) found correlation values between ECe x ECa-V and ECe x ECaH, similar to that described by Corwin and Lesch (2005). Usually, the ECa values are different from those measured from the saturation extract because they are determined in the field and are influenced by factors such as slope soil, humidity and soil volume. The saturation extract of the electrical conductivity -1 (ECe, mS m ) presents one positive moderate relation with the content of P (r = 0.515), Ca (r = 0.525), Log Mg (r = 0.565), SB (r = 0.585) and V% (r = 0.544). Valente et al (2012) obtained low correlations between EC and soil properties. In this study, the highest correlation coefficients for EC was found in the remaining phosphorus, which had values of 0.447. The relation between ECe x MO (r = 0,164), ECe x pH (r = 0.475) and ECe x K (r = 0.438) was low. The moderate value of the relation coefficient between the exchange
complex elements (P, K, Ca e Mg) was expected, dates that the ECe was an indicator of the salinity of soil, represented in this way the quantity of salt in the solution of the soil. In the present study, there was a positive relation between P x ECe (r = 0.515). Heiniger et al. (2003) also described the content of P as a part of the salinity of the soil, and the agricultural excrement in the soil is due to the degradation of organic matter. The linear relation between MO x Log ECa-V (r = 0.627) is almost a moderate negative and the correlation between the MO x ECa-H (r = -0.446) is classified as low negative. These values are smaller than the others indicated by Kitchen et al. (2003); it was ≥ 0.80 between the organic matter content and the apparent electrical conductivity of the soil (CEa). Linear relation between pH x Log ECa-V (r = 0.050) is null and the relation between pH x Log ECa-H (r = 0.246) is low. Aini et al. (2014), studying the determination of the soil pH value in oil palm plantation based on ECa parameter measured by the soil sensor, found that ECa parameter had a significant negative correlation with soil pH and was highly related to deep ECa at the depth of 15 - 30 cm with R 2 = 0.484. In the present study, the values of relation between K, Ca, Mg with the ECa-V and ECa-H are classified as low: Log K x Log ECa-V (r = -0.018), Log K x Log ECa-H (r = 0.214), Ca x Log ECa-V (r = -0.118), Ca x Log ECa-H (r = 0.043), Log Mg x Log ECa-V (r = 0.066) and Log Mg x Log ECa-H (r = 0.121). Heiniger et al. (2003) described that the presence of low values of relation (r < 0.7) between K, Ca and Mg are indicative of the interaction of other soil parameters above the ECa, such as water content, composition of texture and quantity of the free salt in the soil solution.
Siqueira et al.
3757
Table 7. Fitted semivariogram parameters (Log ECa-V Residual, Log ECa-H Residual, ECe, OM, pH, P, K, Ca, Mg, H+Al, SB, CEC and V%) measured on 6/23/2008.
Variable Log ECa-V Residual Log ECa-H Residual CEe Residual MO Residual pH Residual P Residual Log K Ca Residual Log Mg H+Al Residual SB Residual CEC Residual V% Residual
Unit -1
mS m
-3
g dm -3 mg dm
mmolc dm
%
-3
Model Spherical Spherical Spherical Spherical Spherical Spherical
C0 0.001 0.001 0.001 0.001 0.00 0.00
Spherical Spherical Spherical Spherical Spherical Spherical
0.00 0.00 0.00 0.00 0.00 0.00
C1 0.01 0.05 0.01 35.00 0.07 6500.00 Pure nugget effect 325.00 0.050 320.00 470.00 360.00 135.00
a (m) 130.00 130.00 130.00 130.00 110.00 80.00
SD (%) 9.09 1.96 9.09 0.00 0.00 0.00
100.00 100.00 80.00 100.00 70.00 70.00
0.00 0.00 0.00 0.00 0.00 0.00
C0,: Nugget effect; C1, structural variance; a: range; SD, spatial dependence (%).
The correlation between CEC x Log ECa -V (r = -0.318) and CEC x Log ECa-H (r = -0.183) has low negative. Korsaeth et al. (2005), studying the correlation between CEC x ECa in two areas of study, found low correlations in the Apelsvoll area (NC, USA) (CEC x ECa-V = 0.210 and CEC x ECa-H = 0.290 ) and high correlations in the area of Kise (NC, USA) (CEC x ECa-V = 0.930 and ECa-H x CEC = 0.930). Sudduth et al. (2001) reported for saline soils, that their texture is related more to the ECa than the CEC, justifying the differences in the values of correlation between CEC x ECa found by Korsaeth et al. (2005), and low correlation values found in this study. -3 The potential acidity (H+Al, mmolc dm ), the sum of -3 bases (SB, mmolc dm ) and the percentage of saturation bases (V%) present low values of relation with the apparent electrical conductivity of the soil (ECa-V and ECa-H): H+Al x Log ECa-V = -0.248; H+Al x Log ECa-H = -0.331; SB x Log ECa-V = -0.073; SB x Log ECa-H = 0.098; V% x Log ECa-V = 0.052 and V% x Log ECa-H = 0.214. Table 7 presents the semivariogram parameters adjusted to the soil properties in this study (ECe, MO, pH, P, K, Ca, Mg, H+Al, SB, CEC y V%). All the properties in the study were adjusted in spherical math;n the content of K in the soil presented pure nugget effects. The higher value range (a, m) data were found of MO Waste and ECe waste, which had a value range of 130.00 m. Paz González et al. (2000) studied the spatial variability of cultivated land and other natural vegetation in Gayoso-Castro (Galicia, Spain) in a soil similar to the one found in this study values range (a) for OM around 6.5 m. The remaining properties values range presented in the following order of highest to lowest: pH Waste (110.00 m), Ca Waste (100.00 m), Log Mg (100.00 m), SB Waste (100.00 m), BS Residues (80.00 m), H + Al
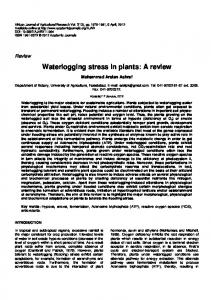
Waste (80.00 m), CEC Waste (70.00 m) and V% waste (70.00) The degree of spatial dependence (GD%) is high for all properties under the study according to the classification of Cambardella et al. (1994). The presence of low nugget effect values (C0) for soil chemical properties match the values found by Paz González et al. (2000) and AlOmran et al. (2013). The spatial variability maps in the properties of the study are presented in Figure 3 (CEe, pH, P and Ca) and 4 (Mg, H+Al, SB, CEC and V%). The spatial variability maps of the matter content (MO, -3 g dm ) show that the higher value of OM is located in the -3 Northeastern area (≥ 84 g dm ). The pH map in the study area demonstrated in the west part of the area presented the lower value ( 4.9), and therefore, the soil is more acidic in this zone. The spatial variability maps (Figures 3 and 4) for other soil chemical element (P, Ca, Mg, SB, CEC, and V%) showed a similar behavior in the distribution of contour lines, there being a rise in values mainly in the northeastern part of the study area. The comparative analysis of P, Ca, Mg, SB, CEC, and V% maps with the electrical conductivity of extract saturation -1 map (ECe, mS m ) demonstrate a similar pattern between soil chemical properties. Several authors (Corwin and Lesch, 2005; Amezketa, 2007; Triantafilis et al., 2009; Neely et al., 2016) have shown strong correlations between the soil electrical conductivity and the electrical conductivity of extract -1 saturation (CEe, mS m ), the content of organic matter -3 (OM, g dm ) and cation exchange capacity (CEC, mmolc -3 dm ); but in this study the greatest correlation coefficient values were found for OM. According to Figure 5, it was not observed spatial similarity among the maps of the apparent electrical conductivity of the soil (ECa-V and ECa-H) and the soil
3758
Afr. J. Agric. Res.
-1
-3
CEe (mS m )
OM (g dm )
4779900
4779900
4779850
4779850
Distancia Distance(Y) X (m)
Distancia X Y (m) (m) Distance
25
4779800 19
4779750
94
4779800 84
4779750 74
13
4779700
4779700
64
7
4779650
4779650 622550
622600
622650
622700
622750
622550
622800
622650
622700
622750
622800
-3
pH
P (mg dm ) 4779900
4779850
4779850
4779800 5.4
4779750
Distancia Y (m) Distance X (m)
4779900
5.9
Distancia Y (m) Distance X(m)
622600
Distance X (m) Distancia X (m)
Distance X (m) Distancia X (m)
380
4779800 280
4779750 180
4.9
4779700
4779700
80
4.4
4779650
4779650 622550
622600
622650
622700
622750
622550
622800
622600
622650
622700
622750
622800
Distancia X (m)
Distance X (m)
Distancia X (m) Distance X (m)
-3
Ca (mmolc dm ) 4779900
4779850
(m) Distance Distancia YX(m)
86
4779800 64
4779750 42
4779700
20
4779650 622550
622600
622650
622700
622750
622800
Distancia X (m) Distance X (m)
Figure 3. Spatial variability maps of the electrical conductivity of soil extract saturation (ECe). Organic Matter (OM), pH, phosphorus (P) and calcium (Ca).
Siqueira et al.
-3
-3
Mg (mmolc dm )
H+Al (mmolc dm )
4779900
4779900
Distancia Y (m) X (m) Distance
Distance X (m)
4779850
Distancia Y (m)
3759
20
4779800 14
4779750
4779850 105
4779800 80
4779750
8
55
4779700
4779700 2
30
4779650
4779650 622550
622600
622650
622700
Distancia X (m)X Distance
622750
622800
622550
(m)
622650
622700
622750
622800
Distancia X (m) Distance X (m)
-3
-3
SB (mmolc dm )
CEC (mmolc dm )
4779900
4779900
4779850
4779850 Distancia YX (m)(m) Distance
Distance X (m) Distancia Y (m)
622600
120
4779800 90
4779750 60
170
4779800 145
4779750 120
4779700
4779700
95
30
4779650
4779650 622550
622600
622650
622700
622750
622550
622800
622600
622650
622700
622750
622800
Distancia X (m) Distance X (m)
Distancia X (m)
Distance X (m)
V% 4779900
Distance Distancia YX (m)(m)
4779850 75
4779800 60
4779750 45
4779700
30
4779650 622550
622600
622650
622700
622750
622800
Distancia X (m) Distance X (m)
Figure 4. Spatial variability maps of the magnesium (Mg), potential acidity (H+Al), sum of bases (SB), Cation exchange capacity (CEC) and percent base saturation (V%)
3760
Afr. J. Agric. Res.
3/14/2008
ECa-V (mS m-1)
ECa-H (mS m-1)
4779900
4779900
4779850
4779850
4779800 13
4779750
15.5
Distancia Y (m) Distance
Distancia Y (m)
Distance
16.5
4779800 13.5
4779750
9.5
4779700
11.5
4779700
6
9.5
4779650
4779650 622550
622600
622650
622700
622750
622550
622800
622600
622650
622700
622750
622800
Distancia X (m) Distance
Distancia X (m)
Distance
4/3/2008
ECa-V (mS m-1)
ECa-H (mS m-1)
4779900
4779900
4779850
4779850
4779800 16
4779750
17
Distance Distancia Y (m)
Distance Distancia Y (m)
19
4779800 14
4779750
13
4779700
11
4779700
8
10
4779650
4779650 622550
622600
622650
622700
622750
622550
622800
622600
622650
622700
622750
622800
Distance Distancia X (m)
Distance Distancia X (m)
6/23/2008
ECa-V (mS m-1)
ECa-H (mS m-1)
4779900
4779900
4779850
4779850 20
14
4779750
Distance Distancia Y (m)
Distance Distancia Y (m)
18
4779800
4779800 16
4779750
10
4779700
12
4779700 6
4779650
8
4779650 622550
622600
622650
622700
622750
622800
Distance Distancia X (m)
Figure 5. Spatial variability maps of the ECa-V and ECa-H in different sample dates.
622550
622600
622650
622700
Distance Distancia X (m)
622750
622800
Siqueira et al.
chemical properties maps (Figures 3 and 4). Conclusion The electrical conductivity of the extract saturation (ECe, -1 mS m ) presented a positive moderate relation with the content of P (r = 0.515), Ca (r = 0.525), Log Mg (r = 0.565), SB (r = 0.585) and V% (r = 0.544). The moderate negative correlation coefficient was found between the Log ECa-V and the organic matter. Both ECa-H and ECaV exhibited comparatively low correlations with the soil chemical properties. The moderate negative correlation coefficient was found between the Log ECa-V and the organic matter. Conflict of Interests The authors have not declared any conflict of interests. ACKNOWLEDGMENTS The authors are grateful to the Ministry of Foreign Affairs and Cooperation (MAEC-AECID), Spain for the granting of scholarships for Ph.D. studies. This work has been funded by the Ministry of Education and Science, within the framework of research Projects CGL200508219-C0202 and CGL2009-13700-C02-02, co-funded by Galicia Xunta, within the framework of research project PGIDIT06PXIC291062PN and by the European Regional Development Fund (ERDF). The authors would like to thank SECTI (Secretariat of Science, Technology and Innovation of Maranhão) and FAPEMA (Maranhão Foundation for the Protection of Research and Scientific and Technological Development, Brazil) financial support for publication (APCINTER-02587/14, BATI-02985/14, UNIVERSAL-00735/15, BEPP-01301/15, APEC 01697/15, BM-01267/15 and BD-01343/15). REFERENCES Aini IN, Ezrin MH, Aimrun W (2014). Relationship between Soil Apparent Electrical Conductivity and pH Value of Jawa Series in Oil Palm Plantation. Agric. Agric. Sci. Proceed. 2:199-206. Al-Omran AM, Al-Wabel MI, El-Maghraby SE, Nadeem ME, Al-Sharani S (2013). Spatial variability for some properties of the wastewater irrigated soils. J. Saudi Soc. Agric. Sci. 12:167-175. Amezketa E (2007). Soil salinity assessment using directed soil sampling from a geophysical survey with electromagnetic technology: a case study. Span. J. Agric. Res. 5(1):91-101. Ayres M, Ayres Jr M, Ayres DL, Santos AA (2007). BioEstat: aplicações estatísticas nas áreas das ciências biológicas e médicas. Belém; Sociedade Civil Mamirauá: MCT-CNPq. Bronson KF, Booker JD, Officer SJ, Lascano RJ, Maas SJ, Searcy SW, Booker J (2005). Apparent Electrical Conductivity, Soil Properties and Spatial Covariance in the U.S. Southern High Plains. Precis. Agric. 6:297-311. Cambardella CA, Mooman TB, Novak JM, Parkin TB, Karlem DL, Turvo RF, Konopa AE (1994). Field scale variability of soil properties in central Iowa soil. Soil. Sci. Soc. Am. J. Madison 47:1501-1511.
3761
Corwin DL, Lesch SM (2005). Apparent soil electrical conductivity measurements in agriculture. Comput. Electron. Agr. 46:11-43. Costa MM, Queiroz DM, Pinto FAC, Reis EF, Santos NT (2014). Moisture content effect in the relationship between apparent electrical conductivity and soil attributes. Acta Sci. Agron. 36:395-401. Doerge T, Kitchen NR, Lund ED (2004). Soil electrical conductivity mapping. Site-Specific Management Guidelines. N.30. http://www.ppi-far.org/ssmg Doolittle JA, Brevik EC (2014). The use of electromagnetic induction techniques in soils studies. Geoderma 223-225:33-45. Paz González A, Vieira SR, Taboada Castro MT (2000). The effect of cultivation on the spatial variability of selected properties of an umbric horizon. Geoderma 97:273-292. Heil K, Schmidhalter U (2012). Characterisation of soil texture variability using the apparent soil electrical conductivity at a highly variable site. Comput. Geosci. 39:98-110. Heiniger RW, Mcbride RG, Clay DE (2003). Using Soil Electrical Conductivity to Improve Nutrient. Manage. Agron. J. 95:508-519. Juan P, Mateu J, Jordan MM, Mataix-Solera J, Meléndez-Pastor I, Navarro-Pedreño J (2011). Geostatistical methods to identify and map spatial variations of soil salinity. J. Geochem. Explor. (USA) 108:62-72. Kitchen NR, Drummond ST, Lund ED, Sudduth KA, Buchleiter GW (2003). Soil Electrical Conductivity and Topography Related to Yield for Three Contrasting Soil–Crop Systems. Agron. J. 95:483-495. Korsaeth A (2005). Soil apparent electrical conductivity (ECa) as a means of monitoring changes in soil inorganic N on heterogeneous morainic soils in SE Norway during two growing seasons. Nutr. Cycl. Agroecosyst. 72:213-227. Machado FC, Montanari R,Shiratsuchi LS, Lovera LH, Lima ES (2015). Spatial Dependence of Electrical Conductivity and Chemical Properties of the Soil By Electromagnetic Induction. R. Bras. Ci. Solo 39:1112-1120. McNeill JD (1980). Electromagnetic terrain conductivity measurements at low induction numbers. Technical Note, TN-6, Geonics Ltda, Ontario 15 p. Molin JP, Rabello LM (2011). Estudos sobre a mensuração da condutividade elétrica do solo. Eng. Agríc. 31:90-10. Molin JP, Gimenez LM, PaulettI V, Schmidhalter U, Hammer J (2005). Mensuração da condutividade elétrica do solo por indução e sua correlação com fatores de produção. Eng. Agríc. 25:420-426. Molin, JP, Faulin GDC (2013). Spatial and temporal variability of soil electrical conductivity related to soil moisture. Sci. Agric. 70:15. Morari F, Castrignanò A, Pagliarin C (2009). Application of multivariate geostatistics in delineating management zones within a gravelly vineyard using geo-electrical sensors. Comput. Electron Agr. 68:97107. Neely HL, Morgan CLS, Hallmark CT, McInnes KJ, Molling CC (2016). Apparent electrical conductivity response to spatially variable vertisol properties. Geoderma 263:168-175. Raij BV, Andrade JC, Cantarella H, Quaggio JA (2001). Análise química para avaliação da fertilidade de solo tropicais. Campinas: Instituto Agron. 285 p. Rodrigues MS, Corá JE, Fernandes C (2012). Soil sampling intensity and spatial distribution pattern of soils attributes and corn yield in notillage system. Eng. Agric. 32:852-865. Saey TM, Van Meirvenne M, Vermeersch H, Ameloot N, Cockx L (2009). A Pedotransfer function to evaluate the soil profile textural heterogeneity using proximally sensed apparent electrical conductivity. Geoderma 150:389-395. Schueller JK (2000). A Agricultura de precisão: visão externa. O estado-da-arte da agricultura de Precisão nos Estados Unidos. In: BALASTREIRE, L. A. (Ed.) O estudo da arte da agricultura de precisão no Brasil. ESAQ-USP. Piracicaba pp. 8-16. Sharma DP, Gupta SK (2000). Application of EM38 for soil salinity appraisal: an Indian experience. In: EM38 Workshop, New Delhi, India 15 p. Siqueira GM, Silva EFF, Dafonte JD (2015). Spatial distribution of soil apparent electrical conductivity measured by electromagnetic induction and sugarcane yield. Bragantia 74:215-223. Siqueira GM, Vieira SR, Ceddia MB (2008). Variabilidade de atributos físicos do solo determinados por métodos diversos. Bragantia
3762
Afr. J. Agric. Res.
67:203-211. Slavich PG, Petterson GH (1990). Estimating Average Rootzone Salinity from Electromagnetic Induction (EM-38) Measurements. Aust. J. Soil. Res. 28:453-463. Stadler A, Rudolph S, Kupisch M, Langensiepen S, Van der Kruk J, Ewert F (2015). Quantifying the effects of soil variability on crop growth using apparent soil electrical conductivity measurements. Eur. J. Agron. 64:8-20. Sudduth KA, Kitchen NR, Wiebold WJ (2005). Relating apparent electrical conductivity to soil properties across the north-central USA. Comput. Comput. Electron Agric. 43:263-283. Tragsa (2009). Terra Chá. 5p. Accessing in 20 of June of 2009: http://redrural.tragsatec.es/redrural/fichas/GA11.pdf Valente DSM, Queiroz DM, Pinto FAC, Santos NT, Santos FL (2012). The relationship between apparent soil electrical conductivity and soil properties. Rev. Cienc. Agron. 43:683-690. Vieira SR, Millete J, Topp GC, Reynolds WD (2002). Handbook for geoestatistical analysis of variability in soil and climate data. In Alvarez, V.V.H., schaefer, C.E.G.R., Barros, N.F., Mello, J.W.V., Costa, J.M. (Eds.), Tópicos em Ciência do Solo. Viçosa: Soc. Bras. Ciênc. Solo 2:1-45.
Vitharana UWA, Saey T, Cockx L, Simpson D, Vermeersch H, Van Meirvenne M (2008). Upgrading a 1/20,000 soil map with an apparent electrical conductivity survey. Geoderma 148:107-112. Wait JR (1962). A note on the electromagnetic response of a stratifi ed earth. Geophysics 27:382-385. Warrick AW, Nielsen DR (1980). Spatial variability of soil physical properties in the field. In: HILLEL D. Applications of soil physics. New York: Academic Press.