Department of Computer Science and Applications,The Gandhigram Rural Institute â Deemed University,. Gandhigram â 624302, Tamilnadu, India.
ICGST-GVIP Journal, Volume 10, Issue 3, August 2010
Fully Automatic method to Identify Abnormal MRI Head Scans using Fuzzy Segmentation and Fuzzy Symmetric Measure K. Somasundaram and T.Kalaiselvi Department of Computer Science and Applications,The Gandhigram Rural Institute – Deemed University, Gandhigram – 624302, Tamilnadu, India. [ka.somasundaram, kalaivpd]@gmail.com
Abstract
1. Introduction
In this work we have proposed an automatic method to analyze the MRI head scans and detect abnormality in brain due to tumors. We make use of the bilateral symmetry of the human brain. We use T2 axial scans as they are highly sensitive to pathological process. Tumors appear as hyper intense in T2 scans and have intensity close to that of cerebrospinal fluid (CSF). For normal slices, CSF is symmetrical about the vertical central line. So the presence of abnormal tissues in the CSF class can be detected by measuring the vertical symmetry of the CSF image. Our method has four parts. First, the brain is extracted from head using brain extraction algorithm (BEA) and used to detect the boundary between the cerebral hemispheres (CH). Next a slice transformation has been done to align it with the world space for bilateral symmetry checking. Then, a fuzzy segmentation is done to generate a CSF image. Finally a fuzzy symmetric measure (FSM) is calculated for CSF image to discriminate between normal and abnormal scans. Experiments using our method were done on 20 volumes of normal and abnormal datasets. Two measures, false alarm (FA) and missed alarm (MA) were used to quantify the performance of our method and found to be very less, 3% and 6% respectively. These measures were also used to compare our method with that of existing methods. The mean FA is lower than the existing methods. However the MA is higher, and is due to the tumors present symmetrically about the vertical central line.
Imaging plays an important role in diagnosing of brain tumors. Magnetic Resonance Imaging (MRI) is well suited for monitoring and evaluating cerebral tumors. In MRI, they appear either as hypo-intense (darker than brain tissues) or as iso-intense (same intensity as brain tissue) in T1-weighted scans and as hyper-intense (brighter than brain tissues) in T2weighted scans [1, 2]. The perifocal edema also appears as hyper-intense in T2-weighted scans. Since T2–weighted images are very sensitive in detecting brain pathology, patients with suspected intracranial disease should be first screened with T2-weighted spin-echo and FLAIR images [3]. If an abnormality is found then additional scans are taken to characterize the lesion. As per the brain screening protocol suggested by Hasselink [3], T1 images need to be taken only if T2 images show abnormalities. Tumors appear as hyper-intense in T2 scans and have intensity close to that of CSF. In normal slices, the CSF is symmetric about the vertical central line. Therefore, if any abnormal tissue is present in the CSF, the symmetry is disturbed. This can be detected by measuring the symmetry of the CSF about the vertical central line [1]. Several methods have been developed to automate the brain tumor localization, analysis, segmentation and visualization [1, 4-18]. Khotanlou et al., [4] and Wang et al, [5] have given a summary of existing methods and discussed their strengths and weaknesses. Some of the methods are semiautomatic and require user interaction either to initiate or adjust the result [9-11]. Some methods are atlas-based [14-16] and require predefined atlas. Few methods require multi-channel images (T1, T2,
Keywords: hyper intense, bilateral symmetry, brain extraction, fuzzy segmentation, fuzzy symmetric measure, false alarm, missed alarm.
1
ICGST-GVIP Journal, Volume 10, Issue 3, August 2010
checking is done about the boundary line separating the CHs. Liang et al [19] defined that the boundary between the CHs must lie within the interhemispheral fissure (IHF). IHF is a deep cleft and a longitudinal fissure between the CH and is filled by CSF. Our method detects the boundary that corresponds to IHF using the contour of brain. We used our brain extraction algorithm (BEA) [20] to extract the brain from T2 MR scans and is named as T2-BEA. T2-BEA perfectly extracted the entire brain even if they are separated by fissures [20]. It also eliminated the non-brain tissues like eye and scalp even if they have the similar intensities to brain tissues. The performances of the T2-BEA is found to be better than the well known existing BEAs, brain extraction tool (BET) [21] and brain surface extractor (BSE) [22]. Using the brain contour, an intelligent system is developed to join the edges of the cleft that corresponds to IHF present in the contour [23]. Our system worked successfully on several normal and abnormal 2D slices. This system will be useful for further processing like tissue segmentation, image compression, registration [24] and bilaterally symmetry analysis procedures [23]. The detected boundary is then aligned with central vertical line for symmetry checking. The symmetry of the CSF segmented from the brain portion is checked by using fuzzy symmetry measure (FSM). The remaining part of this paper is organized as follows. In section 2, the materials used in our experiment are given. In section 3 an overview of the method used is discussed. The results and discussions presented in section 4. The conclusion is given in section 5.
PD and contrast enhanced images) [1, 17, 18] which are not always available in clinical routine. Some methods use symmetry property of brain tissues to segment the tumor [4, 5, 12]. Some methods use features like edges, gray values and local contrast of pixels within a block for identifying tumorous characteristics [6-8, 13]. The block-based analysis is a time consuming process for a decision support system. Generally, most tumor segmentation methods have two stages. Stage one is initialization that roughly locate the tumor and the second stage refine the rough result and produce the whole tumor. Khotanlou et al., [4] proposed a 3D method for T1 images. They use two alternate approaches to detect the initial position of the tumor in stage-1. The first one is a fuzzy classification method that classifies the brain into 5 classes, CSF, WM, GM, tumor and background. Then a sequence of morphological operations is performed to classify the tumor from the tumor class. The second approach is based on symmetry analysis of gray level histograms of normal hemisphere and pathological hemisphere. In their method a user interaction is required to select the pathological hemisphere. The fully automatic fuzzy classification method is applicable only to hyper-intense nature of tumors whereas the semiautomatic symmetry analysis method is applicable to tumors that are localized in one hemisphere only. In stage-2, a deformable model to refine the initial tumor segmentation is used. A tumor detection method developed by Wang et al [5] is also based on symmetry property of the brain. It uses a symmetry measure, calculated between the gray level histogram of the two cerebral hemispheres (CH), to classify the slice as normal or abnormal. Both the aforesaid methods are applicable to cerebrum tumors and use the gray level histograms of the CHs for symmetry analysis. Both of the methods need either a user interaction or employ a complex function to initialize the process. In this paper, we present a knowledge-based paradigm that combines the feature extraction, image processing algorithms, graphics and fuzzy techniques to produce an unsupervised system capable of detecting the abnormality automatically in T2-weighted MRI scans. If an asymmetry is found in a slice then there is more likely a tumor to be present in it [12]. In axial orientation, the upper slices corresponding to cerebrum are approximately symmetrical bilaterally. Hence our algorithm is suitable to the cerebrum abnormalities, especially caused by single tumor. The bilateral symmetry
2. Materials
Twenty datasets of normal and abnormal subjects were used in our experiments. The details of the datasets are given in Table 1. The first ten datasets (v01-v10) consisting of 2 normal volumes and 8 abnormal volumes with brain tumor (Neoplastic disease) and multiple sclerosis were taken from the website ‘The Whole Brain Atlas’. The remaining ten datasets (v11-v20) were taken from KGS Scan Centre, Madurai, India, which were acquired from 1.5T Siemens machine for 8 normal subjects and 2 abnormal subjects affected by tumors. The dimension of each slice in volumes v01-v10 is 256 × 256 pixels and slice thickness varying from 25mm with 260mm field of view. So the pixel dimension is fitted to 1 × 1 mm. The slices taken from 1.5T Siemens machines have a dimension of 448 × 512 pixels and 5mm thickness (except v18: 3mm) with 40-50% inter-slice gap. The field of view
2
ICGST-GVIP Journal, Volume 10, Issue 3, August 2010
is fixed to 210 × 240 mm and hence the pixel dimension is set to 0.47x0.47 mm. Naturally, the voxel dimension is in anisotropic form in all our datasets. Data set 1 2 3 4 5
6
7 8 9 10 11 12 13 14 15 16 17 18 19 20
Table 1: Details of Datasets used Volume Gender Age Clinical Identity v01 Female 81 Normal v02 Female 76 Normal v03 Female 51 Anaplastic Astrocytoma v04 Male 35 Astrocytoma v05 Male 62 Metastatic adeno carcinoma v06 Female 42 Metastatic bronchogenic carcinoma v07 Male 75 Meningioma v08 Male 22 Sarcoma v09 Male 30 Multiple Scelerosis v10 ----Multiple Scelerosis v11 Female 18 Normal v12 Female 19 Normal v13 Male 43 Normal v14 Female 32 Normal v15 Male 45 Normal v16 Male 51 Normal v17 Female 39 Normal v18 Male 43 Normal v19 Female 55 Tumor v20 Male 38 Tumor
and GM regions. The presence of abnormal tissues in the CSF class can be detected by measuring the vertical symmetry of the CSF image. FSM is used as a threshold to discriminate between normal and abnormal CSF images. The Y axis of the Cartesian coordinate system is used as the vertical axis with origin at the centre of each slice. Our method comprise of a sequence of four processes as given below.
Total slices 54 43 56
1. 2. 3. 4.
29 24
Brain extraction Slice transformation Tissue segmentation Abnormality checking
24
3.1. Brain Extraction Numerous brain extraction algorithms (BEA) are available in literature [25, 26]. Our T2-BEA [20] makes use of anisotropic diffusion process [27], optimal thresholding and morphological processes [28] to separate the brain from non-brain portions. The diffusion process is used to highlight the brain from T2 head scan. Then an intensity threshold is computed using which a rough binary brain portion is generated. The morphological operations, erosion and dilation, and connected component analysis are then performed on the rough brain portion to produce the brain mask. Finally the brain mask is used to extract the brain from T2 scans. Then we find the boundary between CHs that corresponds to IHF. An intelligent system is used [23] to detect the edges of the IHF present in the extracted brain. In each 2D axial slice, edge1 is marked at the nadir of the upper portion of cleft and edge2 is fixed at the zenith of the lower portion of cleft. Then a line is drawn by joining these two edges that corresponds to the boundary line passing through IHF.
27 24 24 54 19 19 19 19 19 19 19 19 19 19
3. Method Overview
In MR images, some of the non-brain tissues like fat, skin, muscles and background clutters have nearly the same intensity as that of tumors. Therefore the brain portion should be extracted first to eliminate these non-brain tissues. The extracted brain contour is used to detect the line separating the cerebral hemispheres. This linear boundary corresponds to IHF. When an MRI is acquired, the head position sometimes may not coincide with the world coordinate of the image acquisition system. There may be a tilt in the acquired image. To perform the symmetry test for the CSF in MRI, the tilt has to be corrected. For this a slice transformation is done. The structural arrangement of the whole brain is similar on the both side of hemisphere and is symmetrical about the vertical axis through the brain center. Tumors appear hyper intense in T2 scans and have intensity close to that of CSF. The transformed brain is segmented into four major classes WM, GM, CSF and background. This segmentation is useful to retain the cluster containing CSF and tumor and to remove the WM
3.2. Slice Transformation The detected boundary line is used to transform the MRI scans to the ideal world co-ordinate, here the Cartesian co-ordinates system. The line corresponding to IHF is aligned with the vertical central line, Y-axis of the Cartesian coordinate system. This alignment is done by composite transformation of translation followed by rotation. The mapping procedure (M) to move from the imaging coordinates (IC) to world coordinates (WC) is given by: MWC, IC
3
= R(90-θ) . T(d) (1)
ICGST-GVIP Journal, Volume 10, Issue 3, August 2010
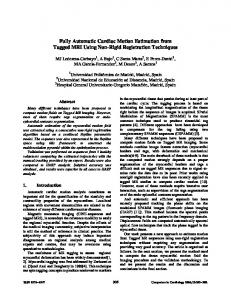
where T(d) is the translation matrix to map the origin of two coordinate systems, R is the rotation matrix that align the boundary line with Y axis, d is the translation distance along the horizontal (X) axis and θ, the angle of deviation of boundary line about the X axis. The value (90- θ) gives the required rotation angle to fix the line with the vertical (Y) axis. The angle θ is calculated as:
90-θ
θ = tan-1(m)
(2)
where m is the slope of the line. The transformation of the image shown in Fig.1(a) to world co-ordinate is shown in Fig.1(b).
θ
d
Figure 1: (a) MR scan with detected boundary (in dotted white color) and Cartesian coordinate system with centre as origin (in light gray color) (b) Transformed image with coordinates θ and d
3.3. Tissue segmentation The extracted brain is segmented into four major classes WM, GM, CSF and background using fuzzy c-means (FCM) algorithm. FCM utilizes the fuzzy theory and is suitable for the anisotropic nature of volumes that are affected by PVE [29-31]. This method is frequently used in pattern recognition and never misses a region [32, 33]. The aim of using FCM is to find cluster centers that minimize a dissimilarity (objective) function given by: Jm =
n
c
∑∑ i =1 j =1
u ijm d ij ,
1
u ij =
⎡ d ij ⎤ ⎥ k =1 ⎣ ik ⎦ c
∑ ⎢d n
cj =
∑u i =1 n
∑u i =1
(3)
m ij
2 m −1
,
(4)
.
(5)
xi
m ij
This procedure will stop if the improvement of the objective function over the previous iteration is below a threshold value, ε ∈ 1,0 . By iteratively
m ∈ [1, ∞] is a weighting exponent, u ij ∈ [1,0] is the degree of membership xi in the
where
[ ]
updating the cluster centers and the membership grades for each data point, FCM iteratively moves the cluster centers to the “right” location within a data set.
cluster j, xi is the ith element of d-dimensional measure data, cj is the d-dimensional center of the cluster and dij is the Euclidean distance between ith data point (xi) and jth centroid (cj). The fuzzy portioning is carried out through an iterative optimization of the objective function given in equation (3), with the update of membership uij and the cluster centers cj using:
The FCM algorithm as proposed by Bezdek [32] is:
4
ICGST-GVIP Journal, Volume 10, Issue 3, August 2010
calculated and compared with the existing method predictive cognitive system for brain images (PCB). Three successive versions of PCB, v.1, v.2 and v.3 [68] were used to compare our results.
Step 1: Randomly initialize the membership matrix U = [uij], U(0) that has a constraint equation given by c
∑u i =1
ij
= 1, ∀j = 1,..n ,
(6)
4. Results and Discussions
Step 2: At the kth step, calculate the centroids and objective function by using the equations (5) and (3) respectively. Step 3: Update U(k), U(k+1) by using the equation (4) . Step 4: If stopping criteria ( ε ≤ 0.00001 ) is met then stop; otherwise return to Step 2.
Our method is implemented in Matlab 6.5 and tested on the images chosen from the material pool. The experiments were performed in a 1.73 GHz Intel Pentium dual-core processor, Windows XP with 1GB RAM. The processing time taken by our method is approximately 3 sec / slice. Initially the qualitative performance of methods on original MR scan is done. The sequence of images obtained by using our procedure for a sample slice is shown in Fig.2. The brain portion of the original image (Fig.2(a)) extracted by our T2BEA is given in Fig.2(b). The boundary line between the CHs that is detected by our intelligent system is shown in Fig.2(c) along with the Cartesian space. The deviation of the boundary line from the world space and corrected by the composite transformation and the transformed image is shown in Fig.2(d). The CSF regions segmented by FCM algorithm is given in Fig.3. The central vertical line shown in Fig.3 is used to check the fuzzy symmetry between the CSF regions present on either side of it.
Then a binary image of CSF is created by removing the other regions like WM and GM. In that CSF image the foreground (in white) indicates the region of CSF and background is in black color. 3.4. Abnormality Checking Abnormal tissues in the CSF class can be detected by measuring the symmetry of the CSF image. Here the symmetry is computed by the fuzzy symmetric measure (FSM) [34] given by: FSM(csfs)
=
1 ⎛ n − nR ⎞ 1+ ⎜ L ⎟ ⎝ 100 ⎠
2
(7)
where nL and nR are the number of foreground (white) pixels in the left and right half of the CSF image present at either side of the central vertical line (Y axis) of slice s. The symmetry values calculated from normal CSF classes are generally much larger than 0.1, and the values for abnormal CSF classes are much smaller than 0.1 [1]. We fix 0.05 as a threshold value to FSM. If FSM(csfs) < 0.05 then the slice s is abnormal otherwise it is a normal slice. The threshold value 0.05 was obtained after doing several experiments on both normal and abnormal scans. The 4-step procedure is applied to all the slices and are marked them as normal or abnormal. 3.5. Evaluation parameters Both qualitative and quantitative validations were used for the performance evaluation. The qualitative evaluation is simply the visual inspection of the result done by the experts in the field. For quantitative study, false alarm (FA) and missed alarm (MA) parameters were used. False alarm is an indication when the input scan which does not have a tumor is marked as abnormal during analysis [8]. Missed alarm is an indication when an abnormal image is not marked so during the analysis. The percentage of such parameter per dataset is
Figure 2: (a) Original T2-w scan (b) Extracted brain portion by T2BEA (c) Standard space (light grey lines) and boundary between the cerebral hemisphere (white dotted line) (d) Transformed image to standard space
5
ICGST-GVIP Journal, Volume 10, Issue 3, August 2010
versions of PCB. Out of eight data sets, our method produced FA only for 2 sets whereas PCB produced 4 or more datasets. However the MA in our proposed method is higher than the v.2 and v.3 and lower than v.1 of PCB. The higher value of MA in our method is due to equally scattered characteristics of tumor or hypo-intense nature of tumors. So they are completely missed in datasets v05 and partially in v06, v07 and v08.
5. Conclusion
We have developed a fully automatic system which can rapidly classify the given MRI data sets into normal and abnormal. Our method is purely based on intensity and is applicable to MR images with single mass effect present within a hemisphere. Out of 8 abnormal data sets our method was able to detect the abnormality in 6 and produced false alarm only for 2 data sets, when compared to 4 in PCB. This work is currently extended to segment the tumors and to compute the volume.
Figure 3: CSF image with CSF regions (white) and central vertical line (light grey) for symmetry checking
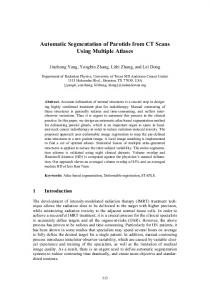
The qualitative validation of our method was done by four experts. The outputs produced by T2-BEA, standard space alignment, segmentation of CSF regions and their symmetry comparison along central vertical line were approved by the experts. They further suggested that identifying the abnormality in MRI head scans might be useful to quicken the diagnosis and prognostic processes for single tumor or mass effect present in either of the hemispheres. The quantitative parameters, FA and MA, calculated for 2 normal and 6 abnormal datasets are given in Table 2. FA for the proposed system is obtained only for v04 and v06 due to the swelling edema. This effect narrowed down the sulci at higher levels and thus reduced the cerebral CSF as shown in Fig.4(a) and (b). This is also reflected in FSM of CSF and recognized them as abnormal slices. Missed alarm is obtained for v05, v06, v07 and v08. In v05, the lesion is characterized by low signal on T2 image with very little surrounding edema (Fig.4(c)). Hence they are missed by the FSM calculation. In v06, the end of lesion is represented by small region and thus missed by FSM. The lesion in v07 and v08 is equally scattered on both sides as shown in Fig.4(d) and thus missed by the FSM calculation. None of the alarm has been noticed for the normal volumes. The values of FA and MA calculated by our method along with that of the PCB are given in Table 3. The FA indication in our method is lower than all the
Acknowledgement
The authors wish to thank Dr. K.G. Srinivasan M.D., R.D., Consultant Radiologist, KGS Advanced MR & CT Scan, Madurai, Tamilnadu, India and Dr. N. Karunakaran DMRD., DNB., Consultant – Radiodiagnosis, Meenakshi Mission Hospital and Research Centre, Madurai, Tamilnadu, India for providing the MRI Head scans and for giving the qualitative validation. The authors would also wish to thank Dr. K. Selvamuthukumaran M.Ch. (Neuro), Sr. Consultant, Department of Neuro Surgery, Meenakshi Mission Hospital and Research Centre, Madurai, Tamilnadu, India and Dr.S.P.Balachandran,M.D.,D.M., (Neuro), Neurologist, Dindigul Neuro Centre, Dindigul District, Tamilnadu, India for their help in verifying the results. This work is catalysed and funded by Science for Equity, Empowerment and Development (SEED) Division, Department of Science and Technology (DST), Government of India, New Delhi, Grant number: SP/YO/011/2007 under the Scheme for Young Scientists and Professionals (SYSP).
6
ICGST-GVIP Journal, Volume 10, Issue 3, August 2010
(a)
(c)
(b)
(d)
Figure 4: Slices corresponds to false alarm (a and b) and missed alarm (c and d) (a) slice from vo4, affected by intracranial hypertension at right side of hemisphere (b) slice from v06, affected by intracranial hypertension at lower right side of hemisphere (c) slice from v05 with low signal tumor (d) slice from v07 with equally scattered lesion
No. 1. 2. 3. 4. 5. 6. 7. 8.
No. 1. 2. 3. 4. 5. 6. 7. 8.
Table 2: Performance of our method in terms of FA and MA Abnormal Slices FA MA Total Volume Slice Actual Detected Slices % Slices v01 54 0 v02 43 0 v03 56 25-45 25-45 0 v04 29 11-20 11-24 21-24 13 v05 24 15-17 0 15-17 v06 24 4-15 4-14,16-19 16-19 13 15 v07 27 11-16 11-14 0 15,16 v08 24 10-20 10-12,19,20 0 13-18 Average Performance 3
% 0 0 0 0 13 4 7 25 6
Table 3: Comparison of FA and MA obtained in our method with that of PCB (v.1, v.2 and v.3) FA (%) MA (%) Total Volume Slice PCB v.1 PCB v.2 PCB v.3 Proposed PCB v.1 PCB v.2 PCB v.3 Proposed v01 54 11 11 0 0 v02 43 10 23 0 0 v03 56 0 5 0 0 24 0 0 0 v04 29 25 8 7 13 48 5 5 0 v05 24 37 27 17 0 50 17 11 13 v06 24 5 5 0 13 28 0 0 4 v07 27 19 15 7 0 33 3 0 7 v08 24 14 19 9 0 25 4 4 25 Average 15 14 5 3 26 4 3 6
[5] Wang Z., Hu Q., Loe K., Aziz A., and Nowinski W.L., Rapid and Automatic Detection of Brain Tumors in MR Images, Proceedings of SPIE, Bellingham, WA, vol., 5369, pp. 602-612, 2004. [6] Lau P.Y., and Ozawa S., PCB: A Predictive System for Classifying Multimodel Brain Tumor Images in an Image-Guided Medical Diagnosis Model, Proceeding of the 12th International Conference on Intelligent System for Molecular Biology, Glasgow, UK, 2004. [7] Lau P.Y., and Ozawa S., A Region- and ImageBased Predictive Classification System for Brain Tumor Detection, Proceeding of Symposium on Biomedical Engineering, Hokkaido, Japan, pp. 72-102, 2004. [8] Lau P.Y., and Ozawa S., A Multiparameter Hierarchical Representation using Region-Based Estimation Model For Detecting Tumor in T2Weighted MRI Brain Images, Malaysian Journal
References
[1] Clark M.C., Hall L.O., Goldgof D.B., Velthuizen R., Murtagh F.R., and Silbiger M.S.,Automatic Tumor Segmentation using Knowledge-Based Technique, IEEE Transaction on Medical Imaging, vol. 17, no. 2, pp. 187-201, 1998. [2] Thamburaj A.V., Neurology and Systemic Malignance, Apollo Hospital, Chennai,India, http://www.thamburaj.com/cns_systemic_malign ancy.htm, 2009. [3] Hesselink J.R., Basic Principles of MR Imaging, Department of Radiology, University of California, http://spinwarp.ucsd.edu/NeuroWeb/Text/br100.htm, 2009. [4] Khotanlou H., Colliot O., Atif J., and Bloch I., 3D Brain Tumor Segmentation in MRI using Fuzzy Classification, Symmetry Analysis and Spatially Constrained Deformable Models, Fuzzy Sets and Systems, vol. 160, pp. 1457-1473, 2009.
7
ICGST-GVIP Journal, Volume 10, Issue 3, August 2010
[20]Somasundaram K., and Kalaiselvi T., Fully Automatic Brain Extraction Algorithm for Axial T2-Weighted Magnetic Resonance Images, Submitted after II revision to Computers in Biology and Medicine, 2010. [21] Smith S.M., Fast Robust Automated Brain Extraction, Human Brain Mapping, vol.17, pp. 143-155, 2002. [22] Shattuck D.W., Sandor-Leahy S.R., Schaper K.A., Rottenberg D.A., Leahy R.M., Magnetic Resonance Image Tissue Classification Using a Patrial Volume Model, NeuroImage, vol. 13(5), pp. 856-876, 2001. [23]Somasundaram K., and Kalaiselvi T., A Novel Technique for Finding the Boundary between the Cerebral Hemispheres from MR Axial Head Scans, Proceeding of The 4th Indian International Conference on Artificial Intelligence – IICAI-09, Tumkur, Bangalore, India, pp. 597-603, December 16-18, 2009. [24] Zaidi H., Montandon M.L. and Slosman D.O., Magnetic Resonance Imaging-Guided Attenuation and Scatter Corrections in ThreeDimensional Brain Positron Emission Tomography, Medical Physics, vol. 30, no. 5, pp. 937-948, 2003. [25] Segonne F., Dale A. M., Busa E., Glessner M., Salat D., Hahn H. K. and Fischl B., A Hybrid Approach to the Skull Stripping Problem in MRI, NeuroImage, vol. 22, pp. 1060-1075, 2004. [26] Somasundaram K., and Kalaiselvi T., Brain Extraction Method for T1 Magnetic Resonance Scans, Accepted in IEEE International Conference on Signal Processing and Communication - SPCOM2010, Indian Institute of Sciences (IISc), Bangalore, India, July 18-21, 2010. [27] Perona P., and Malik J., Scale-Space and Edge Detection using Anisotropic Diffusion, IEEE Trans. on Pattern Analysis and Machine Intelligence, vol.12, no.7, pp.629-639, 1990. [28]Sonka M., Hlavac V., and Boyle R., Image processing, Analysis and Machine Vision, II Edition, Brooks / Cole Publishing Company, Pacific Grove, CA, 1999. [29] Harris G., Andreasen N.C., Cizadlo T., Bailey J.M., Bockhold H.J., Magnotta V.A. and Arndt S., Improving Tissue Classification in MRI: A ThreeDimensional Multispectral Discriminant Analysis Method with Automated Training Class Selection, Journal of Computer Assisted Tomography, vol. 23, no. 1, pp. 144-154, 1999. [30] Yang M.S., Hu Y.J., Lin K.C.R. and Lin C.L.L., Segmentation Techniques for Tissue
Of Computer Science, vol. 18, no. 1, pp. 1-19, 2005. [9] Jiang C., Zhsng X., Huang W., and Meinel C., Segmentation and Quantification of Brain Tumor, IEEE International Conference on Virtual Environment, Human-Computer Interfaces and Measurement Systems – VECIMS 2004, Boston, USA, PP. 12-14, July 2004. [10] Kaus M.R., Warfield S.K., Nabavi N., Black P.M., Jolesz F.A., and Kikinis R., Automated Segmentation of MR Images of Brain Tumors, Radiology, vol. 218, pp. 586-591, 2001. [11] Xie K., Yang J., Zhang Z.G., and Zhu Y.M., Semi Automated Brain Tumor and Edema Segmentation using MRI, European Journal of Radiology, vol. 56, pp. 2219-2233, 2003. [12] Mancas M., Gosselin B., and Macq B., Fast and Automatic Tumoral Area Localization Using Symmetry, Proceedings of IEEE ICASSP Conference, Philadelphia, Pensylvania, USA, 2005. [13] Dubey R.B., Ratan R., Hanmandlu M., and Gupta S.K., Computer Assisted Segmentation of Brain Tumor, TechnoramA, A Supplement to IEI News, pp. 23-26, March 27, 2008. [14] Cuadra M.B., Pollo C., Bardera A., Cuisenaire O., Villemure J., and Thiran P., Atlas Based Segmentation of Pathological MR Brain Images using a Model of Lesion Growth, IEEE Trans in Medical Imaging, vol. 23, no. 10, pp. 1301-1313, 2004. [15] Moon N., Bullitt E., Leemput K.V., and Gerig G., Model Based Brain and Tumor Segmentation, ICPR Quebec, pp. 528-531, August 2002. [16] Prastawa M., Bullitt E., Ho S., and Gerig G., A Brain Tumor Segmentation Framework based on Outlier Detection, Medical Image Analysis, vol. 18, no. 3, pp. 217-231, 2004. [17] Capelle A.S. Colot O., and Fernandez C., Evidential Segmentation Scheme of Multi-Echo MR Images for the Detection of Brain Tumors using Neighborhood Information, Information Fusion, vol. 5, pp. 203-216, 2004. [18] Dou W., Ruan S., Chen Y., Bloyet D., Constans J.M., A Framework of Fuzzy Information for the Segmentation of Brain Tumor Tissues on MR Images, Image and Vision Computing, vol. 25, pp. 164-171, 2007. [19] Liang L., Rehm K., Woods R., and Rottenberg D., Automatic Segmentation of Left and Right Cerebral Himispheres from MRI Brain Volumes using Graph Cut Algorithms, NeuroImage, vol. 34, pp. 1160-1170, 2007.
8
ICGST-GVIP Journal, Volume 10, Issue 3, August 2010
Differentiation in MRI of Ophthalmology using Fuzzy Clustering Algorithms, Magnetic Resonance Imaging, vol. 20, pp. 173-179, 2002. [31] Pham D.I., Xu C. and Prince J.I., A Survey of Current Methods in Medical Image Segmentation, Technical Report JHU/ECE 99-01. [32] Bezdek J.C., Pattern Recognition with Fuzzy Objective Function Algorithms, Plenum Press, New York, 1981.
[33]Somasundaram K., and Kalaiselvi T., A Comparative Study of Segmentation Techniques Used for MR Brain Images, Proceedings of The International Conference on Image Processing, Computer Vision and Pattern Recognition – IPCV’09, WORLDCOMP’09, Los Vegas, Nevada, USA, vol. II, pp. 597-603, 2009. [34] Zimmermann H.J., Fuzzy Set Theory and its Applications, Kluwer Academic Publishers, second edition, Boston, MA, 1991.
Somasundaram .K was born in the year 1953. He received the M.Sc degree in Physics from University of Madras, Chennai, India in 1976, the Post Graduate Diploma in Computer Methods from Madurai Kamaraj University, Madurai, India in 1989 and the Ph.D degree in theoretical Physics from Indian Institute of Science, Bangalore, India in 1984. He is presently the Professor and Head of the Department of Computer Science and Applications, and Head, Computer Centre at Gandhigram Rural Institute, Gandhigram, India. From 1976 to 1989, he was a Professor with the Department of Physics at the same Institute. He was previously a Researcher at an International Centre for Theoretical Physics, Trieste, Italy and a Development Fellow of Commonwealth Universities at the school of Multimedia, Edith Cowan University, Australia. His research interests are in image processing, image compression and medical imaging. He is a Life member of Indian Society for Technical Education. He is also an annual member in ACM, USA and IEEE Computer Society, USA.
Kalaiselvi .T was born in Tamilnadu, India, in 1974. She received her Bachelor of Science (B.Sc) degree in Mathematics and Physics in 1994 and Master of Computer Applications (M.C.A) degree in 1997 from Avinashilingam University, Coimbatore, Tamilnadu, India. From 1997 to 1998 she was a Lecturer in Department of Computer Science, Avinahilingam University, India. Since 1998, she has been with Gandhigram Rural Institute, Dindigul, Tamilnadu, India, where she was a Lecturer in Department of Computer Science and Applications till 2006. From 2006 she was a full time research scholar in the same department and awarded Ph.D degree in Feb., 2010. In 2008, she received a project from Department of Science and Technology (DST), Government of India under Scheme for Young Scientist and Professional (SYSP), Society for Equity, Empowerment and Development (SEED) Division for three years (2008-2011). Now she is a young scientist, working as a Principal Investigator (PI) of the sanctioned project in the same department. Her research focuses on Brain Image Processing and brain tumor or lesion detection from MRI Head Scans to enrich the Computer Aided Diagnostic process, Telemedicine and Tele-radiology services.
9