have developed is based on several soft computing technologies such as fuzzy ... of Information Sciences and Technology, The Pennsylvania State University.
JOURNAL OF LATEX CLASS FILES, VOL. 6, NO. 1, NOVEMBER 2010
1
Fuzzy Content-Based Image Retrieval for Oceanic Remote Sensing Jose A. Piedra-Fern´andez, Gloria Ortega, James Z. Wang, and Manuel Cant´on-Garb´ın
Abstract—The detection of mesoscale oceanic structures, such us upwellings or eddies, from satellites images has significance for marine environmental studies, coastal resource management, and ocean dynamics studies. Nevertheless, there is a lack of tools that allow us to retrieve automatically relevant mesoscale structures from large satellite images databases. This paper is focused on the development and validation of a content based image retrieval (CBIR) system to classify and retrieve oceanic structures from satellite images. The images were obtained from the National Oceanic and Atmospheric Administration (NOAA) satellite’s Advanced Very High Resolution Radiometer (AVHRR) sensor. The study area is about W2◦ -21◦ , N19◦ -45◦ . This CBIR system conducts labeling and retrieval of the most relevant and typical mesoscale oceanic structures, such us upwellings, eddies, and island wakes located on the Canary Islands area, the Mediterranean and Cantabrian seas. The system that we have developed is based on several soft computing technologies such as fuzzy logic and neurofuzzy systems. Index Terms—Neurofuzzy system, fuzzy logic, automatic recognition, ocean structures, ocean satellites images, image retrieval.
I. I NTRODUCTION URING the last decades there has been an substantial increase in the number of environmental problems that need to manage massive volumes of data (the “big data” problems). Examples of these problems are the ocean and atmosphere interaction, the global ocean circulation and the global change (GC) [1]. The measures of the decline in primary productivity in the Pacific Ocean by sensors operating in the visible [2] and the rise of the sea surface using altimeters [3]–[5] are two of the most prominent examples of the influence of GC in the oceans. Satellites have contributed to the study of these problems by providing an enormous quantity of information, mainly in the form of images in different bands of the electromagnetic spectrum. For a typical research and educational application, terabytes of geospatial images and other data are required [6]. As an example, the Envisat satellite acquired about one terabyte of data per day. In the case of the oceans, the major part of the ocean circulation is the mesoscale circulation (scales of 50-500 km and 10-100 days), whose energy is at least one order of magnitude higher than the general circulation [7], [8]. The components of the mesoscale circulation are cyclonic and
D
J. A. Piedra-Fern´andez, G. Ortega and M. Cant´on-Garb´ın are with the Informatics Department, University of Almer´ıa. J. Z. Wang is with the College of Information Sciences and Technology, The Pennsylvania State University. Part of the work was done when he was with the US National Science Foundation.
anticyclonic gyres, fronts, jets and meanders. Upwellings are another important mesoscale structure [9]–[12]. These mesoscale structures exchange heat, CO2 , O2 , nutrients and salt with the general circulation and their study is of crucial importance for the knowledge of the oceans, for the life there [13] and for the atmosphere [14]. Global warming and the increase in the temperature and acidification of the oceans will have a high impact in the decrease of the primary production of the oceans, the absorption of CO2 , and the release of O2 to the atmosphere [1]. On the other hand, sometimes and independently of the volume of the data, there is not a precise definition of the structures that we could search in the images. One example of this could be the absence of a formal oceanographic definition of the mesoscale structures that we wish to find in a satellite image. Moreover, the mesoscale ocean structures have a high variability in shape and a fast change in location. Pattern recognition and automatic image understanding in remote sensing are important fields to manage the large volume of data acquired from space during the last forty years. One example of this importance is the effort done at ISFEREA (Geospatial Information Analysis for Security and Stability, Joint Research Centre (JRC), Ispra, UE) that has developed an image information query system (I2Q) designed to process massive and heterogeneous remotely sensed image data [15]. The large volume of environmental data received from satellites during the past decades and the needs for studies of the Global Change and predictions about the evolution in the mesoscale ocean dynamics motivated us to develop a CBIR system to automatically interpret the sea surface temperature maps (SST) obtained from the sensor AVHRR. SST ranges between -2◦ C and 32◦ C. In the study area the SST ranges between 10◦ C and 30◦ C. The grayscale SST image can be split into bands of 1◦ C for each ten gray levels (from 0 to 255 gray levels). The lowest value of 1 (dark gray color) corresponds to temperature around 10◦ C and the highest value of 254 (light gray color) correspond to temperature around 30◦ C. The CBIR system includes several kinds of softcomputing technologies [16], such as neural networks [17], [18] and fuzzy logic [19], [20]. An advantage of this approach is that the system can be more comprehensible by human users because fuzzy databases (DB) manage a terminology close to natural languages. In this kind of systems, classifiers play an important role [21]–[26].
A. Problem Description
JOURNAL OF LATEX CLASS FILES, VOL. 6, NO. 1, NOVEMBER 2010
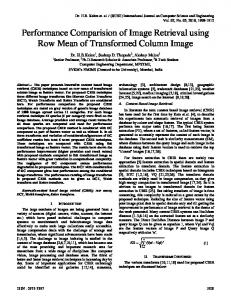
As we stated previously, there are several mesoscale structures that we are interested in locating. These oceanic structures are: upwellings, wakes, cold eddies and warm eddies (see Figure 1). They are defined as follows: Upwellings are cool, nutrient-rich waters that emerge to the surface of the oceans as a result of winds (trade winds in the Canary Islands) blowing from NE parallel to the coast, combined with the effect of the Coriolis force over the surface layers of the ocean. These waters rich in nutrients such as nitrates and phosphates fertilize the phytoplankton, and in this way all the trophic chain develop from phytoplankton to pelagic species [11], [27]. Upwelling structures are very important and scarce. They are very important from an economic point of view because the most fertile and richest feeding ground for fishing are located next to them. In Figure 2 different regions that can be considered upwellings are shown in green color. Another example is observed in green color in Figure 1. Eddies are rotating water masses that emerge or sink into the ocean with abrupt changes in the temperature and salinity. When the core of the eddy has a lowest temperature than the surrounding zones, it is named cold eddy and in the opposite case hot eddy. In cold eddies, the vertical movement is ascending; cold water, rich in nutrients, rises to the surface. However, warm eddies accumulate and sink warm water, carrying organic matter downward toward the ocean depths [11]. As a consequence of the existence of islands that produce calm areas leeward to them, island warm wakes appear.
2
Fig. 2. Examples of regions that can be considered as upwellings (green color) next to the African continent (brown color).
before. This area is located between the NW of Africa and the Canary Archipelago and the Atlantic Waters surrounding the Iberian peninsula. Our area of interest is enclosed in an area that extend from 19◦ N to 45◦ N in latitude and from 2◦ W to 21◦ W in longitude. The work can be readily applied to other places in the ocean. Our system is evaluated using satellite images acquired by AVHRR satellite sensors of NOAA (National Oceanic and Atmospheric Administration) satellites series during the years from 1988 to 1993. However, the methodology that we have developed in this work can be used with any other set of images corresponding to other sensor such as SeaWiFS (Sea-viewing Wide Field-of-view Sensor), MODIS (Moderate Resolution Imaging Spectroradiometer), AATSR(Advanced Along-Track Scanning Radiometer) or MERIS (MEdium Resolution Imaging Spectrometer), among others. B. State of the Art
Fig. 1. AVHRR scene (08/10/1993) showing western Africa (1), the sea (2) and the Canary Islands (LaPalma (3), El Hierro (4), La Gomera (5),Tenerife (6), Gran Canaria (7), Fuerteventura (8) and Lanzarote (9)) are shown. Moreover, the oceanic structures are enhanced: Upwellings (green color), Warm eddies (red color), Cold eddies (blue color) and Wakes for La Palma, El Hierro, La Gomera and Tenerife (yellow color).
For the development of our classification and retrieval system, we have considered an area whose main characteristic is the presence of all the mesoscale oceanic structures described
A CBIR system [28] is any technology that helps to organize digital picture archives by their visual content. They are useful for managing very large collections of image databases. Several studies related to the classification and retrieval of satellite images are found in [29], [30]. A data mining system that combines an auto-annotation component with image classification was developed in [31]. Image classification and searching algorithms to find similarity based on shape features from satellite imagery data were combined in [32]. In the literature, several researchers and institutions have worked on CBIR. Datta et al. [33] from The Pennsylvania State University have studied the challenges involved in the adaptation of existing image retrieval techniques to build systems that can be useful in real-world applications. Moreover, Datta et al. analyzed and quantified the current progress and future uses and developments of image retrieval. The group at Penn State [34] has developed some well-cited CBIR systems, such as a machine-assisted image tagging and searching service which handle millions of images in real-time named ALIPR (Automatic Linguistic Indexing of Pictures - Real Time) [35]. Nevertheless, ALIPR has been developed to work only with visible spectrum images but currently satellites sensors are capable of acquiring multispectral images. To overcome this limitation, our CBIR incorporates multispectral images from different satellite sensors.
JOURNAL OF LATEX CLASS FILES, VOL. 6, NO. 1, NOVEMBER 2010
Focusing our attention on remote sensing CBIR, several systems have been proposed [36]–[41]. for retrieving satellite images. In [41], an approach for selecting and blending biooptical algorithms using an ocean color satellite image is described. Our CBIR system is based on a web image database that classifies and retrieves mesoscale oceanic structures in real time. Our CBIR system is novel because it combines fuzzy logic and geospatial information for the retrieval and classification of images. The main advantage of our system is that it includes fuzzy knowledge in the semantic image retrieval. This fuzzy knowledge reduces the semantic gap between extracted visual features and semantic concepts. Another innovative aspect of this system is that it provides a tool for working with multispectral images from different satellite sensors. The system represents a new approach for retrieval and classification of mesoscale oceanic structures combining fuzzy logic with multispectral images. C. System Goals The main goals of the proposed system have been introduced earlier. The structure of this system is showed in Figure 3. • Input: Original satellite image. • Output: There are two possible outputs in the CBIR system: (1) classification of regions of interest that appear in the image and (2) the retrieval from the database of similar images with one or more structures similar to those found in the input image. • Image processing: A set of steps to improve the quality of the original image. The image processing is described in detail in Section II. • CBIR system connected to a fuzzy database. The CBIR system allows to retrieve images with similar mesoscale oceanic structures. • Neurofuzzy classifier to classify the regions of the fuzzy database into one of the outputs of the system (upwellings, eddies or wakes). • Fuzzy database: The CBIR and the neurofuzzy classifier are connected to a fuzzy database which allows an efficient managing and searching of satellite images due to the fact they are organized without redundancies. Fuzzy Structured Query Language (FSQL) [42] is the query language to execute fuzzy queries. FSQL incorporates some innovations over SQL to allow the management of fuzzy information. In order to use FSQL over a Database Management System (DBMS) such as Oracle, the FSQL Server for a Fuzzy Relational Database (FRDB) is used [43]. The main feature of the FSQL Server is the inclusion of fuzzy attributes to store vague information in the tables of the database. The obtained system is supported by the client-server paradigm which is accessible by Web clients. The server maintains the image databases and runs the CBIR queries. The clients only need an interface of a Web browser. The main advantages of this paradigm are: – The system is updated permanently.
3
– Knowledge shared between all users: Contributions of every expert are shared by all users. – Centralized information: It is avoided both the redundancy and the incoherences in the information. – Efficiency and back up. – High speed processing: All calculations relapse into the server, so that the client does not need a high performance computing system. D. Outline of the Paper Section II describes the methodology of the solution describing the main steps of the CBIR system: image processing, feature extraction, neurofuzzy classification and fuzzy retrieval. In Section III the processes of classifying and retrieval of regions of interest are discussed. Moreover, some obtained results of the classification and retrieval processes are analyzed. Additionally a comparison with the results obtained by other classifiers is included. Finally, section IV summarizes the main conclusions and suggests further improvements. II. M ETHODOLOGY OF THE SOLUTION The fuzzy CBIR system is composed by (Figure 4): – Satellite image processing. The most important task is the iterative segmentation using a graphic expert system [44]. – Feature extraction. Morphological and contextual descriptors are calculated and the fuzzy value associated to each one is assigned. – Neurofuzzy classification. NEFCLASS has been developed for the classification of oceanic structures. – Fuzzy queries. The human expert can search oceanic structures using a language with a structure close to natural language. A. Image Processing The goal of satellite image processing is to improve the quality of images for the next steps. Image processing techniques over the original images are: 1) Automatic cloud masking process [45] detects cloud pixels that are opaque to the ocean radiance data measured in the AVHRR infrared and creates a mask of zeros for these areas (see Figure 5). In the algorithm, every region unusually cold and with a high value of the standard deviation around every pixel of the region is considered as a cloud and rejected by our system. 2) Histogram equalization for maximizing the contrast of the original image without losing structural information. This equalized image makes the task of manual classification by experts easier. Figure 6 shows the original and the equalized images. As can be observed in the image, without the histogram equalization, it would be more difficult for the human experts to locate regions of interest. 3) Identification of islands and continent by means of an algorithm which defines the continent like the portion
JOURNAL OF LATEX CLASS FILES, VOL. 6, NO. 1, NOVEMBER 2010
4
INPUT
OUTPUT
NEUROFUZZY CLASSIFICATOR
CLASSIFICATION FOR GETTING OCEANIC REGIONS:UPWELLINGS, EDDIES AND WAKES
ORIGINAL SATELLITE IMAGE
IMAGE PROCESSING
FUZZY DATABASE RETRIEVAL OF SIMILAR REGIONS FOUND IN DATABASE CBIR
Fig. 3. Structure of the system for the classification and retrieval of mesoscale oceanic structures where the input, the modules for the retrieval and the classification of mesoscale structures (i.e., upwellings) and the outputs are observed.
ORIGINAL IMAGE
PREPROCESSING
CLOUD MASKING
HISTOGRAM EQUALIZATION
IDENTIFICATION ISLANDS-CONTINENT
Fig. 5. AVHRR scene (08/04/1988). Comparison between original image (on the left) and the same image after the automatic cloud masking process (on the right). Note that clouds after the cloud masking process are represented in white color. They are not considered for the classification process.
SEGMENTATION
DELETE REGIONS OVER A THRESHOLD
FEATURE EXTRACTION
EVALUATION OF THE BEST CLASSIFICATOR
REGION OF INTEREST
RETRIEVAL
CLASSIFICATION
NEUROFUZZY SYSTEM
LABEL IMAGE
FUZZY SYSTEM
SIMILAR REGION
Fig. 4. Components of the CBIR system where the four main sections (image processing, feature extraction, neurofuzzy classification and retrieval by means of fuzzy queries) and their subsections can be observed.
of land cut by the right edge of the image. The islands are identified because they are surrounded by water. 4) Iterative segmentation through an expert graphic system [44] in order to obtain the regions in the image that are going to be classified. The graphic system divides the image in parts (regions) that can be associated to an object of the reality and could be an oceanic structures. Figure 7 shows an example of one image after an iterative segmentation, where every different color represent a region of interest. Moreover, at this stage regions with area larger or shorter than several
Fig. 6. AVHRR scene (08/10/1993). Comparison between original (on the left) and equalized image (on the right). The purpose of the equalized image is to maximize the contrast for showing more visual details to the human user in the final image.
pre-established thresholds (called non interest regions) are removed. This way, regions with an area shorter than the shortest island (El Hierro) or regions with an area bigger than the 20% of the image (the size of the highest oceanic structure) are not considered in the CBIR system. B. Feature extraction After the segmentation step into regions, a feature extraction process is applied. This process is based on the representation of a region of the image by means of a vector whose
JOURNAL OF LATEX CLASS FILES, VOL. 6, NO. 1, NOVEMBER 2010
Fig. 7. AVHRR scene (08/10/1993). Comparison between original (left) and segmented image (right). Note that in the segmented image, the black region is composed by non interest regions and the regions of interest are represented by color regions.
5
Fig. 8. Illustration of the Minimum distance to islands and continent (DistToLand) descriptor, where the black circle identifies the oceanic structure, the green regions are the islands, the brown region is the African continent and the black lines represent the possible minimal distances between the oceanic structure and the islands.
very relevant. components are numeric and contextual descriptors. Let us emphasize the importance of this process in CBIR since after the feature extraction we will work only with the vectors that represent the morphology of every region. A morphological description of each region is calculated. Numeric and contextual descriptors have been implemented. Let’s focus our attention on the morphological descriptors. The main morphological descriptors used are: perimeter; area; volume; volume2 ; density; grey levels: minimum, maximum, average and standard deviation; grey level barycenter; equivalent diameter; bounding ellipse: major and minor axis, orientation, eccentricity, degree of circumscription and centroid; barycenter; bounding box and area; Hu’s invariant moments [46]; Maitra’s invariant moments [47]; Zernike’s invariant moments [48]; Canton’s moments: first and second order; and inertia moments eccentricity [49]. Some of these morphological descriptors (invariant moments, density, quotient of major and minor bounding ellipse axis, ...) are invariants against under affine transformations. So, the regions are recognized despite rotations, translations or scale changes over the image. In addition, two contextual descriptors have been implemented according to the oceanographers knowledge. These contextual descriptors use the region inferred knowledge beyond pixel information [50]. They are: •
•
Temperature difference (TempDiff): This descriptor calculates the temperature difference between the center and the edge of a structure. It is useful to discriminate between warm or cold eddies. The first one has a warm nucleus and the second one has the interior zone of minor temperature than the exterior. It is enough to calculate the average temperature in every zone and then to determine the difference. Minimum distance to islands and continent (DistToLand): is the minimum distance between the structure and the continent or the islands (see Figure 8).
After the feature extraction, the image is stored in the database in terms of feature vectors. These feature vectors (hereinafter, descriptors) will allow the classification and retrieval of relevant regions in satellite images. Note that the selection of the suitable descriptors to classify and retrieve is
C. Neurofuzzy System for the classification Neurofuzzy systems refer to combinations of artificial neural networks and fuzzy logic for solving neural networks and fuzzy system problems. The neurofuzzy system considered for our system is the NEFCLASS [51] (NEuro-Fuzzy CLASSification) because of the data analysis by neuro-fuzzy models is legible and efficient. Once the descriptors are inserted into the database, the creation of a classifier is possible. This classifier will be used for the process of classification of mesoscale oceanic structures of satellite images. The neurofuzzy classifier is built by means of three slices neuronal networks: (1) descriptors; (2) fuzzy rules; and (3) output (wake, upwelling, etc). To generate the fuzzy rules, the membership function type and the maximum number of fuzzy rules have to be established. In our particular case, the membership function type considered is a trapezoidal function because this function permits to represent the human expert knowledge of any concept and produce better result than other functions [42]. For our CBIR system all the descriptors described in Section II-B are set up by j membership functions (MFs). For instance, we can consider that the temperature difference descriptor has four membership functions and so, four linguistic labels (low, medium-low, medium-high and high) or six membership functions (Figure 9).
Fig. 9. Temperature difference descriptor with six trapezoidal membership functions. Six linguistic labels (very low (VL), low (L), medium-low (ML), medium-high (MH), high (H) and very high (VH)) have been used.
Experimental results show that when six MFs are considered (Figure 9), a more efficient classification is obtained, but the complexity of rules has increased and the legibility of the fuzzy system has decreased.
JOURNAL OF LATEX CLASS FILES, VOL. 6, NO. 1, NOVEMBER 2010
On the other hand, an excessive number of rules turns the system into a black box impossible to understand by a human being, whereas a too limited number is insufficient for an optimum classification. As a result, it is necessary to find a compromise between accuracy rate and number of rules. NEFCLASS allows to start using rules defined by the user or the database can be built with a training period.Let us remark that every class must have a fuzzy rule at least. One characteristic of our NEFCLASS system is that it allows fuzzy sets training cyclically until a suitable stopping criterion is reached. Moreover, corrections over the membership function can be applied for the system in order to obtain a better result with a particular rule. This correction can not break any user restrictions such us: a function can not exceed another one, the degrees of membership for a given value of the variable always add 1 or fuzzy sets have to be symmetric. To obtain the best classifier for the classification of mesoscale oceanic structures, a comparative study using different classifiers has been carried out. The classifier that produced best results in terms of misclassifications was composed by four descriptors (DistToLand, degree of circumscription ellipse, invHu1 (Hu invariant moment 1) and TempDiff ), trapezoidal membership functions and 11 rules. The rules of the classifier are shown as follows: • IF DistToLand is low AND degree of circumscription ellipse is medium-low AND invHu1 is low AND TempDiff is high THEN is a wake. • IF DistToLand is medium-low AND degree of circumscription ellipse is low AND invHu1 is high AND TempDiff is medium-high THEN is a upwelling. • IF DistToLand is high AND degree of circumscription ellipse is high AND invHu1 is low AND TempDiff is high THEN is a warm eddy. D. Fuzzy logic for the image retrieval Fuzzy logic is basically a multi-valued logic that allows to handle the concept of partial truth rather than the absolute values and categories in Boolean logic [52]. A fuzzy rule (R1) for the resolution of classification problems has the general form as follows: R1: if x1 is low and ... and xn is medium − low then y belongs to c class. Let us remark in R1 that x1 ... xn are the different descriptors, low ... medim − low are the linguistic labels, y is the region to classify and c is the output oceanic structure. An example of fuzzy rule in our system could be: IF Distance to Islands is low AND temperature is high THEN is a wake. The retrieval of oceanic structures consists of locating similar regions in the image database to one pre-specified. In our case, the retrieval is carried out by means of the execution of fuzzy queries on the system database. For the retrieval of oceanic structures, the creation of a classifier composed of descriptors is required. When the classifier is created, several fuzzy information is stored into the fuzzy database (see Subsection Fuzzy database). For our particular problem, the set of suitable descriptors for solving the problem has been proposed by oceanographer experts.
6
The steps to use an automatic image retrieval using fuzzy logic can be described as follows (see Figure 10): • The user has to select a specific oceanic region for retrieving. In Figure 10 the region marked in green is an upwelling (the region with green border). Note that from the fuzzy data information of a region, a fuzzy query can be executed to retrieve similar regions to one given, which is the concept of CBIR. Moreover, simple modifications in the CBIR would allow us to execute queries by concept and by content and to have an image indexing.
Fig. 10. AVHRR scene (08/10/1993). Automatic image retrieval example. On the left, original image in which the region marked on the segmented image is represented (with green border). On the right, segmented image with regions of interest in which the region to retrieve will be selected. •
The system searches among all existing regions in the fuzzy database and selects with a degree of similarity (equal or higher) all similar regions. Note that retrieved regions by the system will depend on both, the selected descriptors and the configuration parameters of the membership functions related to each descriptor. For our particular problem, the set of suitable descriptors for solving the problem has been proposed by oceanographer experts.
E. Fuzzy Database The system for fuzzy retrieval and management of fuzzy information is made up by the following parts (see Figure 11): • Database (DB). The DB stores in a relational format all the information of interest. The main characteristic of the DB is that it has been extended to manage vague information and it is possible to store the fuzzy attribute values. • Fuzzy Meta-knowledge Base (FMB). The FMB consists of a set of tables created in the Oracle database in order to store fuzzy information about the values included in the database. When the descriptors are stored in the DB, the columns of the FMB are modified for storing all fuzzy attributes related to the descriptor (name (e.g., temperature difference), membership functions and linguistic labels) .
JOURNAL OF LATEX CLASS FILES, VOL. 6, NO. 1, NOVEMBER 2010
FUZZY FMB
DATABASE
SYSTEM CATALOG
DBMS
FSQL SERVER
AUTOMATIC SYSTEM FOR REMOTE SENSING
Fig. 11.
•
•
•
FRDB Architecture of image retrieval.
System Catalog. The system catalogue is the data dictionary of the DBMS. So, it stores tables which contain information about the definitions of the database objects (for example, tables, views, indexes and packages). DataBase Management Systems (DBMS). The DBMS considered has been Oracle, because of its power, flexibility and ability to program packages. The requests to the FRDB could involve fuzzy conditions. In this case, they are processed by the FSQL Server. FSQL Server. It is necessary because Oracle only allows the use of SQL instead of FSLQ sentences. The objective of this server is to translate a FSQL query into a standard SQL sentence. For this translation, the server uses the fuzzy information stored in the FMB. III. A NALYSIS AND R ESULTS
This section evaluated test examples for both, the neurofuzzy classification and the fuzzy retrieval. For these evaluations, 298 image regions have been considered (35 upwellings, 100 wakes, 10 cold eddies, 10 warm eddies and 143 unknown regions). A. Results of the neurofuzzy classifier In this subsection, some results of the process of neurofuzzy classification using different test examples are shown. Several classifier configurations have been considered to validate the effectiveness and quality of the neurofuzzy classifier in the problem of oceanic structures classification. Here, the knowledge of oceanographers has been required for identifying the most relevant descriptors in the creation of the classifiers. As a result, the best classifier is composed by two contextual descriptors (Minimum distance to islands and continent (DistToLand) and temperature difference (TempDiff ) and two morphological descriptors (degree of circumscription ellipse (degree of circumscription ellipse) and the first Hu invariant moment (invHu1)). On one hand, the knowledge of oceanographers has been used to select the three descriptors of the classifier: (1) TempDiff, that gives us information about the temperature; (2) DistToLand, that gives us information about the structure position; (3) Orientation of the circumscribed ellipse, that gives us information about the orientation of the region. On the other hand, the Hu’s invariant1 give us information about the shape an orientation of the structure. In
7
our automatic feature selection system [50] the Hu’s invariant moments got a high ranking score in the classification process improving the accuracy rate. In fact, the best ranking score was obtained by invHu1. NEFCLASS was tested with this four descriptors using several setting of rules and membership functions number. The main characteristics of this classifier are: (1) the use of only four descriptors decreases the complexity of the generated fuzzy rules and improves its legibility; and (2) the system obtains real time results with a high accuracy rate. Table I shows the results obtained for the classifier composed by the four descriptors (DistToLand, degree of circumscription ellipse, invHu1 and TempDiff ) and a maximum of 11 rules. Let it be noticed that classifiers are called as follows: CL - Classifier and Number of membership functions for descriptor - MF. In particular, classifiers considered are: CL4MF, CL6MF, CL8MF and CL10MF. Classifier CL4MF CL6MF CL8MF CL10MF
(%) Classified real regions 100 76.25 76.34 20.15
(%) Classified false positives 5.15 3.03 3.03 1.10
TABLE I R ESULTS OF NEFCLASS CLASSIFIER USING THE DESCRIPTORS (DistToLand, degree of circumscription ellipse, invHu1 AND TempDiff ), A MAXIMUM OF 11 RULES AND WITH DIFFERENT NUMBER OF MEMBERSHIP FUNCTIONS (4, 6, 8 AND 10).
In Table I, two different parameters can be identified: (1) the classification of real regions and (2) the false positives. The first column ((%) Classified real regions) describes the percentage of regions that have been detected and, therefore, classified. The second column ((%) Classified false positives) identifies the classified regions that are not valid. Results from Table I have been obtained fixing the rule number to 11 and modifying the number of membership functions (4, 6, 8, 10). When the number of membership functions has increases, the number of generated rules increases naturally. Thus, the accuracy rate in term of the classification of real regions is lower with 10 membership functions and 11 rules. In Table II this conclusion is observed on the results, where for each number of membership functions two cases are shown: the local maximum accuracy rate and the accuracy rate using 11 rules (because it is the best accuracy rate). The local maximum accuracy rate means that the relative maximum of accuracy rate depending on the rule number with a fixed number of membership functions and descriptors in the test process. In the first row we obtained the maximum accuracy rate using 11 rules. Although in the second row the accuracy rate decreases when the rule numbers increase to 20, but in the rest of the cases, when the membership functions increase the rule’s number is adapted, growing until the local maximum accuracy rate. In general, the accuracy rate depends on the number of membership functions, on the rule´s number and on the number of descriptors. The local maximum accuracy rate can usually be detected fora fixed number of descriptors and membership functions using different rule numbers. In the last case is observed that the local maximum accuracy rate is
JOURNAL OF LATEX CLASS FILES, VOL. 6, NO. 1, NOVEMBER 2010
getting for 32 rules and 10 membership functions, although in the first case it is getting for 11 rules and 4 membership functions. Classifier NEFCLASS NEFCLASS NEFCLASS NEFCLASS NEFCLASS NEFCLASS NEFCLASS NEFCLASS
FMs 4 4 6 6 8 8 10 10
Rules 11 20 11 15 11 29 11 32
(%)Accuracy Rate 85.34 80.18 73.04 75.23 70.67 78.45 60.23 78.36
TABLE II R ESULTS OF NEFCLASS CLASSIFIER USING THE DESCRIPTORS (DistToLand, degree of circumscription ellipse, invHu1 AND TempDiff ), DIFFERENT RULE NUMBER AND NUMBER OF MEMBERSHIP FUNCTIONS .
Furthermore, a comparison of NEFCLASS with other neurofuzzy classifier has been carried out in Table III. The classifiers were tested using all descriptors (in our case 75 descriptors), an automatic feature selection (only 11 descriptors) and an experimental feature selection based on the results obtained by neurofuzzy classifiers (see subsection III). The automatic feature selection is a technique that combines filter methods and Bayesian classifier as a feature selector [50]. ANFIS (adaptive-network-based fuzzy inference system) [53] and NEFPROX [54] need a higher rule´s number and give worse accuracy rate than NEFCLASS. In general, the accuracy rate using 4 descriptors is better than using 75 descriptors and similar to the results using 11 descriptors. Also, in ANFIS and NEFPROX the rule’s number is three or four times higher than with NEFCLASS. Table IV shows a comparative analysis among different classifiers such as Na¨ıve Bayesian network (NB), decision tree using C4.5 model, multilayer perceptron neural network (MLP) [55] and fuzzy lattice reasoning (FLR) [56]. The best result was obtained using 75 descriptors by NEFCLASS. However, the best classification was obtained using the automatic feature selection by MLP and FLR. In spite of this result, NEFCLASS obtained the same accuracy rate using only 4 descriptors. Note that in a fuzzy system the accuracy rate depends on the number of membership functions and on the number of rules considered. We should emphasize that the NEFCLASS and FLR are easier to understand by the human being, because these classifier work with fuzzy rules close to the real-world meanings. Of course, the accuracy rate of MLP using 11 descriptors is the highest, but the knowledge representation is more difficult to understand by the human expert. NB uses a probabilistic knowledge and not fuzzy knowledge, although the model structure is simple, it is hard to determine the relationship between descriptors and to extract rules understandable by the human being. Although C4.5 is easily understandable, in this case the main problem was the size of the tree, more than 150 levels in the worst case and 40 in the best case. It is difficult to understand by the human being. The best classification according to lowest descriptor number, highest accuracy rate and easily of understanding was by NEFCLASS. This classifier uses 4 descriptors, fuzzy rules easily understandable and the efficiency is between 2.5 and 9,
8
Classifier ANFIS ANFIS ANFIS ANFIS ANFIS ANFIS ANFIS ANFIS ANFIS NEFPROX NEFPROX NEFPROX NEFPROX NEFPROX NEFPROX NEFPROX NEFPROX NEFPROX NEFCLASS NEFCLASS NEFCLASS NEFCLASS NEFCLASS NEFCLASS NEFCLASS NEFCLASS NEFCLASS NEFCLASS NEFCLASS NEFCLASS NEFCLASS NEFCLASS NEFCLASS
Descriptors 4 11 75 4 11 75 4 11 75 4 11 75 4 11 75 4 11 75 4 11 75 4 11 75 4 11 75 4 11 75 4 11 75
FM 4 4 4 9 9 9 15 15 15 4 4 4 9 9 9 15 15 15 4 4 4 9 9 9 15 15 15 50 50 50 100 100 100
Rules 233 290 338 392 393 438 407 393 438 220 290 302 392 393 433 407 393 435 11 11 11 32 45 57 39 49 73 87 111 182 316 327 489
(%) Accuracy 60.40 55.26 50.45 76.84 79.26 72.45 83.63 85.03 73.45 65.04 58.60 55.52 75.84 76.65 61.27 88.02 87.52 89.65 85.34 70.02 65.84 78.34 77.66 69.32 81.02 70.05 69.08 85.77 77.87 76.47 94.19 93.39 98.30
TABLE III R ESULTS OF ACCURACY RATE USING DIFFERENT CLASSIFIERS AND NUMBER OF DESCRIPTORS .
better than other classifiers. The NEFCLASS’s computational cost was higher during the training step around 2 second, although the highest time was around 30 second by MLP. During the testing step the computational cost was less than 1 second, although the fastest was by C4.5. Classifier NEFCLASS NB C4.5 MLP FLR
(%) Accuracy 75 descriptors 98.30 89.18 94.59 97.29 91.89
(%) Accuracy 11 descriptors 93.39 94.59 94.59 100 100
(%) Accuracy 4 descriptors 94.19 83.78 91.89 89.18 89.18
TABLE IV R ESULTS OF ACCURACY RATE USING DIFFERENT CLASSIFIERS AND NUMBER OF DESCRIPTORS .
B. Results of the fuzzy retrieval system In this subsection, some results of the process of fuzzy retrieval using different test cases are shown. In this paper, a variety of queries using the combination of several descriptors and a set of 298 regions stored in the database have been performed. Table V shows the best results obtained with the CLF4MF classifier for each oceanic structure. In Table V, the “percentage of retrieved valid regions from the total” means that if there are 100 oceanic structures of type cold eddies, our system will retrieve correctly 80.25 of them
JOURNAL OF LATEX CLASS FILES, VOL. 6, NO. 1, NOVEMBER 2010
Structure Upwellings Cold eddy Warm eddy Wakes
(%) Retrieved real regions 100 80.25 100 88.35
(%) Retrieved false positives 20.36 30.20 26.04 8.12
TABLE V R ETRIEVAL OF OCEANIC STRUCTURES BASED ON CLF4MF.
(and also some false positives). The column “false positives in retrieved regions”, shows the percentage of false positives between all the positives. Analyzing the results in Table V, we are going to focus our attention in two parameters: (1) the retrieval of real regions and (2) the valid/false positives. The first parameter depends on the nature of the region. The retrieval of real mesoscale oceanic regions depends on the kind of the region. Our system detects all upwellings and warm eddies without problems. Nevertheless, the system does not distinguish correctly the totally of cold eddies and wakes structures. This problem could be solved creating a new classifier (with more descriptors) to retrieve these types of mesoscale oceanic structures with a higher accuracy. The number of false positives is directly related to the number of oceanic structures of each type included in the database. So, the more oceanic structures into the database, the less number of false positives (i.e., upwellings and wakes have the highest number of regions in the database and the less number of false positives). To overcome the problem of a high number of false positives, the solution would be the gradual inclusion of more oceanic structures into the database. IV. C ONCLUSIONS AND FUTURE WORK This work has presented a CBIR system which allows the classification and retrieval of mesoscale oceanic structures from satellite images. The location of these oceanic structures is very relevant for the study of marine circulation, atmosphere-ocean exchange, global change and also have an economic importance thanks to the offshore industry . Soft Computing technologies, such as neurofuzzy and fuzzy logic have been considered for solving the problem. On the one hand, classification using neurofuzzy systems offers several advantages with regard to systems based on Bayesian or neural networks. The neurofuzzy system has higher accuracy rate, the knowledge generated is reusable and on the other hand, fuzzy systems are open systems with legible rules for a human expert and can be modified. The technology FSQL allows us to look for relevant regions quickly from a huge dataset of images. The system executes a fuzzy query to retrieve reasonable coincidences (similar descriptors). The fact of using fuzzy logic allows us to find regions similar to one selected by the user in the image dataset. The user select the region and also the fuzzy possibility comparator to execute the fuzzy queries. The use of fuzzy relational databases allows us to manage information in an organized and efficient way and to make the fuzzy retrieval of interest regions easier. Finally, some future research can be suggested. This system can be extended easily for working with other regions of the oceans in order to locate other mesoscale oceanic structures
9
or can be adapted for working with other kind of images (Cl-a in SeaWiFS, MODIS, MERIS or CZCS(Coastal Zone Color Scanner), SST from MODIS and AVHRR, SAR (Synthetic Aperture Radar) and also ALT (Altimeters) ocean structures). For this purpose, the evaluation and exploration of new descriptors will be required, especially contextual descriptors based on the particular problem to study. Currently, we are improving our CBIR system using ontologies to combine data from multiple heterogeneous sources. At the same time, we are going to extend these studies to the North Atlantic and North Pacific oceans using MODIS, SeaWIFS and meteorological data. The goal of this work will be to forecast natural disasters (cyclones, tropical storms) by studying the sea surface temperature, chlorophyll concentration and meteorological data. V. ACKNOWLEDGMENT This work was supported by the Spanish Ministry of Science and Technology through the Project TIN2008-06622-C03-03. G. Ortega is a fellow of the Spanish FPU programme. J. Z. Wang has been supported by the U.S. National Science Foundation. R EFERENCES [1] IPCC, Intergubernmental Panel for Climate Change AR4 WG1. The Physical Science Basis. Cambridge University Press, 2007. [2] W. W. Gregg, M. E. Conkright, P. Ginoux, J. E. O’Reilly, and N. W. Casey, “Ocean primary production and climate: Global decadal changes,” Geophys. Res. Lett, vol. 30, no. 15, p. 1809, 2003. [3] R. S. Nerem, E. W. Leuliette, and A. Cazenave, “Present-day sea-level change: A review,” Comptes Rendus Geoscience, vol. 338, pp. 1077– 1083, 2006. [4] R. Morrow and P. Le Traon, “15 years of satellite altimetry and mesoscale ocean dynamics.” in ESA Int. Workshop. Paper 889., 2006, pp. 1585–1588. [5] A. Tejera, L. Garc´ıa, and M. Cant´on, “Study of mesoscale features and seasonal variability in the Canary Basin from GEOSAT, ERS-1 and TOPEX/POSEIDON altimeters data,” European Space Agency (ESA) Publications SP-405, pp. pp. 211–218, 1997. [6] J. Gabriel, H. Pineda, J. Nelson, and P. Castillo, “Genetic algorithms application to satellite image classification in an intelligent grid services framework state of the art,” pp. pp. 211–218, 2007. [7] A. Rubino, Fluctuating mesoscale frontal features: structures and manifestations in the real ocean. Kumulative Habilitationsschrift. Universitat Hamburg, 2005. [8] M. V. Angel and M. J. R. Fasham, Eddies in Marine Science. Berlin: Springer-Verlag, 1983, ch. Eddies and biological processes, pp. 492–524. [9] O. E. Esenkov and B. Cushman-Roisin, “Modeling of two-layer eddies and coastal flows with a particle method,” J. Geophys. Res., vol. 104, pp. 10 959–10 980, 1999. [10] D. Stammer and C. Wunsch, “Temporal changes of eddy energy of the oceans.” Deep-Sea Res. II, vol. 46, pp. 77–108, 1999. [11] J. Ar´ıstegui, P. Sangr´a, S. Hern´andez-Le´on, M. Cant´on, A. Hern´andezGuerra, and J. Kerling, “Island-induced eddies in the Canary islands,” Deep Sea Research Part I: Oceanographic Research Papers, vol. 41, no. 10, pp. 1509–1525, 1994. [12] P. Sangr`a, A. Pascual, A. Rodr´ıguez-Santana, F. Mach´ın, E. Mason, J. C. McWilliams, J. L. Pelegr´ı, C. Dong, A. Rubio, and J. Ar´ıstegui, “The Canary Eddy Corridor: A major pathway for long-lived eddies in the subtropical North Atlantic,” Deep Sea Research Part I: Oceanographic Research Papers, Sep. 2009. [13] J. Ar´ıstegui, P. Tett, A. Hern´andez-Guerra, G. Basterretxea, M. Montero, K. Wild, P. Sangr´a, S. Hern´andez-Leon, M. Canton, J. Garc´ıa-Braun, M. Pacheco, and E. Barton, “The influence of island-generated eddies on chlorophyll distribution: a study of mesoscale variation around Gran Canaria,” Deep Sea Research Part I: Oceanographic Research Papers, vol. 44, no. 1, pp. 71–96, 1997.
JOURNAL OF LATEX CLASS FILES, VOL. 6, NO. 1, NOVEMBER 2010
[14] R. J. Small, S.-P. Xie, and J. Hafner, “Satellite observations of mesoscale ocean features and copropagating atmospheric surface fields in the tropical belt,” Journal of Geophysical Research: Oceans, vol. 110, no. C2, 2005. [15] Joint Research Centre (JRC), 2013. [Online]. Available: http://ipsc.jrc.ec.europa.eu/ [16] F. Karray and C. D. Silva, Soft Computing and Tools of Intelligent Systems Design: Theory and Applications. Pearson Addison Wesley, 2004. [17] V. Kecman, Learning and Soft Computing, Support Vector Machines, Neural Networks and Fuzzy Logic Models. MIT Press, 2001. [18] A. D. Kulkarni, Computer Vision and Fuzzy-Neural Systems, 1st ed. Upper Saddle River, NJ, USA: Prentice Hall PTR, 2001. [19] J. Casillas and F. Herrera, Interpretability issues in fuzzy modeling. Springer-Verlag, 2003. [20] O. Castillo, P. Melin, O. M. Ross, R. S. Cruz, W. Pedrycz, and J. Kacprzyk, Theoretical Advances and Applications of Fuzzy Logic and Soft Computing, 1st ed. Springer, 2007. [21] J. A. Torres Arriaza, F. G. Rojas, M. P. Lopez, and M. Cant´on, “Competitive neural-net-based system for the automatic detection of oceanic mesoscalar structures on avhrr scenes.” IEEE Trans. Geosci. Remote Sens., vol. 41, no. 4, pp. 845–852, 2003. [22] V. Davidovich and A. Gangopadhyay, “An algorithm for the automatic recognition of oceanic features in frontal maps,” Oceanology, vol. 52, no. 3, pp. 436–446, 2012. [23] S. Patel, R. Balasubramanian, and A. Gangopadhyay, “Automatic detection of oceanic eddies in seawifs-derived color images using neural networks and shape analysis,” in Proc. IEEE IGARSS, vol. 2, 2008, pp. II–835–II–838. [24] K. Nieto, H. Demarcq, and S. McClatchie, “Mesoscale frontal structures in the canary upwelling system: New front and filament detection algorithms applied to spatial and temporal patterns,” Remote Sensing of Environment, vol. 123, pp. 339–346, 2012. [25] A. Manuel Fernandes, S. Nascimento, and D. Boutov, “Automatic identification of oceanic eddies in infrared satellite images,” Comput. Geosci., vol. 37, no. 11, pp. 1783–1792, Nov. 2011. [26] J. Holland, Ocean Thermal Feature Recognition, Discrimination and Tracking Using Infrared Satellite Imagery. University of Delaware, 1991. [27] E. D. Barton, J. Ar´ıstegui, P. Tett, M. Cant´on, J. Garc´ıa-Braun, S. Hern´andez-Le´on, L. Nykjaer, C. Almeida, J. Almunia, S. Ballesteros, G. Basterretxea, J. Esc´anez, L. Garc´ıa-Weill, A. Hern´andez-Guerra, F. L´opez-Laatzen, R. Molina, M. F. Montero, E. Navarro-P´erez, J. M. Rodr´ıguez, K. van Lenning, H. V´elez, and K. Wild, “The transition zone of the Canary Current upwelling region,” Progress In Oceanography, vol. 41, no. 4, pp. 455–504, Oct. 1998. [28] W. ShangGuan, Y. Hao, Y. Tang, and Y. Zhu, “The research and application of content-based satellite cloud image retrieval,” in ICMA, aug. 2007, pp. 3864 –3869. [29] T. M. Lillesand, Remote Sensing and Image Interpretation. John Wiley & Sons, 2006. [30] J. Piedra-Fern´andez, M. Cant´on-Garb´ın, and F. Guindos-Rojas, “Application of Fuzzy Lattice Neurocomputing (FLN) in Ocean Satellite Images for Pattern Recognition,” in Computational Intelligence Based on Lattice Theory, ser. Studies in Computational Intelligence, V. Kaburlasos and G. Ritter, Eds. Springer Berlin Heidelberg, 2007, vol. 67, pp. 215– 232. [31] P. Blanchart, M. Ferecatu, and M. Datcu, “Mining large satellite image repositories using semi-supervised methods.” IEEE, 2011, pp. 1585– 1588. [32] M. Gebril, A. Homaifar, R. Buaba, and E. A. Kihn, “Satellite image retrieval using semi-supervised learning,” in IGARSS, 2011, pp. 2935– 2938. [33] R. Datta, D. Joshi, J. Li, and J. Z. Wang, “Image retrieval: Ideas, influences, and trends of the new age,” ACM Comput. Surv., vol. 40, no. 2, pp. 5:1–5:60, May 2008. [34] James Z. Wang’s Research Group., 2013. [Online]. Available: http://wang.ist.psu.edu/IMAGE/ [35] J. Li and J. Z. Wang, “Real-time computerized annotation of pictures,” IEEE Trans. Pattern Anal. Mach. Intell., vol. 30, no. 6, pp. 985–1002, 2008. [36] D. Upreti, “Content-based satellite cloud image retrieval,” Ph.D. dissertation, Indian Institute of Remote Sensing, 2012. [37] T. Liu, L. Zhang, P. Li, and H. Lin, “Remotely sensed image retrieval based on region-level semantic mining,” EURASIP J. Image and Video Processing, vol. 2012, p. 4, 2012.
10
[38] Y. Li and T. R. Bretschneider, “Semantic-sensitive satellite image retrieval,” IEEE Trans. Geosci. Remote Sens., vol. 45, no. 4, pp. 853– 860, 2007. [39] M. Ferecatu and N. Boujemaa, “Interactive Remote Sensing Image Retrieval Using Active Relevance Feedback,” IEEE Trans. Geosci. Remote Sens., pp. 818–826, apr 2007. [40] K. Zagoris, S. A. Chatzichristofis, N. Papamarkos, and Y. S. Boutalis, “img(anaktisi): A web content based image retrieval system,” in SISAP, 2009, pp. 154–155. [41] T. S. Moore, J. W. Campbell, and H. Feng, “A fuzzy logic classification scheme for selecting and blending satellite ocean color algorithms.” IEEE Trans. Geosci. Remote Sens., vol. 39, no. 8, pp. 1764–1776, 2001. [42] J. Galindo, Fuzzy Databases: Modeling, Design, and Implementation. Hershey, PA, USA: IGI Publishing, 2006. [43] J. Galindo, J. M. Medina, O. Pons, and J. C. Cubero, “A server for Fuzzy SQL Queries,” in FQAS, 1998, pp. 164–174. [44] F. Guindos, J. A. Piedra, and M. Cant´on, “Ocean features recognition in AVHRR images by means of bayesian net and expert system,” in 3rd Int. Workshop Pattern Recognition and Remote Sensing, vol. 11, no. 1-14, 2000, pp. 1830 –1832 vol.5. [45] J. Arriaza, F. Rojas, M. Lopez, and M. Cant´on, “An automatic cloudmasking system using backpro neural nets for AVHRR scenes,” IEEE Trans. Geosci. Remote Sens., vol. 41, no. 4, pp. 826 – 831, april 2003. [46] M.-K. Hu, “Visual Pattern Recognition by Moment Invariants,” IRE Transactions on Information Theory, pp. 179–187, 1962. [47] S. Maitra, “Moment invariants,” in Proc. IEEE, vol. 67, no. 4, April 1979, pp. 697–699. [48] M. R. Teague, “Image analysis via the general theory of moments,” Journal of the Optical Society of America, vol. 70, pp. 920–930, Aug. 1980. [49] J. M. Galvez and M. Cant´on, “Normalization and shape recognition of three-dimensional objects by 3d moments,” Pattern Recognition, vol. 26, no. 5, pp. 667–681, 1993. [50] J. A. Piedra-Fern´andez, M. Cant´on-Garb´ın, and J. Z. Wang, “Feature Selection in AVHRR Ocean Satellite Images by Means of Filter Methods,” IEEE Trans. Geosci. Remote Sens., vol. 48, no. 12, 2010. [51] D. Nauck and R. Kruse, “Nefclass - a neuro-fuzzy approach for the classification of data,” in Proc. of the 1995 ACM Symposium on Applied Computing. ACM Press, 1995, pp. 461–465. [52] L. A. Zadeh, “Fuzzy sets,” Information and Control, vol. 8, no. 3, pp. 338–353, 1965. [53] J.-S. Jang, “ANFIS: adaptive-network-based fuzzy inference system,” IEEE Transactions on Systems, Man and Cybernetics, vol. 23, no. 3, pp. 665–685, 1993. [54] D. Nauck and R. Kruse, “A neuro-fuzzy approach to obtain interpretable fuzzy systems for function approximation,” in Proc. of IEEE Int. Conf. on Fuzzy Systems (FUZZ-IEEE’98), 1998, pp. 1106–1111. [55] R. Duda, P. Hart, and D. Stork, Pattern Classification. Wiley, 2001. [56] V. G. Kaburlasos and V. Petridis, “Fuzzy lattice neurocomputing (FLN) models,” Neural Netw., vol. 13, no. 10, pp. 1145–1169, Dec. 2000.