PAX3. Pluripotency Markers. Ectoderm Markers. Endoderm and mesoderm Markers. Marker abundance. Low. High. Pluripotent. Mesendoderm. Ectoderm.
Stem Cell Reports, Volume 10
Supplemental Information
GCN5 Regulates FGF Signaling and Activates Selective MYC Target Genes during Early Embryoid Body Differentiation Li Wang, Evangelia Koutelou, Calley Hirsch, Ryan McCarthy, Andria Schibler, Kevin Lin, Yue Lu, Collene Jeter, Jianjun Shen, Michelle C. Barton, and Sharon Y.R. Dent
Pluripotency Markers
Wang et al. Figure S2 NANOG
OCT4
SOX2
SOX1
PAX6
PAX3
SOX17
GATA4
GATA6
Brachyury
Pluripotent Mesendoderm
Ectoderm
Mesoderm
Endoderm and mesoderm Markers
Ectoderm Markers
Endoderm
Marker abundance Low
High
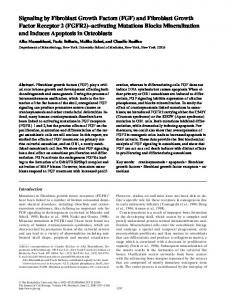
Figure S2 Mass cytometry to delineate heterogeneous cell populations during ESC differentiation. Related to Figure 2.
Proof-of-principle experiment showing lineage markers are enriched for corresponding cell populations. Upper panels: ES cells, NANOG, OCT4, and SOX2 enriched in the pluripotent region defined in red. Middle panels: differentiated EBs, SOX1, PAX6 and PAX3 enriched in the ectoderm region (blue).
Lower panels: differentiated EBs, SOX17, GATA4, GATA6 enriched for the endoderm region (green) and Brachyury enriched in the mesoderm region (purple).
Wang et al. Figure S3 exp.1 13.5%
exp.3
4.72%
17.1%
exp.4 5.38%
B.
102
20
0 0
102
P=0.0314
15
104
3.11%
0.32%
0.38%
10
1.97%
5
OCT4
-
102 0 102
104
BRACHYURY Gsc
Endoderm
Relative mRNA Relative mRNA
Mesoderm
Mesendoderm progenitors
C. 0.3
P=0.0408
0.2 0.1 0.0
0.4 0.3
T P 200bp were called as differentially expressed. Principle Component Analysis (PCA): PCA was performed by R function prcomp using cpm (count of fragments in each gene per million of fragments mapped to all exons) values. The scale option was set as TRUE. Heatmap: The normalized counts from DESeq were used to generate heatmap by Cluster 3.0 (de Hoon et al., 2004) and Java Treeview (Saldanha, 2004). The values in each gene were centered by median and rescaled so that the sum of the squares of the values is 1.0. Gene Function and Pathway Analysis: The differential genes called by DESeq were used for Ingenuity Pathway Analysis (IPA) and Gene Set Enrichment Analysis (GSEA) (Subramanian et al., 2005). Monolayer differentiation of mESCs Early mesoderm and endoderm lineages were generated following the protocols of Villegas et al., 2013 and (Orlova et al., 2014) with some modifications for mESCs. Briefly, mESCs were cultured on Col-IV coated plates for 2 days in differentiation media supplemented with B27, N2 and ROCK inhibitor (2.5µM). At day 2 the medium was replaced with MEDF (DMEM-High glucose (HyClone™, SH3002201) medium supplemented with 2% (v/v) FBS (Gibco™,10437-028), 0.1mM non-essential amino acids (Corning™, MT25025CI), 2mM L-glutamine (Hyclone, SH3003401), 1% (v/v) penicillin/streptomycin (Hyclone, SV30010), 0.1 mM β-mercaptoethanol (BME) (Fisher, 03446I-100), and 1mM sodium pyruvate (Gibco™, 11360070)) for 24 hours, then supplemented with Activin A (50ng/mL) for two additional days to induce differentiation towards early mesoderm and endoderm lineages.
Antibodies used in this study Antibodies Anti-phospho-ERK Anti-ERK Anti-phospho-AKT Anti-AKT Anti-phospho-p38 Anti-p38 Anti-phospho-c-RAF (S259) Anti-c-RAF Anti-FGFR1 Anti-cMYC Anti-H3 Anti-H3K9ac Anti-Rabbit IgG Anti-SOX1
Manufacturers Cell Signaling Technology Cell Signaling Technology Cell Signaling Technology Cell Signaling Technology Cell Signaling Technology Cell Signaling Technology Cell Signaling Technology Cell Signaling Technology Cell Signaling Technology Cell Signaling Technology Abcam Millipore Millipore BD Biosciences
Catalog No. 4370 4695 4060 4691 4511 9212 9421 53745 9740 9402 ab1791 07-352 12-370 560749
Anti-GATA4 Anti-Laminin Anti-Vimentin Alexa Fluor 568 Phalloidin Donkey anti-rabbit IgG Alexa Fluor® 488 Donkey anti-rabbit IgG Alexa Fluor® 555 Donkey anti-rabbit IgG Alexa Fluor® 647 Donkey anti-mouse IgG Alexa Fluor® 488 Goat Anti-mouse IgG Alexa Fluor® 568 Donkey anti-mouse IgG Alexa Fluor® 647 Anti-NANOG Anti-OCT4 Anti-SOX2 Anti-GATA6 Anti-PAX3 Anti-PAX6 Anti-BRACHYURY Anti-HAND1 Anti-FOXA2 Anti-GATA4 Anti-SOX17
Abcam Millipore Abcam ThermoFisher Scienctific ThermoFisher Scienctific ThermoFisher Scienctific ThermoFisher Scienctific ThermoFisher Scienctific
ab84593 AB2034 ab92547 A12380 A21206 A31572 A31573 A21202
Applications Westerns Westerns Westerns Westerns Westerns Westerns Westerns Westerns Westerns Westerns/ChIP ChIP ChIP ChIP IF/Mass Cytometry IF IF IF IF IF IF IF IF
ThermoFisher Scienctific ThermoFisher Scienctific
A11004 A31571
IF IF
Cell Signaling Technology Santa Cruz R&D Systems R&D Systems R&D Systems R&D Systems R&D Systems R&D Systems BD Biosciences BD Biosciences BD Biosciences
3580 sc-5279 MAB2018 AF1700 MAB2457 AF8510 AF2085 AF3168 561580 560327 561590
Mass Cytometry Mass Cytometry Mass Cytometry Mass Cytometry Mass Cytometry Mass Cytometry Mass Cytometry Mass Cytometry Mass Cytometry Mass Cytometry Mass Cytometry
Primers used in this study Oligo name Sequences (5’-3’) qRT-PCR (RNA analysis) Cdh2 fwd CAGGGTGGACGTCATTGTAG Cdh2 rev AGGGTCTCCACCACTGATTC Fgf3 fwd ACAGGCGGGAAGCATATGTA Fgf3 rev GGCCATGAACAAGAGAGGAC Fgf4 fwd CGTTGTAGTTGTTGGGCAGA Fgf4 rev TTCTTCGTGGCTATGAGCAG Fgf5 fwd GCGATCCACAGAACTGAAAA Fgf5 rev ACTGCTTGAACCTGGGTAGG Foxa2 fwd GAGCAGCAACATCACCACAG Foxa2 rev CGTAGGCCTTGAGGTCCAT Gata6 fwd CAAAAGCTTGCTCCGGTAAC Gata6 rev TGAGGTGGTCGCTTGTGTAG Grb10 fwd ATCTTCCGTTTCCCATTTCC Grb10 rev CTCCTTACCTCCTCCTCCGA Otx2 fwd CTTCATGAGGGAAGAGGTGG Otx2 rev GGCCTCACTTTGTTCTGACC Pbgd fwd CAGGGTACAAGGCTTTCAGC Pbgd rev CGGAGTCATGTCCGGTAAC Prcka fwd AACGAACTCATGGCACCTCT Prcka rev CACTGCACCGACTTCATCTG Sox1 fwd CCTCGGATCTCTGGTCAAGT Sox1 rev GCAGGTACATGCTGATCATCTC Spry4 fwd AGGTCCTGAACTGCACCAAG Spry4 rev GGGGATTTACACAGACGTGG Stat3 fwd CTGCTCCAGGTAGCGTGTGT Stat3 rev CTCAGCCCCGGAGACAGT T fwd CTGGGAGCTCAGTTCTTTCG T rev CCCCTTCATACATCGGAGAA ChIP-qPCR Bcat1 fwd Bcat1 rev Rps6ka2 fwd Rps6ka2 rev Mthfd2 fwd Mthfd2 rev Intergenic fwd Intergenic rev
GGGTGCAAATGTGAGTCTCC GCCCAGCTCTCCATCTTCC CCTCACCGAGAGGAGGAAG CCCTGCAACTCCTTGCTTAT AAGCGTCCGCATCTCCAC TATCCTTCCCAAGCATCACC AAGGGGCCTCTGCTTAAAAA AGAGCTCCATGGCAGGTAGA
Source (Kamiya et al., 2011) Originally designed Originally designed (Kamiya et al., 2011) Originally designed (Kamiya et al., 2011) Originally designed Originally designed Originally designed Originally designed (Kamiya et al., 2011) Originally designed Originally designed (Kamiya et al., 2011)
Originally designed Originally designed Originally designed Originally designed
References Anders, S., and Huber, W. (2010). Differential expression analysis for sequence count data. Genome Biol 11, R106.
Anders, S., Pyl, P.T., and Huber, W. (2015). HTSeq--a Python framework to work with high-throughput sequencing data. Bioinformatics 31, 166-169. Auerbach, R.K., Chen, B., and Butte, A.J. (2013). Relating genes to function: identifying enriched transcription factors using the ENCODE ChIP-Seq significance tool. Bioinformatics 29, 1922-1924. Consortium, E.P. (2012). An integrated encyclopedia of DNA elements in the human genome. Nature 489, 57-74. de Hoon, M.J., Imoto, S., Nolan, J., and Miyano, S. (2004). Open source clustering software. Bioinformatics 20, 1453-1454. Kamiya, D., Banno, S., Sasai, N., Ohgushi, M., Inomata, H., Watanabe, K., Kawada, M., Yakura, R., Kiyonari, H., Nakao, K., et al. (2011). Intrinsic transition of embryonic stem-cell differentiation into neural progenitors. Nature 470, 503-509. Kent, W.J., Sugnet, C.W., Furey, T.S., Roskin, K.M., Pringle, T.H., Zahler, A.M., and Haussler, D. (2002). The human genome browser at UCSC. Genome Res 12, 996-1006. Kim, D., Pertea, G., Trapnell, C., Pimentel, H., Kelley, R., and Salzberg, S.L. (2013). TopHat2: accurate alignment of transcriptomes in the presence of insertions, deletions and gene fusions. Genome Biol 14, R36. Langmead, B., Trapnell, C., Pop, M., and Salzberg, S.L. (2009). Ultrafast and memory-efficient alignment of short DNA sequences to the human genome. Genome Biol 10, R25. Mudge, J.M., and Harrow, J. (2015). Creating reference gene annotation for the mouse C57BL6/J genome assembly. Mamm Genome 26, 366-378. Orlova, V.V., van den Hil, F.E., Petrus-Reurer, S., Drabsch, Y., Ten Dijke, P., and Mummery, C.L. (2014). Generation, expansion and functional analysis of endothelial cells and pericytes derived from human pluripotent stem cells. Nat Protoc 9, 1514-1531. Robinson, M.D., McCarthy, D.J., and Smyth, G.K. (2010). edgeR: a Bioconductor package for differential expression analysis of digital gene expression data. Bioinformatics 26, 139-140. Saldanha, A.J. (2004). Java Treeview--extensible visualization of microarray data. Bioinformatics 20, 3246-3248. Subramanian, A., Tamayo, P., Mootha, V.K., Mukherjee, S., Ebert, B.L., Gillette, M.A., Paulovich, A., Pomeroy, S.L., Golub, T.R., Lander, E.S., et al. (2005). Gene set enrichment analysis: a knowledge-based approach for interpreting genome-wide expression profiles. Proc Natl Acad Sci U S A 102, 15545-15550. Zhang, Y., Liu, T., Meyer, C.A., Eeckhoute, J., Johnson, D.S., Bernstein, B.E., Nusbaum, C., Myers, R.M., Brown, M., Li, W., et al. (2008). Model-based analysis of ChIP-Seq (MACS). Genome Biol 9, R137.