General practice
Recruitment, retention, and time commitment change of general practitioners in England and Wales, 1990-4: a retrospective study Donald H Taylor Jr, Brenda Leese
National Primary Care Research and Development Centre, University of Manchester, 5th Floor Williamson Building, Manchester M13 9PL Donald H Taylor Jr, visiting research fellow Brenda Leese, research fellow Correspondence to: Dr Leese.
[email protected]. man.ac.uk BMJ 1997;314:1806–10
Abstract Objectives: To describe the recruitment and retention of general practitioners and changes in their time commitment from 1 October 1990 to 1 October 1994. Design: Retrospective analysis of yearly data. Setting: England and Wales. Subjects: General practitioners in unrestricted practice. Main outcome measures: Numbers of general practitioners moving into and out of general practice; proportion of general practitioners practising less than full time; proportion of general practitioners having unchanged time commitment over the study period; and proportion of general practitioners leaving general practice in 1991 who were subsequently practising in 1994. Results: Numbers of general practitioners entering general practice (1565 in 1990, 1400 in 1994) fell over the study period as did the numbers leaving general practice (1488 in 1990, 1115 in 1994). The net effect was an increase in both the total and full time equivalent general practitioners practising from 1 October 1990 (26 757 full time equivalents) to 1 October 1994 (27 063 full time equivalents). Numbers of general practitioners practising full time were decreasing whereas part time practice was increasing; women were more likely to practise part time. 35.5% (43/121) of women practising full time and 17.8% (24/135) of men practising full time who left practice in 1991 were practising again in 1994. Conclusion: Simply using total numbers of general practitioners or net increase to describe workforce trends masks much movement in and out of general practice and between differing time commitments. Recruitment and retention issues need to be separated if reasonable policies are to be developed to assure the necessary general practitioner workforce for a primary care led NHS.
Introduction There is growing concern that the future stock of general practitioners available to meet the challenges of a primary care led NHS will be inadequate. Professional journals, organisation special reports, and the media 1806
are filled with speculation about the future of Britain’s general practitioner workforce and the imminence of a workforce crisis.1-12 Attention to these issues has intensified since the 1990 general practitioner contract. However, there is disagreement over whether the problem facing general practice is recruitment,9 retention,13 or both. Though each is related to the present and future supply of general practitioners, they are distinct concepts whose resolution warrants different policy responses. It is important to distinguish the relative magnitude of any recruitment and retention problems if effective policies are to be developed. This paper aims at shedding light on the present situation by illustrating the historical flow of general practitioners entering and exiting general practice and between varying time commitments during the study period 1 October 1990 to 1 October 1994 in England and Wales. The paper describes actual changes in the general practitioner supply to inform the debate about general practitioner workforce requirements.
Methods The general practitioner census provides a comprehensive data source to study changes in the general practitioner workforce during 1990-4 (the data were not computerised before 1990). These data are aggregated by the STATS General Medical Services division of the NHS Executive (which collects information from family health services authorities—now the new health authorities) and contain information on all qualified general practitioners practising in the NHS in England and Wales. The focus of these analyses is on general practitioners in unrestricted practice at the national level. We analysed data for five points in time—namely, 1 October of each year during 1990-4. Part time commitment is defined as those general practitioners with three quarter time commitment (at least 19 hours a week), half time commitment (at least 13 hours a week), or job share (a total of 26 hours a week). Full time equivalent general practitioners were calculated as follows: general practitioners practising full time were given a weight of 1.0; three quarter time general practitioners were given a weight of 0.75; half time general practitioners were given a weight of 0.5; and job share general practitioners (two general practitioners who split duties associated with one post) BMJ VOLUME 314
21 JUNE 1997
General practice
1990 Full time 25 655 Part time 1602 Full time equivalent 26 757
Entry
Exit
1273 215
190
366
1200 1991 Full time 25 403 Part time 1929 Full time equivalent 26 644
365
1026 205
129
1174
345
1992 Full time 25 333 Part time 2311 Full time equivalent 26 790
371
881 196
134
1033
353
1993 Full time 25 262 Part time 2729 Full time equivalent 26 962
395
877 238
144
403
966 1994 Full time 25 093 Part time 3184 Full time equivalent 27 063
434
Entry or exit
Change from part time to full time
Change in time commitment
Change from full time to part time
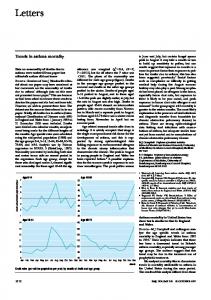
Fig 1 Entry, exit, and time commitment changes of general practitioners in England and Wales during 1990-4
were given a weight of 0.5. In 1990, 122 general practitioners had a missing value for their time commitment variable as had 12 in 1994; each of these general practitioners was assigned a weight of 1.0. The data were analysed by Paradox for Windows, a relational database, and Stata.
Results Figure 1 provides a national overview of the movement in and out of general practice and changes in time commitment by general practitioners over the study period. The number of general practitioners practising full time decreased over the study period (25 655 in 1990 to 25 093 in 1994, a 2.2% decline) whereas the number practising part time (either three quarter time, half time, or job share) almost doubled, from 1602 on 1 October 1990 to 3184 on 1 October 1994. Movements between full time and part time practice occurred in each direction, but more general practitioners reduced rather than increased time commitment in each year studied. BMJ VOLUME 314
21 JUNE 1997
Numbers of general practitioners entering general practice as full time unrestricted principals declined from 1200 in 1991 to 966 in 1994 whereas the numbers entering part time practice increased from 365 to 434 (fig 1, table 1). Numbers of full time general practitioners exiting general practice also decreased over the study period, from 1273 in 1991 to 877 in 1994; part time general practitioners exiting general practice rose from 215 in 1991 to 238 in 1994 (fig 1, table 1). Overall, more general practitioners entered general practice than exited, leading to an increase in the absolute number of general practitioners as well as in the number of full time equivalent general practitioners, which increased from 26 756.5 in 1990 to 27 062.8 by 1994 (1991 full time equivalents 26 643.8; 1992 full time equivalents 26 790.3; 1993 full time equivalents 26 961.5). Table 2 gives the numbers of general practitioners working part time for each study year. There were clear sex differences, women being more likely to practise part time when young, men being more likely to do so at an older age. Women were more likely to choose part time practice overall; 1054 (16.5%) of 6393 women did so in 1990 compared with 548 (2.6%) of 20 864 men. By 1994, 2304 (29.7%) of 7760 women practised part time compared with 880 (4.3%) of 20 517 men. These differences were significant (P = 0.000; Pearson’s ÷2 test). Table 3 shows the numbers of general practitioners who continued to practise at the same time commitment throughout the study period. Among full time unrestricted general practitioners on 1 October 1990, 82.2% of men (n = 16 703) and 75.5% of women (n = 4043) were still practising as full time unrestricted general practitioners on 1 October 1994. There was a higher attrition rate among general practitioners practising part time on 1 October 1990, particularly among men, three quarters of whom were no longer practising part time on 1 October 1994. Table 4 shows the numbers of general practitioners aged 40 or less who left general practice between 1 October 1990 and 1 October 1991 and who were subsequently practising on 1 October 1994. Women exiting were more likely than men to return to general practice whether they practised full time in 1990 (43 (35.5%) women returned v 24 (17.8%) men; ÷2 = 6.08, P = 0.014) or part time in 1990 (17 (40.5%) v 1 (14.3%); ÷2 = 0.95, P = 0.329).
Discussion In every year studied more general practitioners entered general practice than exited. Full time equivalent numbers of general practitioners increased over the study period. In addition, over 80% of male and 75% of female general practitioners practising full time on 1 October 1990 were still doing so on 1 October 1994 (table 3). This begs the question, is there a general practitioner workforce crisis? Though changes in the general practitioner workforce do not suggest an immediate inability to provide primary care in the NHS, these analyses identify several worrying trends. However, simply using the total number of unrestricted principal general practitioners or their net increase over time to characterise the general practitioner workforce may be misleading.14 15 Figure 1 1807
General practice
Table 1 General practitioners entering and exiting general practice on 1 October of each year during 1991-4 Full time
Part time
Men Average over four years
Women
Men
Total (%) over time period
Average over four years
Total (%) over time period
Average over four years
Women Total (%) over time period
Average over four years
Total (%) over time period
General practitioners entering Age < 30
203.3
813 (27.4)
126.5
506 (35.9)
8.2
33 (10.6)
69.8
279 (22.2)
30-34
343.5
1374 (45.4)
133.0
532 (37.8)
29.8
119 (38.3)
140.0
560 (44.7)
35-49
178.0
712 (24.0)
85.0
340 (24.1)
30.5
122 (39.2)
96.8
387 (30.9)
>50
23.3
93 (3.1)
7.5
30 (2.1)
9.3
37 (11.9)
7.0
Total
741.3
2965 (100.0)
352.0
1408 (100.0)
77.8
311 (100.0)
313.5
28 (2.2) 1254 (100.0)
General practitioners exiting Age < 35
58.8
235 (7.4)
67.5
270 (30.8)
3.3
13 (3.0)
45.0
180 (43)
35-49
145.5
582 (18.3)
66.5
266 (30.8)
12.8
51 (11.7)
34.3
137 (32.7)
50-59
236.5
946 (29.7)
44.8
179 (20.4)
11.8
47 (10.8)
13.0
52 (12.4)
>60
354.3
1417 (44.6)
40.5
162 (18.5)
81.0
324 (74.5)
12.5
50 (11.9)
Total
795.0
3180 (100.0)
219.3
877 (100.0)
108.8
435 (100.0)
104.8
419 (100.0)
÷2 Tests of significance (to test hypothesis that rows and columns of two way table are independent; Pearson ÷2) — to test full time: entries ÷2=39.39, P=0.000; part time: entries ÷2=80.68, P=0.000; full time: exits ÷2=491.71, P=0.000; part time: exits ÷2=384.67, P=0.000.
illustrates that there is substantial movement in and out of general practice and between varying time commitments from year to year. Using only net changes or total numbers of general practitioners masks this complexity. It is important to distinguish between movement into practice (recruitment) and movement Table 2 General practitioners practising part time on 1 October of each year during 1990-4 by age Men Age (years)
Women
Total
Average
No (%)
Average
No (%)
Average
No (%)
< 35
89.4
447 (13.6)
662.8
3314 (39.1)
752.2
3 761 (32.0)
35-49
200.0
1000 (30.4)
888.2
4441 (52.4)
1088.2
5 441 (46.3)
50-59
94.2
471 (14.3)
104.8
524 (6.2)
199.0
995 (8.5)
>60
273.4
1367 (41.6)
38.2
191 (2.3)
311.6
1 558 (13.3)
Total
657.0
3285 (100.0)
8470 (100.0)
2351.0
11 755 (100.0)
1694.0
Part time includes half time, three quarter time, and job share. ÷2 Test of significance (to test hypothesis that rows and columns of two way table are independent; Pearson ÷2) — to test whether sex and age categories are independent: ÷2=3681.34; P=0.000.
Table 3 Numbers (percentages) of unrestricted general practitioner principals practising on 1 October 1990 who were still practising with identical time commitment in 1991-4 Full time Date
Part time
Men
Women
Men
Women
1 October 1990
20 319 (100.0)
5339 (100.0)
548 (100.0)
1054 (100.0)
1 October 1991
19 134 (94.2)
4867 (91.2)
301 (55.0)
893 (84.7)
1 October 1992
18 278 (90.0)
4534 (85.0)
204 (37.2)
800 (75.9)
1 October 1993
17 507 (86.2)
4292 (80.3)
163 (29.7)
739 (70.1)
1 October 1994
16 703 (82.2)
4043 (75.7)
140 (25.5)
695 (65.9)
Total changes from 1 October 1990 to 1 October 1991 do not equal those shown in figure 1 over same period because 15 full time and four part time unrestricted general practitioners switched to restricted practice during period.
Table 4 Numbers (percentages) of general practitioners aged 40 or less who exited practice by 1 October 1991 and were practising on 1 October 1994 Men
Women
Full time on 1 October 1990 Total Left by 1 October 1991 Practising on 1 October 1994
7832
2835
135 (100.0)
121 (100.0)
24 (17.8)
43 (35.5)
Part time on 1 October 1990 Total
136
746
Left by 1 October 1991
7 (100.0)
42 (100.0)
Practising on 1 October 1994
1 (14.3)
17 (40.5)
÷2 For full time=6.07; P=0.014. ÷2 for part time=0.95, P=0.329.
1808
out of practice (retention) for general practitioners as well as time commitment changes. The components of the total number of general practitioners or net increase in their number (entries and exits) are the most important from a policy standpoint. Recruitment The decline in numbers of general practitioners entering general practice on a full time basis is the cause of most concern from our analyses. The causes of the decline are probably fourfold. Firstly, Lambert et al found that general practice is not as popular a career choice among newly qualified doctors as it was in the 1980s.16 In 1983, 44.7% of doctors finishing their preregistration year listed general practice as their first career choice, but by 1993 this had declined to 25.8%. Secondly, there is a related inability to fill vocational training schemes, which has an effect on moving newly trained doctors into general practice. Thirdly, there is the problem of vocationally trained doctors not moving into general practice.17 Finally, there is the rapid movement of general practitioners into practising on a part time basis. Should these trends continue or worsen there could eventually be serious difficulty in replenishing the core of the primary care workforce of the NHS. Part time service seems to be a permanent part of the career trajectory of substantial numbers of general practitioners. More women doctors entered general practice part time than full time in 1994 (347 v 317). The comparatively small movement from part time back to full time practice and the stability of women part time general practitioners over the study period (two thirds of those practising part time on 1 October 1990 were still doing so on 1 October 1994) suggest that many view part time commitment to general practice as a long term option. More general practitioners than otherwise necessary will be needed to maintain adequate full time equivalencies if the trend towards part time work continues or accelerates. It is the policy of the Department of Health to facilitate and encourage part time working opportunities in general practice,13 and this is a particularly important issue as the percentage of medical school graduates who are women rises. BMJ VOLUME 314
21 JUNE 1997
General practice Retention The numbers of general practitioners leaving the NHS on a yearly basis fell over the study period. The 1990 contract may have caused a short term rise in exits from general practice (particularly among older doctors who were compelled to retire), and since then things may have settled. It is unclear whether the rates of movement out of practice during the study period were similar to past rates or whether they are good long term predictors; but it seems probable that the years 1990-4 were unusually tumultuous and likely to entail greater dislocations than would normally be anticipated long term. Numbers of doctors leaving general practice show pronounced sex differences. Seven out of 10 men practising full time who leave are aged 50 or over. Though some men leave before retirement age, more young women doctors do so. A larger proportion of women who leave full time general practice do so at a younger age, making that group a potentially larger resource loss for a longer period. However, during the study period young women general practitioners who left practice were about twice as likely to return within three years. The patterns of movement in and out of general practice are complex. General practitioners who leave general practice will become an increasingly important workforce source, particularly if the decline in new entrants to general practice continues. Our results suggest that some exits and re-entries are planned. Others may represent a long term loss to general practice. The challenge will be to develop policies to keep particular groups of general practitioners from leaving or to entice them back into general practice. It is unclear whether re-entry schemes designed to encourage vocationally trained general practitioners not working in general practice to return will prove successful. Half of this group in the Trent region expressed an interest in such a scheme.18 New forms of contracting for providing general medical services seem certain to become a reality in the run up to a new general practitioner contract.19 20 Allowing community trusts or practices to contract for general medical services and then hire general practitioners to provide these services (probably for a fixed salary) might prove attractive to some doctors. How attractive and how widely such an option would be taken up by general practitioners will depend on the salary offered and the workload expected. But new contract options are unlikely to be a panacea for retention problems. More in depth understanding is needed regarding motivation, reasons, and the process that individual general practitioners use to make career decisions. This type of understanding cannot be gained from secondary data analyses such as these. What next? A key aspect of the workforce situation for which this paper cannot provide evidence is how workload in general practice has changed and how it will continue to change in a primary care led NHS. It has often been stated that the transfer of care from the secondary sector to primary care has occurred without the requisite resources following.21 22 Exactly what has changed and by how much since the 1990 contract and how much it may change further are not clear. But BMJ VOLUME 314
21 JUNE 1997
Key messages x Between 1990 and 1994 there was a fall both in the numbers of general practioners entering general practice and in the numbers leaving general practice x The net effect was an increase in both total and full time equivalent general practitioners practising from 1990 to 1994 x Women who left practice in 1991 were more likely than men to be practising again in 1994 x Using total numbers of general practitioners or net increase to describe workforce trends masks movement in and out of general practice and between differing time commitments x Recruitment and retention issues need to be separated if policies are to be developed to assure the necessary general practitioner workforce for a primary care led NHS
this information is crucial in determining how many general practitioners the NHS will need in the future. One way of deciding how many general practitioners are needed in a primary care led NHS is to decide what general practitioners will be expected to do; then it must be determined for how many patients a general practitioner can reasonably be expected to provide such services. The current effort to define core services is fundamental in this respect.21-23 Then we must determine how different core services are from what most general practitioners do today and how much a new definition of core services is likely to affect the need for full time equivalent numbers of general practitioners. The recent white paper Choice and Opportunity acknowledges that with regard to general practitioners’ career breaks, “part time working and changes in career or location are becoming increasingly common features and, alongside problems of GP recruitment in some areas, are challenging traditional models.”24 Furthermore, a more widely available salaried option for general practitioners25 may go some way towards aiding recruitment and retention in areas which have consistently experienced difficulties. The recent picture catalogued in this paper will serve as a basis for assessing the impact of the forthcoming reforms on recruitment, retention, and time commitment changes in general practice. We thank Catherine Faley, Debbie Godwin, and Steve Webster of the STATS General Medical Services division of the NHS Executive, Leeds. We also thank Martin Roland, Bonnie Sibbald, and David Wilkin for helpful comments on earlier drafts of this paper and Eileen Rendall for figure 1. Funding: The research was funded under the core programme of the National Primary Care Research and Development Centre by the Department of Health and by a postdoctoral fellowship (to DHT) from the United States Agency for Health Care Policy and Research. Conflict of interest: None. 1 2 3 4
Andalo D. GPs retire as recruitment falls. GP News 1996 June 21:36. Recognition of GP crises welcomed. Pulse 1996 June 15:8. Mashta O. Intake must rise by 5% annually. GP News 1996 June 21:19. GP workforce crisis: giving GPs control of their own destiny. Pulse 1996 June 15:3.
1809
General practice 5 6 7 8 9 10 11 12 13 14 15
Jobs crisis cure urged. Doctor 1996 June 13:22. Turner P, Gould M. GP workforce crisis: more GPs—but more of them are part time. Pulse 1996 June 8:3. Mihill C. Dwindling GPs mean crisis ahead for NHS. The Guardian 1996 Feb 22:9. Johnson N. MP’s motion on doctors’ plight. Manchester Metro News 1996 Feb 9:10. General Medical Services Committee. Medical Workforce Task Group report. London: British Medical Association, 1996. Olsen ND. Sustaining general practice. BMJ 1996;312:525-6. Report highlights recruitment crisis in general practice. BMJ 1996;312:514. Hastings A, Rashed A. General practice in deprived areas: problems and solutions. Br J Gen Pract 1993;43:47-8. Review Body on Doctors’ and Dentists’ Remuneration. Twenty-fifth report, 1996. London: HMSO, 1996. BMA Health Policy and Economic Research Unit. Economic indicators. Q Bull 1996;11:8. Department of Health. Statistics for general medical practitioners in England: 1984-94. London: HMSO, 1995.
16 Lambert TW, Goldacre MJ, Edwards C, Parkhouse J. Career preferences of doctors who qualified in the United Kingdom in 1993 compared with those doctors qualifying in 1974, 1977, 1980, and 1983. BMJ 1996; 313:19-24. 17 NHS must train 150 doctors for 100 GPs. GP News 1996 July 19:2. 18 Baker M, Williams J, Petchey R. GPs in principle but not in practice: a study of vocationally trained doctors not currently working as principals. BMJ 1995;310:1301-4. 19 Bower H. New GP contract within one year. Doctor 1996 June 13:1-2. 20 Anakor M. Bumpy ride to here and now. Doctor 1996 June 13:53. 21 O’Dowd A. GPs must deliver a clear mandate. Pulse 1996 June 15:10. 22 GPs fear being swamped with non-GMS work. Pulse 1996 June 15:7. 23 Bower H. Hard choices as GPs settle their differences. Doctor 1996 June 13:50. 24 Department of Health. Choice and opportunity. Primary care: the future. London: DoH, 1996.(Cm 3390.) 25 Department of Health. Primary care: delivering the future. London: DoH, 1996.(Cm 3512.)
(Accepted 16 April 1997)
Commentary: There is urgent need to raise recruitment—even to stand still James Parkhouse
Oxford OX2 9JA James Parkhouse Retired professor of postgraduate medical education
1810
Taylor and Leese’s paper is based on figures from the census maintained jointly by the Department of Health and the BMA. We deserve data as good as the authors’ analysis and discussion of them. General practice tables seem to be a good deal more reliable than recent hospital staff tables, but plenty of problems remain. Movements in and out of general practice have not been published in the 1990s, and Taylor and Leese do not distinguish between admissions and readmissions. Nevertheless, it is important for planning to know how many doctors come to and leave general practice from and to other jobs in the NHS, rather than outside sources. For what it is worth, 1989 figures show that 107 of the 1563 joiners in that year had been general practitioners in England or Wales. Of 1245 leavers, only nine entered the hospital service and 854 retired or died. This gives one measure of the potential for re-recruitment; another is the number of eligible doctors interested in retraining. But doctors moving to or from general practice in Scotland or Northern Ireland are not recognised in the England and Wales tables as readmissions because there are different datasets and tables for these parts of the NHS. Also the census shows only who was in post on a certain day, so an absence of four or five months could pass unrecorded. Notable changes are the increasing numbers of women general practitioners and the rise, between 1990 and 1994, from 5.9% to 11.3% in the proportion of principals working less than full time. The total work contribution, expressed by the whole time equivalent for all principals, rose, but by only 1.1% over the four years. The October 1995 tables show a further rise to 11.6% part time or job share principals with no increase at all in the overall whole time equivalent. This supports the urgency of raising recruitment even to stand still. And these figures refer only to principals; the work contribution of assistants, trainees, and locums would need an additional study.
Most disturbing is the unevenness in quality of service1 reflected in the figures. At the end point of this study Enfield and Haringey, and Merton, Sutton, and Wandsworth had 12.0% and 13.1%, respectively, of principals aged 60 or over. Forty eight per cent and 37% of practices were single handed, and average list sizes were quoted as 2124 and 2019. Compare this with Oxfordshire or Suffolk, with 2% of principals aged 60 or more, 14-15% single handed practices, and average list sizes below 1800. Who will replace the hardworked, elderly, singlehanded doctors in inner city practices? Young doctors have high expectations and understandably look to combine medicine with a reasonable personal and family life.2 The anxieties of many doctors3 should be equalled by public concern. When we listen to doctors—the vital organs that breathe life into the NHS—we don’t always hear the bright ring of words that tell of the excitement of starting a job and the fond sadness of farewell. We may hear whispering defectoriloquy, segmental megaphony, faint trepidations in the upper zones, and persistent basal congestion. Pending specific diagnoses, generous cover with the broad spectrum antibiotic—cash—would give reassurance with negligible risk. 1 2 3
Leese B, Bosanquet N. Change in general practice and its effects on service provision in areas with different socioeconomic characteristics. BMJ 1995;311:546-50. British Medical Association. Core values for the medical profession in the 21st century. London: BMA, 1995. (Survey report.) Mardell L. Single-handed GPs fight to keep their independence. Overseas Doctors Association News Review 1997;4(No 10):9.
Endpiece Administrators are never popular He that goeth about to persuade a multitude that they are not so well governed as they ought to be, shall never want attentive and favourable hearers. Richard Hooker, The Laws of Ecclesiastical Polity (1594)
BMJ VOLUME 314
21 JUNE 1997