Genetic Algorithms Research and. Application Group (GARAGe). ECE Department, Engineering. Building, Michigan State. University,. East Lansing, MI 48864.
Genetic Algorithm Optimized Feature Transformation, a Comparison with Different Classifiers
Zhijian Huang
Min Pei
Erik Goodman
Electrical and Computer Engineering Dept. Michigan State University East Lansing, MI 48824
Genetic Algorithms Research and Application Group (GARAGe) ECE Department, Engineering Building, Michigan State University, East Lansing, MI 48864
Genetic Algorithms Research and Application Group (GARAGe) ECE Department, Engineering Building, Michigan State University, East Lansing, MI 48864
Yong Huang Computer Center East China Normal University 3663 Zhong Shan North Road Shanghai 200062
Abstract
When using Genetic Algorithm (GA) to optimize the feature space of pattern classification problems, the performance improved is not only determined by the data set used, but also depend on the classifier. This work compares the improvements acquired by GA optimized feature transformations on several simple classifiers. Some traditional feature transformation techniques, such as Principle Component Analysis (PCA) and Linear Discriminant Analysis (LDA) are also tested to see their effects on the GA optimization. The results based on a real world data and five benchmark data sets from UCI repository show that the improvements after GA optimized feature transformation are in reverse ratio with the original classification rate if the classifier is used alone. Also it is shown that the PCA and LDA transformations on the feature space prior to the GA optimization improved the final result.
1
INTRODUCTION
The genetic algorithm (GA) has been tested as an effective searching method for high dimensional complex problems, by its capability of escaping local optima and find optimal or near optimal solution. In pattern classification, GA is widely used for parameters tuning,
Gaoping Li Electrocardiograph Research Lab Medical College Fudan University 220 Han Dan Road Shanghai 200433 feature weighting [Pei, 1998] and prototype selection [Skalak, 1994]. Feature extraction and selection is a very important phase for a classification sysytem, because the selection of feature subset will greatly affect the classification result. GA has been used in the area of feature extraction recently. The optimization of feature space using GA can be linear [Punch, 1993], or non-linear [Firpi, 2001], where in both cases, GA stochastically but efficiently searches in a very high dimensional data space that makes the traditional deterministic searching methods run out of time. Also in this field the GA approach can be combined with other traditional feature transformation methods. Prakash presented the combination of GA with Principle Component Analysis (PCA), where instead of the few largest Principle Components (PCs), a subset of PCs from the whole spectrum was chosen by GA to get the best performance [Prakash, 1995]. In this work, three classifiers: a kNN classifer, a Bayes classifier and a Linear Regression classifier are tested, together with the PCA and LDA transformations. One real world data, the Electrocardiogram (ECG) data, and five benchmark data sets from the UCI Machine Learning Repository [Blake, 1998] are used as testing data sets. The paper starts with the introduction to the approaches of GA in the area of pattern classification in section 2, followed by our solution designed in section 3. Section 4 presents the result on ECG data with detailed comparison with regard to both classifier choice and the use of PCA/LDA transformations. Section 5 extends the tests to the five benchmark pattern classification test sets, by using the best solutions on PCA/LDA combination found
in section 4. Section 6 concludes the paper and section 7 proposes some possible future works.
2
GA IN PATTERN CLASSIFICATION
Generally the approaches using GA in classification can be divided into two groups:
pattern
•
Directly apply GA as part of the classifier.
•
Optimizing parameters in pattern classification.
2.1
DIRECTLY APPLICATION OF GA AS PART OF THE CLASSIFIER
When direct apply GA as part of the classifier, the main difficulty is how to represent the classifier using the GA chromosome. Bandyopadhyay and Murthy proposed an idea using GA to perform a direct search on the partitions of an N dimensional feature space, where each partition represents a possible classification rule [Bandyopadhyay, 1995]. In this approach, the decision boundary of the N dimensional feature space is represented by H number of lines. Genetic Algorithm is used to find those lines that minimize the misclassification rate of the decision boundary. The line number H turns out to be a parameter similar to the k in kNN classifier. More lines (higher H) do not necessarily improve the classification rate, due to the effect of over fitting. In addition to using lines as space separator, Srikanth et al [Srikanth, 1995] also gave a novel method clustering and classifying the feature space by ellipsoids. 2.2
OPTIMIZING PARAMETERS IN PATTERN CLASSIFICATION BY GA
However, most of the approaches using GA in pattern classification do not design the classifier using GA. Instead, GA is used to estimate the parameters of the pattern classification system, which can be categorized into the following four classes: 2.2.1
GA Optimized Feature Selection and Extraction
Feature selection and extraction is the most widely used area in pattern classification for GA. The classification rate is affected indirectly when different weights are applied to each features. Genetic Algorithm is used to find a set of optimal feature weights that can improve the classification performance on training samples. Before GA optimized feature extraction and selection, traditional feature extraction techniques such as the Principle Component Analysis (PCA) can be applied [Prakash, 1995], while after that, a classifier should be used to calculate the fitness function for GA. The most commonly used classifier is the k-Nearest Neighbor classifier [Siedlecki, 1989] [Pei, 1998].
2.2.2
GA Optimized Prototype Selection
In supervised pattern classification, the reference set or training samples are critical for the classification of testing samples. Genetic Algorithm can be also used in the selection of prototypes in case based classification [Skalak, 1994] [Kuncheva, 1995]. In this approach, a subset of the most typical samples are chosen to form a prototype, on which the classification for testing and validation samples are based. 2.2.3
GA Optimized Classifier
GA can be used to optimize the input weight or topology of a Neural Network (NN) [Firpi, 2001]. It is intuitive to give weights for each connections in NN. By evolving the weighs using GA, it is possible to throw away some connections of the neural network if their weights are too small, thus optimizes the topology of the NN too. 2.2.4
GA Optimized Classifier Combination
The combination of classifiers, or sometimes referred as Bagging and Boosting [Duda, 2001], may also be optimized by Genetic Algorithm. Kuncheva and Jain [Kuncheva, 2000] in their design of the Classifier Fusion system, not only select the features, but also select the types of the individual classifiers using Genetic Algorithm.
3
GA OPTIMIZED FEATURE TRANSFORMATION ALGORITHM
This section first reviews the two models for the feature extraction and selection of pattern classification. Then a GA optimized feature weighting and selection algorithm based on the wrapper model [Kohavi,1998] is proposed, outlining the structure of the experiment in this paper. 3.1
THE FILTER MODEL AND THE WRAPPER MODEL
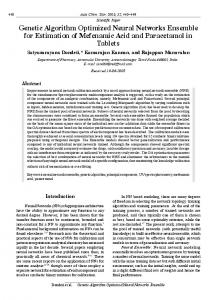
For the problem of feature extraction and selection in pattern classification, two models play important roles. The filter model chooses feature by heuristically “goodness”, or knowledge, while the wrapper model does this by the feedback of the classifier evaluation, or experience. Figure 1 illustrates the differences between these two models:
Figure 1: Comparison of filter model and wrapper model Research showed that wrapper model performs better than filter model comparing the predictive power on unseen data [John, 1994]. Some widely used feature extraction approaches, such as Principle Component Analysis (PCA), belongs to the Filter model because it ranks the features by there intrinsic property: Eigenvalues of the covariance matrix. Most feature selection or extraction techniques emerged recently are categorized to be Wrapper Model, by taking consideration of the classification result of a particular classifier. For example, the GFNC (Genetically Found, Neurally Computed) approach by Firpi [Firpi, 2001] uses GA and Neural Network for the non-linear feature extraction with the feedback from a kNN classifier as the fitness function for the Genetic Algorithm. A modified PCA approach proposed by Prakash also uses Genetic Algorithms to search for the optimal feature subset with the feedback result of the classifier [Prakash, 1995]. 3.2
GA OPTIMIZED PATTERN CLASSIFICATION WITH FEATURE WEIGHTING
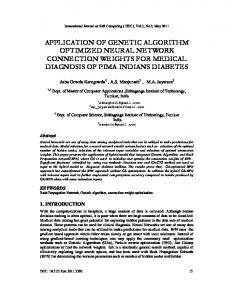
Consider the wrapper model introduced above, in any of the pattern classification systems with weighted features, there are five components that need to be determined: •
The data set used.
•
The feature space transformation to be applied on the original feature space, known as the feature extraction phase in traditional pattern classification systems.
•
The optimization algorithm which searches for the best weighting for the features;
•
The classifier used to get the feedback, or fitness, for the GA, of the feature weighting. (The Induction Algorithm in Wrapper Model [Kohavi, 1998] )
•
The classifier to calculate the final result for the classification problem based on the newly weighted features (the classifier for the result).
Figure 2: Classification System with Feature Weighting From Figure 2, we can see that among these components, the feature space transformation, the optimization and the classifier are the plug-in procedures for feature weighting optimization. The feature weighting framework is the plug-in procedure in traditional classification systems that transforms the feature space, weights each feature, and evaluates and optimizes the weight attached to each feature. In this paper, we can replace each of the components listed above by the specific choices we made as following: Data: ECG data and five other data sets from UCI repository. Feature Space Transformation: PCA, LDA and their combinations. Optimization Algorithm: Genetic Algorithm or None. When implemented with different classifiers, feature weighting for kNN classifier, and feature selection for other classifiers. The reason for using feature weighting for kNN classifier is because of its distance metric, that will affect the classification result by changing weight [Pei,1998], while for Bayes classifier and linear regression classifier, feature weighting does no more effect on the training error comparing with feature selection [Huang, 2002]. Classifier (induction algorithm): A kNN classifier, a Bayes classifier and a linear regression classifier. Classifier for Result: induction algorithm.
Same classifier as used for the
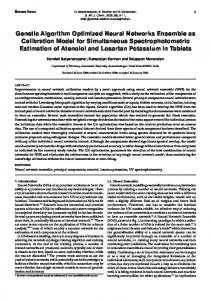
Figure 3 is the GA optimized feature transformation algorithm used in this paper:
These components can be illustrated as Figure 2:
Figure 3: GA optimized feature transformation algorithm
4
TEST RESULT FOR ECG DATA
The test results for ECG data, with various settings regarding to the feature space transformation, using GA or not, and using which classifier are presented and
compared in this section. We will first discuss the experiments settings then move on to the results. 4.1
of the Null Hypothesis (the improvement is 0) is also given, among which results having a 95% significant improvement are in bold font.
EXPERIMENT SETTINGS
The ECG data used in this paper is directly extracted from the 12-lead, 10-second digital signal acquired from Shanghai Zhongshan Hospital, containing 618 normal ECG cases and 618 abnormal cases. The abnormal cases contain three different kinds of diseases with roughly the same number of cases. Totally 23 features, including 21 morphological features and 2 frequency domain features, are extracted from the original signal. For a non-GA optimized classifier, the data is partitioned to training samples and validation samples. While for a GA optimized algorithm, the data is partitioned into training data, testing data and validation data, in a n-fold cross validation manner. If not specifically indicated, here the n is set to be 10. Table 1 lists the details for data participations. Table 1: Summary of Data Partitioning Experiments
Training
Testing
Validation
Non-GA
40%
N/A
60%
GA (n-fold)
40%× n − 1
60%× n − 1 n
1 n
n
Table 2: Result of kNN classifier (k = 5) Settings
kNN (k = 5) Results of Classification Rate in %
Feature Trans
NonGA
None PCA LDA Both
GA
Trn
73.09 74.54 78.29 74.10 77.16 79.39 73.09 77.00 78.72 72.41 75.38 79.82 Overall P value:
Improve 1.45±3.23 3.06±1.59 3.91±2.24 2.97±2.78
PValue 0.3008 0.0043 0.0065 0.0404 0.0000
In addition to the row-wise statistics, an overall improvement significant level based on the improvement percentage is calculated for each classifier, which is a P value on all the improvement ratio values of that classifier. This significance indicator can be considered as a final summary of the GA improvement based on a particular classifier and is listed at the bottom of each table. Table 3: Result of Bayes classifier
A simple genetic algorithm (SGA) is used here to do the optimization. The crossover rate is 30% and the mutation rate is set to 0.03 per bit. The program runs for 200 generations with a population size of 50 individuals (80 individual for kNN feature weighting). When there has been no improvement within the last 100 generations, then the evolution is halted.
Settings Feature Trans None PCA LDA Both
About the classifiers, a 5-nearest neighbor classifier is used. A Bayes Plug-In classifier with its parameters estimated by the Maximum Likelihood Estimation (MLE) is implemented, while a linear regression classifier uses the simple multivariate regression combined with a threshold decision to predict the class labels.
GA
Trn
71.92 74.19 76.51 72.53 74.27 77.23 72.95 75.47 77.23 71.85 76.99 78.33 Overall P value:
Settings Feature Trans None PCA LDA Both
RESULTS AND CONCLUSIONS
Tables 2-4 list the results of GA-optimized feature extraction using a kNN classifier (k=5), Bayes Plug-In classifier and linear regression classifier. The improvement after GA optimization is presented by the average improvement with a two-tailed t-test with a 95% confidence interval. A P value indicating the probability
NonGA
Improve 2.27±3.69 1.75±1.95 2.52±3.11 5.14±2.54
PValue 0.1912 0.0730 0.0968 0.0014 0.0000
Table 4: Result of Linear Regression classifier
With the kNN classifier, the feature weighting was allowed to range from 1024 different values between 0 to 10 with minimum changes of about 0.01, as determined by the GA, by setting the chromosome for each feature to be 10 binary digits. With the Bayesian classifier and linear regression classifier, only feature selection was tested. 4.2
Bayes Results of Classification Rate in %
Linear Regression Results, Rate in % NonGA
GA
Trn
77.68 76.49 79.08 76.48 78.02 79.87 78.44 77.42 77.36 77.59 77.41 77.84 Overall P value:
Improve -1.19±3.23 1.53±3.09 -1.02±3.15 -0.18±2.79
PValue NA 0.25 NA NA NA
Conclusions: 1.
For the ECG data, the utility of GA optimized feature weighting and selection depends on the classifier used. The GA-kNN feature weighting and GA-Bayes feature selection yield significant improvement, with
three rows showing a significant level more than 90%, and the fourth showing less improvement, but in the same direction. As a result, the overall significance based on the improvement ratio is 99.99%. In contrast, the GA-optimized linear regression classifier does not show improved performance, and the inconsistency of change direction makes it likely that any systematic improvement due to the GA-optimized weights, if it exists, is very small. 2.
3.
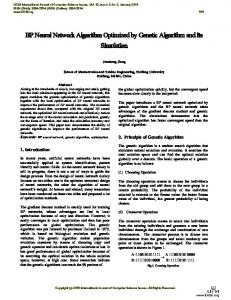
The PCA and/or LDA transformation is useful, with the combination of GA optimization. As we can see from the kNN and Bayes classifiers, although applying the PCA and/or LDA transformation on Non-GA optimized classifiers show no big progress, their combination with GA yield significant improvement as well as better final classification rates. In some sense, PCA and LDA transformation can help GA to break the “barrier” of the optimum classification rate. The more accurate the original classifier is, the less improvement GA optimization yields. From the data, we can see that the linear regression classifier is the most powerful classifier if used alone, and also the least improved classifier after GA optimization. Figure 4 illustrates this conclusion:
Figure 5: The GA Searching Space (Best Found) In Figure 5, the global optimum is found. While in Figure 6, though quite a good result, the global optimum is not found by GA. However, since the classification rate for the validation samples are related but not linearly dependant on the training rate got by GA, so a near optimal result seems to be enough for a pattern classification problem.
Figure 4: Summary of the ECG Classification Rate 4.3
RESULTS OF GA SEARCHING
For small number of features (here we set the standard: ≤15) in feature selection, it is possible to apply an exhaustive search in the whole feature space, thus providing the possibility to determine whether the GA can find the best solution or not. At the same time, some information about the usefulness of features can be traced from the terrain graph of the whole feature space.
Figure 6: The GA Searching Space (Best Not Found)
5
TEST RESULT FOR OTHER DATA
Five data sets from UCI repository is tested to further validate our result from the previous section. A brief introduction to the data sets is given first, followed by the results and discussions.
5.1 •
THE TESTING DATASETS DATA
WDBC: The Wisconsin Diagnostic Breast Cancer [Mangasarian,1998] data contains 30 features expanded from the original 10 features by taking mean, standard error and extreme value of the originally measured features. The dataset has 357 benign and 212 malignant samples, with highest reported classification accuracies around 97%.
•
LIVER: The BUPA Liver Disorders data has 6 numerical features on 345 instances, with 2 classes.
•
PIMA: The Pima Indians Diabetes Database has 8 features on female diabetes patients, classified to be positive and negative. The total of 768 samples has 500 negative and 268 positive samples.
•
SONAR: The Sonar data compares mines versus rocks based on their reflected sonar signals. With the 111 metal patterns and 97 rock patterns, each of them has 60 feature values [Gorman, 1988].
•
IONO: The Ionosphere database from Johns Hopkins University [Sigilito, 1989], contains 351 instances of the radar signals returned from the ionosphere, with 34 features. It contrasts "Good" and "Bad" radar returns that show or not show evidence of some types of structure in the ionosphere.
5.2
WDBC LIVER PIMA SONAR IONO
NonGA
GA
Trn
94.43 95.26 95.49 66.04 67.23 66.33 76.57 76.69 77.55 63.65 72.44 74.78 85.12 82.61 84.98 Overall P value:
Improve 0.83±2.50 1.19±6.21 0.11±3.14 8.79±9.91 -2.51±5.78
PValue 0.4737 0.6752 0.9364 0.0757 NA 0.1364
1.
More that half of the row-wise results show an improvement with significance above 90%. For some settings, such as Bayes classifier for SONAR data, the original classification rate is very low, but GA can make up this and yield a decent result. The effect of GA optimization here is to reach a fairly good result, if not the best, when the original settings of the classifier is unfortunately not good.
2.
The linear regression classifier has the highest classification rate among the three. After GAoptimized feature weighting and selection, the gaps in performance among the various classifiers became smaller. As shown is Figure 7:
RESULTS FOR BENCHMARK DATA SETS
The results presented here are all based on both PCA and LDA transformation, which are tested to be useful in the GA optimized pattern classification in section 4. Table 5: kNN classifier (Benchmark Data Sets) DATA WDBC LIVER PIMA SONAR IONO
NonGA
GA
Trn
91.38 94.19 92.24 66.36 66.64 72.89 70.44 72.65 76.97 69.28 74.97 64.06 79.19 80.32 69.98 Overall P value:
Improve 2.81±2.93 0.28±6.28 2.21±2.90 5.69±5.91 1.13±3.13
PValue 0.0571 0.9126 0.1076 0.0563 0.3986 0.0001
Table 6: Bayes classifier (Benchmark Data Sets) DATA WDBC LIVER PIMA SONAR IONO
NonGA
GA
Trn
94.78 94.71 96.66 56.96 64.00 67.40 72.91 74.74 76.30 46.83 68.27 76.37 64.88 90.64 94.17 Overall P value:
Improve -0.07±2.44 7.04±6.57 1.84±3.73 21.45±10.77 25.76±11.52
PValue NA 0.0334 0.2864 0.0015 0.0000 0.0000
Table 7: Regression classifier (Benchmark Data Sets)
Figure 7: Comparison, before and after GA optimization
6
CONCLUSIONS
The utility of GA-optimized feature weighting and selection depends on both the classifier and the data set. Especially in those cases when a particular classifier has a better classification rate than some other classifiers, the potential improvement from GA optimization of the better classifier seems to be quite limited in comparison with the performance improvement of the poorer classifiers. Clearly, to evaluate a new approach involving optimization on feature space, it is necessary to test on different classifiers, and the improvement in the best classifier will be the most convincing evidence of the utility of that method.
In this work, the Genetic Algorithm shows powerful searching ability in high-dimensionality feature spaces. By comparing it with an exhaustive search algorithm on small-scale problems, it was determined that the GA found the optimal or a nearly optimal solution with a computational complexity of O(n). The results from sections 4 and 5 indicate that over-fitting exists in various approaches. While the training performances can be significantly improved, the improvements on the validation samples lag behind in every cases. The tests run in section 4 show that the PCA and LDA transformation is very useful in pattern classification. The significant levels of GA optimization are greatly improved for the kNN and Bayes classifiers, though the absolute values after PCA and LDA transformation without GA optimization do not differ much from the non PCA and LDA cases. By this point, GA optimized feature extraction and selection extends the utilities of those traditional feature transformation techniques.
7
FUTURE WORKS
To solve the problem of over-fitting, one possible approach is to evaluate the solution not only by the classification rate on training data, but also to consider the margin between classes and the boundary, because a larger margin means a more general and more robust classification boundary. Support Vector Machines (SVM) are classification systems that separate the training patterns by maximizing the margins between support vectors (those nearest patterns) and the decision boundary in a high-dimensional space. Work by Gartner and Flach [Gartner, 2001] that use SVM rather than a GA to optimize the feature space yielded a statistically significant result on Bayes classifiers. Another possible improvement may be non-linear feature construction using GA [Firpi, 2001]. Non-linear feature construction can generate more artificial features so that the GA can search for more hidden patterns. However, the problem of over-fitting still theoretically exists. This work was supported in part by the National Science Foundation of China (NSFC) under Grant 39970210
References [Bandyopadhyay, 1995] S Bandyopadhyay, C A Murthy, (1995) “Pattern Classification Using Genetic Algorithms”, Pattern Recognition Letters, Vol. 16, pp. 801--808 (1995). [Blake, 1998] Blake, C.L. & Merz, C.J. (1998). UCI Repository of machine learning databases [http://www.ics.uci.edu/~mlearn/MLRepository.html]. Irvine, CA: University of California, Department of Information and Computer Science.
[Duda, 2001] Richard O. Duda, Peter E. Hart, David G. Stock, “Pattern Classification”, Second Edition, Wiley 2001 [Firpi, 2001] Hiram A. Firpi Cruz, (2001) “Genetically Found, Neurally Computed Artificial Features With Applications to Epleptic Seizure Detection and Prediction” Master Thesis, University of Pueto Rico. [Gartner, 2001] Thomas Gartner, Peter A. Flach, (2001) “WBCSVM: Weighted Bayesian Classification based on Support Vector Machine”, Eighteenth International Conference on Machine Learning (ICML-2001), pp. 156161. Morgan Kaufmann, 2001 [Gorman, 1988] Gorman and T. J. Sejnowski (1988), “Learned classification of sonar targets using massively parallel network”, IEEE Transactions on Acoustic, Speech and Signal Processing, 36 (7), Page 1135—1140 [John, 1994] George H. John, Ron Kohavi, Karl Pfleger, (1994) "Irrelevant Features and the Subset Selection Problem", Proceedings of the Eleventh International Conference of Machine Learning Page 121-129 Morgan Kaufmann Publishers, San Francisco, CA [Kohavi, 1998] Ron Kohavi, George John, (1998) “The Wrapper Approach”, Feature Extraction, Construction and Selection: A Data Mining Perspective. Edited by Hiroshi Motoda, Huan Liu, Kluwer Academic Publishers, July 1998 [Kuncheva, 1995] Ludmila I. Kuncheva, (1995) “Editing for the k-nearest neighbors rule by a genetic algorithm”, Pattern Recognition Letters, Vol. 16, pp. 809—814, 1995 [Kuncheva, 2000] Ludmila I. Kuncheva and Lakhmi C. Jain, (2000) “Designing Classifier Fusion Systems by Genetic Algorithms”, IEEE Transactions on Evolutionary Computation, Vol. 4, No. 4, September 2000 [Mangasarian, 1998] O.L. Mangasarian, W.N. Street and W.H. Wolberg. “Breast cancer diagnosis and prognosis via linear programming”, Operations Research, 43(4), page 570-577, July-August 1995. [Pei, 1998] M. Pei, E. D. Goodman, W. F. Punch, (1998) "Feature Extraction Using Genetic Algorithms", Proceeding of International Symposium on Intelligent Data Engineering and Learning'98 (IDEAL'98) Hong Kong, Oct. 98 [Prakash, 1995] M. Prakash, M. Narasimha Murty, (1995) "A Genetic Approach for Selection of (Near-) Optimal Subsets of Proncipal Components for Discrimination", Pattern Recognition Letters, 1995 Vol. 16, page 781— 787 [Punch, 1993] W.F. Punch, E.D. Goodman, Min Pei, Lai Chia-Shun, P. Hovland and R. Enbody, (1993) “Further Research on Feature Selection and Classification Using Genetic Algorithms” In 5th International Conference on Genetic Algorithms, Champaign IL, pp 557-564, 1993 [Siedlecki, 1989] W. Siedlecki, J. Sklansky, (1989) “A note on genetic algorithms for large-scale feature
selection”, Pattern Recognition Letters, Vol. 10, Page 335--347, 1989 [Sigilito, 1989] V.G. Sigilito, S. P. Wing, L. V. Hutton and K. B. Baker. 1989. “Classification of radar returns from the ionosphere using neural networks”, Johns Hopkins APL Technical Digest, 10, Page 262--266 [Skalak, 1994] David B. Skalak, (1994) “Using a Genetic Algorithm to Learn Prototypes for Case Retrieval and Classification” Proceedings of the AAAI-93 Case-Based Reasoning Workshop, pp. 64-69, Washington, D.C., American Assocation for Artificial Intelligence, Menlo Park, CA, 1994. [Srikanth, 1995] R. Srikanth, R. George, N. Warsi, D. Prabhu, F.E.Petry, B.P.Buckles, (1995) “A VariableLength Genetic Algorithm for Clustering and Classification”, Pattern Recognition Letters, Vol. 16, pp. 789—800, 1995